| Journal of Clinical Medicine Research, ISSN 1918-3003 print, 1918-3011 online, Open Access |
| Article copyright, the authors; Journal compilation copyright, J Clin Med Res and Elmer Press Inc |
| Journal website https://jocmr.elmerjournals.com |
Original Article
Volume 17, Number 2, February 2025, pages 89-96

Metabolomics for Distinguishing Cardiovascular Risk in Rheumatoid Arthritis Across Different Disease-Modifying Antirheumatic Drug Therapies
Inga Clausa, Meike Hoffmeisterb, Selina Strathmeyerc ![]() , Steffen
Heelemannc
, Steffen
Heelemannc ![]() , Constantin Remusa, Werner
Dammermannd, Oliver Rittera, Daniel Patschana, e
, Constantin Remusa, Werner
Dammermannd, Oliver Rittera, Daniel Patschana, e ![]() , Susann
Patschana
, Susann
Patschana
aDepartment of Internal Medicine I - Cardiology, Nephrology and Internal Intensive
Medicine, Brandenburg University Hospital, Brandenburg Medical School (Theodor Fontane), 14770
Brandenburg an der Havel, Germany
bInstitute of Biochemistry, Brandenburg
Medical School (Theodor Fontane), 14770 Brandenburg an der Havel,
Germany
cLifespin GmbH, 93053 Regensburg, Germany
dDepartment of
Internal Medicine II - Gastroenterology and Endocrinology, Brandenburg University Hospital,
Brandenburg Medical School (Theodor Fontane), 14770 Brandenburg an der Havel,
Germany
eCorresponding Author: Daniel Patschan, Department of Internal Medicine
I - Cardiology, Nephrology and Internal Intensive Medicine, University Hospital of Brandenburg,
Brandenburg Medical School (Theodor Fontane), 14770 Brandenburg an der Havel, Germany
Manuscript submitted November 18, 2024, accepted January 6, 2025, published online February 13,
2025
Short title: Metabolomics and Cardiovascular Risk in RA
doi:
https://doi.org/10.14740/jocmr6145
| Abstract | ▴Top |
Background: Rheumatoid arthritis (RA) significantly increases the overall risk of cardiovascular disease (CVD). In addition to conventional risk factors, the inflammatory activity of the disease itself and medications that promote atherosclerosis contribute to an even greater risk. In this study, we performed metabolomic analysis in RA patients, both on and off disease-modifying anti-rheumatic drug (DMARD) therapy, with the aim of identifying new candidates for more sophisticated cardiovascular risk (CVR) assessment.
Methods: This is an observational, cross-sectional investigation that included patients with established RA. DMARD therapy, if prescribed, consisted of methotrexate (MTX) alone or in combination with other conventional disease-modifying anti-rheumatic drugs (cDMARDs) or biologic disease-modifying anti-rheumatic drugs (bDMARDs), or other cDMARDs or bDMARDs without MTX, respectively. Metabolomic profiling was conducted using a Bruker AVANCE NEO 600 MHz nuclear magnetic resonance (NMR) spectrometer. The spectra obtained were Fourier transformed using TopSpin software (version 4.0, Bruker Biospin, Germany). All spectra were automatically phased and subjected to baseline correction. Subsequently, the spectra were analyzed using the proprietary Profiler software (version 1.4_Blood, lifespin GmbH, Germany), and a quantitative metabolite list was generated.
Results: In total, 200 patients were included in the study, 54 subjects were not receiving any DMARDs (n = 47 untreated at the time of inclusion, n = 7 with established disease but not receiving DMARD therapy), and 146 were receiving DMARD treatment. No metabolic differences were found in relation to drug therapy or RA activity. The following CVR factors were associated with significant metabolic abnormalities: distress, arterial hypertension, diabetes mellitus and an average higher Framingham score. Distressed individuals showed abnormalities in histidine metabolism.
Conclusions: Our findings have aided in the identification of potential surrogate markers for assessing the burden of CVD in individuals with RA. Histidine may be of particular diagnostic importance in CVR assessment in RA.
Keywords: Metabolomics; RA; Cardiovascular risk; DMARDs; Disease activity
| Introduction | ▴Top |
Rheumatoid arthritis (RA) affects approximately 1% of adults in Central Europe [1], making it the most commonly isolated disease within the inflammatory rheumatic diseases. The etiology and pathogenesis of RA remain unknown, but at the core of the chronic inflammatory process is a progressive inflammation of the synovial membrane, which can lead to disability if not adequately treated. Extra-articular organ manifestations are possible, especially in seropositive individuals [2]. RA patients are particularly at risk for cardiovascular diseases (CVD). Meanwhile, cardiovascular risk (CVR) assessment and adequate anti-atherogenic therapy for those affected have become integral components of RA management. The European League Against Rheumatism (EULAR) published recommendations for the detection and treatment of cardiovascular complications in RA as early as 2015 [3].
In the general population, the risk of conditions such as heart attack or stroke is commonly assessed according to guidelines set by the European Society of Cardiology (ESC) [4]. This assessment focuses on numerous factors, including general characteristics such as age, gender, and family history. It also takes into account pro-atherogenic morbidities (arterial hypertension including severity, diabetes mellitus, hyperlipidemia). Additionally, hypertensive or atherogenic organ changes need to be identified and quantified. The limitations of this system become apparent in individuals with inflammatory rheumatic diseases. Not captured are the proatherogenic effects of chronic inflammatory processes themselves, as well as the potential side effects of medications such as glucocorticoids and non-steroidal anti-inflammatory drugs (NSAIDs) [5]. Similarly, not accounted for are the potential cardioprotective effects of disease-modifying anti-rheumatic drugs (DMARDs) like methotrexate (MTX) [6]. Due to the identified diagnostic limitations of established strategies for CVR risk stratification, biomarkers could potentially help to fill relevant diagnostic gaps.
Metabolomics involves the detection and quantification of low-molecular-weight molecules in biological specimens such as blood or tissue samples [7]. The concept of “omics” shall enable researchers to evaluate the complexity of biological processes in a more sophisticated manner. In this study, we conducted metabolomics analysis on RA patients undergoing different DMARD therapy regimens and exhibiting varying levels of CVD risk factors. The aim was to identify new candidate molecules that could potentially aid in CVD risk assessment.
| Materials and Methods | ▴Top |
Design
The study is an observational, cross-sectional, monocentric study conducted at the Health Center of the Brandenburg University Hospital (Brandenburg Medical School Theodor Fontane) from November 2022 to January 2023. The study was formally approved by the Ethics Committee of the Brandenburg Medical School (location: Neuruppin, Brandenburg, Germany, approval number: E-01-20200316, approval date: October 29, 2020; approval of amendment: November 11, 2022). All participants provided written informed consent by signing an informed consent form. The study was conducted in accordance with the tenets of the Helsinki Declaration of 1975 (revised 2013). All medical, patient-related data were de-identified, making it impossible to identify one or more individuals. The reporting of this study conforms to the STROBE guidelines [8].
Patients
All patients included in the study were screened and finally recruited from the Health Center of the Brandenburg University Hospital, one of three university hospitals affiliated to the Brandenburg Medical School in Germany. To be eligible for inclusion, patients had to be 18 years of age or older and meet the ACR/EULAR 2010 rheumatoid arthritis classification criteria [9]. In addition, their DMARD therapy had to include no DMARD (DMARD-native) or at least one conventional or biologic DMARD. The daily dose of prednisolone was variable and adjusted according to disease activity. Patient exclusion criteria included uncontrolled psychiatric disorders, additional autoimmune-mediated diseases, uncontrolled infectious diseases such as human immunodeficiency virus (HIV), hepatitis B or C, and tuberculosis, uncontrolled drug or alcohol dependence, and pregnancy. Patient characteristics collected included height, weight, comorbidities, medications, smoking status, and family history of CVD. Disease activity was assessed using the DAS28-CRP (28-joint Disease Activity Score-C-reactive protein) score, with remission, low, moderate and high disease activity defined by scores of < 2.6, 2.6 - 3.2, 3.2 - 5.1 and > 5.1, respectively. Additional disease activity assessment tools included the visual analogue scale (VAS) ranging from 0 (no pain) to 10 (maximum pain imaginable), swollen and painful joint assessment, and the Hannover Functional Questionnaire (HFQ) [10]. Therapy-related data collected included current DMARD therapy (agent), NSAID use (dose, and frequency of use), and daily prednisolone dose in milligram. CVR assessment included the following morbidities and laboratory parameters: arterial hypertension, diabetes mellitus including hemoglobin A1c (HbA1c, %), past and current smoking (at least 10 cigarettes per day), alcohol consumption (no alcohol, 1 - 3 times per month, 1 - 3 times per week, and daily), physical activity (‘no physical activity’ and ‘physical activity’, and: none, 2 - 3 times a week, daily), total cholesterol (mmol/L), low-density lipoprotein (LDL) (mmol/L), high-density lipoprotein (HDL) (mmol/L) and lipoprotein(a) (Lp(a)) (nmol/L). Other laboratory parameters measured included rheumatoid factor (RF) and anti-citrullinated protein antibody (ACPA) titer, CRP levels (mg/L), complete blood count, and serum creatinine (µmol/L).
Nuclear magnetic resonance (NMR) spectroscopy
After thawing for approximately 3 h at room temperature, 350 µL of serum was mixed with 350 µL of aqueous buffer. The buffer consisted of H2O pro analysi, 0.1 g/L NaN3, 0.067 mol/L Na2HPO4, 0.033 mol/L NaH2PO4 (pH: 7.15 ± 0.05), 5% D2O as field-locking substance and an internal standard (6 mM pyrazine) for quantification. From this mixture, 600 µL were transferred into a 5 mm Bruker NMR tube and sealed with a barcoded lid. The subsequent NMR measurement was performed with the following parameters: spectrometer Bruker AVANCE NEO 600 MHz, measurement method 1D 1H noesygppr1d_d20, NS = 16, T = 310 K, with a measurement time of 6.5 min per sample. All measured spectra passed the quality control routine and were released for data analysis.
Data analysis
The spectra were Fourier transformed using TopSpin software (version 4.0, Bruker Biospin, Germany). All spectra were automatically phased and baseline corrected. Subsequently, the spectra were analyzed using the proprietary Lifespin Profiler software (version 1.4_Blood) to generate a quantitative metabolite list. All metabolites were quantified in mmol/L.
Statistical analysis
Statistical significance in this analysis was determined by the Wilcoxon-Mann-Whitney test. The resulting P values were corrected for multiple testing (false discovery rate (FDR) correction) and converted to * notation as follows: P ≤ 0.001 (***), P ≤ 0.01 (**), P ≤ 0.05 (*), and P > 0.5 (not significant (n.s.)). For effect sizes, fold change and Cohen’s d were calculated. For two groups, fold change is calculated as the quotient of the means of both groups, where a fold change of 1 indicates that the means are equal, and a fold change of 0.5 indicates that the mean of group 2 is twice the mean of group 1. Cohen’s d was calculated by dividing the difference in the means of the respective groups by their pooled standard deviation and taking the absolute value, with effects being interpreted as small for a Cohen’s d ≤ 0.5, moderate for a Cohen’s d of 0.5 - 0.8, and large for a Cohen’s d ≥ 0.8.
For the multivariate analysis, we performed principal component analysis (PCA), a statistical technique used for dimensionality reduction, data compression, and exploratory data analysis. It transforms a large set of variables into a smaller set of uncorrelated variables, called principal components, which capture the most important information in the data. Principal components are linear combinations of the original variables that typically capture most of the variance in the data set. A scree plot visualizes the variance explained by each component to help determine the number to retain, while loadings indicate the contribution of each original variable to the components, and scores represent the coordinates of the data in reduced-dimensional space. We also used partial least squares discriminant analysis (PLS-DA), a supervised classification method that uses class information to identify variables maximizing the separation between classes. This method determines a set of components where each successive component captures the highest possible covariance between the data set X (measured data points) and their labels Y (group classifications). The quality of the PLS-DA model is evaluated using the cross-validation parameters R2 (variance explained) and Q2 (predictive ability). R2X and R2Y represent the variance explained by the X and Y matrices, respectively, while Q2Y indicates the predictive accuracy. An effective model is indicated by values of the cumulative parameters R2X, R2Y and Q2Y close to 1. For each model building (PCA, PLS-DA), the nearZeroVar function in R was used to remove predictors with zero variance, i.e., metabolites with very few unique values relative to the number of samples.
| Results | ▴Top |
Patients
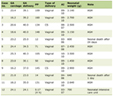
A total of 200 patients were included in the study, 54 subjects were not receiving any DMARDs (n = 47 patients with newly diagnosed, untreated RA at the time of inclusion, n = 7 with established disease but not receiving DMARD therapy), and 146 were receiving DMARD treatment. One hundred thirty-four (67%) subjects were female and 66 (33%) were male. The mean age of all subjects was 62.5 ± 12.4 years. RF was positive in 64.1% of cases, and anti-cyclic citrullinated peptide (anti-cyclic citrullinated peptide (CCP)) in 55.6%. The mean VAS at baseline was 4 ± 2.5 and the mean DAS28 was 3.7 ± 1.4. Table 1 summarizes all baseline characteristics. In addition to epidemiological data, these include information on drug therapy, CVR factors and laboratory findings.
 Click to view |
Table 1. Baseline Characteristics of all
Included Patients |
Variables of RA activity and treatment
First, variables of disease activity and RA therapy were considered. Seropositive RA patients did not differ from seronegative individuals. In addition, three ranges of RF elevation were defined: normal (< 14 IU/mL), slightly elevated (14 - 25 IU/mL), and significantly elevated (> 25 IU/mL). Metabolic profiling also showed no differences between these ranges. According to DAS28, three activity categories (low, medium and high disease activity) were defined: 0 - 3.2, 3.2 - 5.1, and > 5.1. There were no significant differences in metabolite concentrations between the three categories. Visual analog scale scores were also assigned to one of three categories: 0 - 3, 4 - 7, and 8 - 10. None of the analyzed metabolites differed between patients in the respective categories. Regarding DMARD therapy, five groups were distinguished: early RA without previous DMARD use (n = 47), MTX monotherapy (n = 67), MTX in combination with other DMARDs (n = 49), other DMARDs without MTX (n = 28), and established RA without DMARD use (n = 7). There were no differences in metabolic profile between the groups. Since glucocorticoids are used in the majority of RA individuals (in variable doses), patients were assigned to one of four dose groups: no glucocorticoid (n = 47), daily dose < 5 mg prednisolone equivalent (n = 53), daily dose 5 - 10 mg prednisolone equivalent (n = 94) and daily dose > 10 mg prednisolone equivalent (n = 3) (data missing: n = 1). Only one metabolite, HDL, differed between the groups, with the concentration being lowest in the “< 5 mg prednisolone equivalent” group. With regard to the use of NSAIDs in general and coxibs in particular, two analyses were always performed. First, NSAID/coxib native patients were compared with patients who regularly used at least one substance from either group. Second, the frequency of use was defined for both substance groups: none, once a day, 2 - 3 times a day, 2 - 3 times a week, and 2 - 3 times a month. Again, none of the analyses showed significant differences in the metabolome. A similar analysis was carried out for the variable “analgesics”. This term refers to all analgesics except NSAIDs/coxibs. Again, analgesic users were distinguished from analgesic non-users, and the same procedure was used for frequency of use as for NSAIDs/coxibs. Both subgroup analyses also showed no differences in the metabolic profile.
Variables of CVR
Cardiovascular analysis was based on both medical history and clinical findings. The variables considered separately were obesity, alcohol consumption, arterial hypertension, diabetes mellitus, family history, physical activity, stress and smoking. The Framingham score was also taken into account. Further variable analyses (NSAID, glucocorticoids) have already been summarized in the previous section.
Obesity was classified according to severity [11]: first degree (n = 46), second degree (n = 15), third degree (n = 9). The metabolic profile showed no significant differences between the three degrees of obesity. The next variable, alcohol consumption, was surveyed in principle on the one hand and quantified on the other. The following categories were defined for quantification: no alcohol (n = 100), 1 - 3 times per month (n = 13), 1 - 3 times per week (n = 50) and daily (n = 6). Alcohol consumption had no influence on the metabolome of the RA patients, neither in principle nor in degree. Of the 200 patients included, the question of whether or not arterial hypertension was present could be answered with certainty in 197 patients. The prevalence of arterial hypertension was found to be 65%. Hypertensive RA patients showed significantly higher serum levels of the following three substances: glucose 1.29-fold increase, mannose 1.33-fold increase, and urea 1.22-fold increase. Diabetes mellitus was diagnosed in 14% of patients. The metabolic profile differed significantly from non-diabetics. A total of six metabolites were significantly increased in diabetics (glucose 1.76-fold increase, mannose 1.63-fold increase, glycoprotein acetyls B and A 1.16- and 1.15-fold increase, creatinine 1.37-fold increase, and pyruvic acid 1.42-fold increase), one metabolite was reduced (LDL 0.86-fold increase). There were no differences in any of the metabolites between those with a positive family history of CVD and those without. The analysis of the variable “physical activity” was first performed as a comparison between “physical activity” and “no physical activity”. In a second step, the intensity of the activity was graded (none, daily, 2 - 3 times a week). No significant differences were found in either case. Surprisingly, the variable “stress” was definitely associated with different findings. A total of 73 individuals reported a permanently elevated stress level. Affected individuals showed significantly lower glucose levels (0.81-fold decrease) and higher serum histidine (1.11-fold increase) (Table 2). The levels of other amino acids were consistent across the two stress levels (isoleucine, leucine, lysine, methionine, phenylalanine, proline, serine, threonine, tyrosine, and valine). The variable “smoking” on the other hand (n = 62) was in no way associated with abnormal findings, neither in absolute terms (yes versus no), nor graduated (no, smoking cessation < 1 year, 1 - 5 years before, 5 - 10 years before, > 10 years before). The analysis of the Framingham data was categorized into one of three categories: < 10, 10 - 19, > 20. There were numerous significant differences between the < 10 and > 20 categories, with the majority of metabolites being reduced in the “< 10” category: triglycerides 0.69-fold decrease, sphingomyelins 0.68-fold decrease, creatinine 0.66-fold decrease, untargeted signals 21, 33, 34 and 35: 0.46-, 0.85-, 0.86- and 0.68-fold decrease, glucose 0.85-fold decrease and mannose 0.75-fold decrease (Table 3). Untargeted signals refer to distinct signals observed in the NMR spectra, originating from an unidentified substance. They are of potential value for statistical analysis, providing valuable insights despite their uncertain identity. Only HDL was increased in patients in the “< 10” category (1.18-fold increase). Surprisingly, the separate evaluation of the Framingham data did not reveal any differences when women and men were considered separately.
Click to view |
Table 2. Significantly Different Metabolites
Between Individuals With Elevated Versus Non-Elevated Stress Levels
(Distress) |
Click to view |
Table 3. Metabolic Differences Between RA
Patients With a Framingham Score of Under 10 Compared to Those With a Score of
20+ |
| Discussion | ▴Top |
The aim of the present study was to perform metabolomic profiling of RA patients at increased CVR. Ultimately, the study should help optimize CVR screening in RA, as current risk stratification systems [4] hardly take into account the influence of the activity of the underlying disease and of known pro-atherogenic drugs (NSAIDs, glucocorticoids) on the risk of heart attack and stroke. Initially, the study did not show any relevant abnormalities in the metabolic profile, taking into account disease activity and treatment variables. Nevertheless, the literature available to date suggests that metabolomics is indeed suitable for assessing disease activity in RA. A recent review article from 2022 [12] summarized metabolic studies in RA. It stated, for example, that fatty acid metabolites (free fatty acids, polyunsaturated fatty acids) in particular were regularly measured at elevated concentrations in different compartments (e.g., serum, synovial fluid). The combined concentration (added individual concentrations) of aspartic acid, threonine, tryptophan, histidine and phenylalanine was named as a very specific indicator of increased disease activity [13]. In 2022, Koh et al [14] published an analysis of synovial fluid and serum from RA patients with variable disease activity. The focus was on changes in lipid metabolism (lipidome). Synovial analysis revealed significant abnormalities in the lipid profile (e.g., lysophosphatidylcholine, phosphatidylcholine, ether-linked phosphatidylethanolamine), correlating with the severity of sonographic synovitis. The serum findings were roughly comparable, although less pronounced. The crucial difference from our study, aside from the materials analyzed, was the horizontal design, in which patients with RA in development were followed up. A study published in 2021 [15] involving 64 RA patients and 12 controls also followed a horizontal design. All patients were analyzed twice (plasma), the periods between the examinations were 6 to 12 months. Numerous metabolites (fatty acid metabolites, amino acid intermediates, carbohydrates) showed significant associations with DAS28-CRP. Our survey does not allow for comparable statements due to the single time point of the decrease. Irrespective of this, we did not identify any differences with different activity levels according to DAS28 at this time point. However, our study did not carry out correlation analyses but comparisons of metabolites between three activity severity levels.
However, there were some notable findings when variables or risk factors for increased cardiovascular morbidity were taken into account. These included arterial hypertension, diabetes mellitus, stress (or distress) and the Framingham score. Both arterial hypertension and diabetes mellitus were associated with significantly higher glucose and mannose concentrations. In addition, diabetics showed higher levels of pyruvic acid and glycoprotein acetyls. The latter were already described in 2022 as inflammatory biomarkers and “early” indicators of increased CVR in comparatively younger people [16]. Surprisingly, increased stress or distress was associated with reduced glucose levels, in contrast to hypertension and diabetes. Histidine, on the other hand, was found to be elevated. Elevated concentrations of histidine have already been reported in RA in several studies [17]. In the context of an increased CVR per se, i.e., independent of an inflammatory rheumatic disease, interesting findings regarding histidine have been published. Du Toit et al [18], for example, showed a negative correlation between urinary histidine and pulse wave velocity, an established marker of increased CVD burden. Streese et al [19] also identified an inverse association between histidine and CVR, but they examined blood samples. Finally, a study published in 2019 [20] had shown inverse correlations between central systolic blood pressure/central pulse pressure and various metabolites, including histidine. Reduced histidine availability with increased CVR thus appears to be a characteristic, if perhaps not specific, finding. Histidine could thus prove to be a potential indicator of increased CVR in RA patients with an accumulation of CVR factors (here: distress). It is important to acknowledge the inherent limitations of the variable “distress”, which is inherently susceptible to measurement error. The comparability of outcomes across subjects is hindered by the potential for individuals to overestimate their stress levels. This aspect of the study can be regarded as a constraint. In general, a prospective design over a longer period of time would certainly be needed to determine more precisely the significance of the amino acid in predicting CVR in RA, for example. This would answer the question of whether RA patients with manifest cardiovascular events have different histidine concentrations than those who do not develop such events. In any case, histidine appears to be a promising candidate for CVR assessment in RA.
In principle, consistent with the results of the hypertension and diabetes analyses, the lowest Framingham category (< 10) was associated with lower glucose and mannose concentrations, but at the same time with significantly higher HDL than in patients in the > 20 category. Several fatty acid metabolites that increased with increasing Framingham scores had already been identified in 2021 [21]. Our data could support these findings: patients in the lowest Framingham category showed lower levels of various lipid metabolites including sphingomyelins and triglycerides. The increased availability of distinct lipids in individuals with higher CVR according to the Framingham score is in principle compatible with the increasing development of a pro-oxidative environment in patients with higher cardiovascular morbidity. However, these findings are by no means typical of RA.
Conclusions
Our study potentially suggests a diagnostic role for histidine in CVD burden in RA. While reduced histidine concentrations in various compartments have been regularly identified in non-rheumatics with increased CVR, the situation is the opposite in RA. The extent to which histidine metabolism in this disease is modulated by the underlying inflammatory disease itself or, independently of this, can improve cardiovascular event prediction, can only be determined by follow-up studies.
Limitations
The main limitation is the lack of follow-up data. These could provide information on cardiovascular events (heart attack, stroke, etc.) and thus provide a more precise statement on the prognostic value of histidine and other metabolites, for example. The lack of a healthy control group could be seen as a limitation, but the aim was to detect metabolic abnormalities in RA patients with increased CVR compared to those without increased risk. Finally, the comparatively small number of patients is a potential limitation.
Acknowledgments
None to declare.
Financial Disclosure
The study was funded by the Brandenburg Medical School publication fund, which is supported by the Ministry of Science, Research, and Cultural Affairs of the State of Brandenburg.
Conflict of Interest
Steffen Heelemann and Selina Strathmeyer are employees at lifespin.
Informed Consent
All participants provided written informed consent.
Author Contributions
Inga Claus collected blood samples and clinical data from all included patients. Meike Hoffmeister substantially helped with sample collection and storage. Selina Strathmeyer and Steffen Heelemann performed all metabolomic analyses. Constantin Remus assisted in patient recruitment and data collection. Werner Dammermann helped in table preparation. Oliver Ritter aided in data analysis. Daniel Patschan analyzed data, and assisted in writing. Susann Patschan designed the study, analyzed data, and wrote the article. All authors approved the final version of the article.
Data Availability
The data supporting the findings of this study are available from the corresponding author upon reasonable request.
Abbreviations
ACPA: anti-citrullinated protein antibody; ACR: American College of Rheumatology; CRP: C-reactive protein; CVD: cardiovascular disease; CVR: cardiovascular risk; DMARDs: disease-modifying anti-rheumatic drugs; bDMARDs: biologic disease-modifying anti-rheumatic drugs; cDMARDs: conventional disease-modifying anti-rheumatic drugs; ESC: European Society of Cardiology; EULAR: European League Against Rheumatism; HDL: high-density lipoprotein; HFQ: Hannover Functional Questionnaire; LDL: low-density lipoprotein; Lp(a): lipoprotein (a); NMR: nuclear magnetic resonance; MTX: methotrexate; NSAIDs: non-steroidal anti-inflammatory drugs; PLS-DA: partial least squares discriminant analysis; RA: rheumatoid arthritis; RF: rheumatoid factor; VAS: visual analogue scale
| References | ▴Top |
- Finckh A, Gilbert B, Hodkinson B, Bae SC, Thomas R, Deane
KD, Alpizar-Rodriguez D, et al. Global epidemiology of rheumatoid arthritis. Nat Rev Rheumatol.
2022;18(10):591-602.
doi pubmed - Albrecht K, Zink A. Poor prognostic factors guiding
treatment decisions in rheumatoid arthritis patients: a review of data from randomized clinical
trials and cohort studies. Arthritis Res Ther. 2017;19(1):68.
doi pubmed - Agca R, Heslinga SC, Rollefstad S, Heslinga M, McInnes IB,
Peters MJ, Kvien TK, et al. EULAR recommendations for cardiovascular disease risk management in
patients with rheumatoid arthritis and other forms of inflammatory joint disorders: 2015/2016
update. Ann Rheum Dis. 2017;76(1):17-28.
doi pubmed - Williams B, Mancia G, Spiering W, Agabiti Rosei E, Azizi M,
Burnier M, Clement DL, et al. 2018 ESC/ESH Guidelines for the management of arterial
hypertension. Eur Heart J. 2018;39(33):3021-3104.
doi pubmed - Atzeni F, Rodriguez-Carrio J, Popa CD, Nurmohamed MT, Szucs
G, Szekanecz Z. Cardiovascular effects of approved drugs for rheumatoid arthritis. Nat Rev
Rheumatol. 2021;17(5):270-290.
doi pubmed - Mangoni AA, Zinellu A, Sotgia S, Carru C, Piga M, Erre GL.
Protective effects of methotrexate against proatherosclerotic cytokines: a review of the
evidence. Mediators Inflamm. 2017;2017:9632846.
doi pubmed - Dettmer K, Aronov PA, Hammock BD. Mass spectrometry-based
metabolomics. Mass Spectrom Rev. 2007;26(1):51-78.
doi pubmed - von Elm E, Altman DG, Egger M, Pocock SJ, Gotzsche PC,
Vandenbroucke JP, Initiative S. The strengthening the reporting of observational studies in
epidemiology (STROBE) statement: guidelines for reporting observational studies. PLoS Med.
2007;4(10):e296.
doi pubmed - Kay J, Upchurch KS. ACR/EULAR 2010 rheumatoid arthritis
classification criteria. Rheumatology (Oxford). 2012;51(Suppl 6):vi5-9.
doi pubmed - Lautenschlager J, Mau W, Kohlmann T, Raspe HH, Struve F,
Bruckle W, Zeidler H. [Comparative evaluation of a German version of the Health Assessment
Questionnaire and the Hannover Functional Capacity Questionnaire]. Z Rheumatol.
1997;56(3):144-155.
doi pubmed - Weir CB, Jan A. BMI classification percentile and cut off
points. In: StatPearls. Treasure Island (FL). 2025.
pubmed - Bartikoski BJ, De Oliveira MS, Do Espirito Santo RC, Dos
Santos LP, Dos Santos NG, Xavier RM. A review of metabolomic profiling in rheumatoid arthritis:
bringing new insights in disease pathogenesis, treatment and comorbidities. Metabolites.
2022;12(5):394.
doi pubmed - Smolenska Z, Smolenski RT, Zdrojewski Z. Plasma
concentrations of amino acid and nicotinamide metabolites in rheumatoid
arthritis—potential biomarkers of disease activity and drug treatment. Biomarkers.
2016;21(3):218-224.
doi pubmed - Koh JH, Yoon SJ, Kim M, Cho S, Lim J, Park Y, Kim HS, et al.
Lipidome profile predictive of disease evolution and activity in rheumatoid arthritis. Exp Mol
Med. 2022;54(2):143-155.
doi pubmed - Hur B, Gupta VK, Huang H, Wright KA, Warrington KJ, Taneja
V, Davis JM, 3rd, et al. Plasma metabolomic profiling in patients with rheumatoid arthritis
identifies biochemical features predictive of quantitative disease activity. Arthritis Res Ther.
2021;23(1):164.
doi pubmed - Chiesa ST, Charakida M, Georgiopoulos G, Roberts JD,
Stafford SJ, Park C, Mykkanen J, et al. Glycoprotein acetyls: a novel inflammatory biomarker of
early cardiovascular risk in the young. J Am Heart Assoc. 2022;11(4):e024380.
doi pubmed - Li C, Chen B, Fang Z, Leng YF, Wang DW, Chen FQ, Xu X, et
al. Metabolomics in the development and progression of rheumatoid arthritis: A systematic
review. Joint Bone Spine. 2020;87(5):425-430.
doi pubmed - du Toit WL, Kruger R, Gafane-Matemane LF, Schutte AE, Louw
R, Mels CMC. Markers of arterial stiffness and urinary metabolomics in young adults with early
cardiovascular risk: the African-PREDICT study. Metabolomics. 2023;19(4):28.
doi pubmed - Streese L, Springer AM, Deiseroth A, Carrard J, Infanger D,
Schmaderer C, Schmidt-Trucksass A, et al. Metabolic profiling links cardiovascular risk and
vascular end organ damage. Atherosclerosis. 2021;331:45-53.
doi pubmed - Mels CM, Delles C, Louw R, Schutte AE. Central systolic
pressure and a nonessential amino acid metabolomics profile: the African Prospective study on
the Early Detection and Identification of Cardiovascular disease and Hypertension.
J Hypertens. 2019;37(6):1157-1166.
doi pubmed - Warmbrunn MV, Koopen AM, de Clercq NC, de Groot PF, Kootte
RS, Bouter KEC, Ter Horst KW, et al. Metabolite profile of treatment-naive metabolic syndrome
subjects in relation to cardiovascular disease risk. Metabolites. 2021;11(4):236.
doi pubmed
This
article is distributed under the terms of the Creative Commons Attribution Non-Commercial 4.0
International License, which permits unrestricted non-commercial use, distribution, and
reproduction in any medium, provided the original work is properly cited.
Journal
of Clinical Medicine Research is published by Elmer Press Inc.