| Journal of Clinical Medicine Research, ISSN 1918-3003 print, 1918-3011 online, Open Access |
| Article copyright, the authors; Journal compilation copyright, J Clin Med Res and Elmer Press Inc |
| Journal website https://jocmr.elmerjournals.com |
Original Article
Volume 18, Number 4, April 2026, pages 251-260

A Strong Correlation Between Pleural Fluid and Serum C-Reactive Protein Levels Across a Spectrum of Pleural Effusions
Majed Odeha, b, e, f, Yana Kogana, b, c, e, Edmond Sabob, d
aDepartment of Internal Medicine A, Bnai Zion Medical Center, Haifa, Israel
bFaculty of Medicine, Technion–Israel Institute of Technology, Haifa, Israel
cPulmonary Division, Carmel Medical Center, Haifa, Israel
dInstitute of Pathology, Carmel Medical Center, Haifa, Israel
eThese authors contributed equally to the work.
fCorresponding Author: Majed Odeh, Department of Internal Medicine A, Bnai Zion Medical Center, Haifa, Israel
Manuscript submitted January 26, 2026, accepted March 28, 2026, published online April 15, 2026
Short title: Correlation Between Pleural Fluid and Serum CRP
doi: https://doi.org/10.14740/jocmr6513
| Abstract | ▴Top |
Background: C-reactive protein (CRP) is a key acute-phase reactant, primarily synthesized by hepatocytes and released into the bloodstream. Both serum CRP (CRPs) and pleural fluid CRP (CRPpf) have been shown to aid in distinguishing between different types of pleural effusion (PE). As CRPpf is largely derived from CRPs, a strong correlation between their levels is expected. However, limited data exist regarding this relationship, and no previous studies have compared the strength of this correlation across different PE etiologies. This retrospective study aimed to evaluate the correlation between CRPpf and CRPs levels in various PE types and, for the first time, to compare the strength of this association between groups.
Methods: A total of 492 patients with PE were included: 210 with transudative PE (TrPE), 86 with uncomplicated parapneumonic effusion (UCPPE), 60 with complicated parapneumonic effusion (CPPE), 126 with malignant PE (MPE), and 10 with tuberculous PE (TPE). Data are presented as mean ± standard deviation.
Results: Mean CRPs and CRPpf levels, respectively, were as follows: TrPE (11.3 ± 5.7 mg/L; 4.6 ± 2.8 mg/L), UCPPE (145.3 ± 67.6 mg/L; 58.5 ± 38.5 mg/L), CPPE (302.2 ± 75.6 mg/L; 112 ± 65 mg/L), MPE (56.1 ± 39.5 mg/L; 18.9 ± 13.9 mg/L), and TPE (98.7 ± 12.9 mg/L; 45.0 ± 9.4 mg/L). A statistically significant positive correlation between CRPpf and CRPs was observed in all groups: TrPE (r = 0.81, P < 0.0001), UCPPE (r = 0.90, P < 0.0001), CPPE (r = 0.57, P < 0.0001), MPE (r = 0.81, P < 0.0001), and TPE (r = 0.91, P < 0.0001). The correlation was significantly stronger in the UCPPE and TPE groups compared to the others, while the CPPE group showed the weakest correlation. Correlation strength in the TrPE and MPE groups was intermediate, but significantly greater than that in CPPE.
Conclusions: A strong and statistically significant correlation between CRPpf and CRPs levels exists across all major types of PE. The varying strength of this correlation among groups—highest in UCPPE and TPE, and lowest in CPPE—may reflect the influence of local pleural factors, such as inflammation, cellular injury, local CRP synthesis, and lymphatic drainage impairment, on pleural CRP levels.
Keywords: C-reactive protein; Pleural effusion; Transudative effusion; Parapneumonic effusion; Malignant effusion; Tuberculous effusion; Correlation
| Introduction | ▴Top |
C-reactive protein (CRP), a member of the pentraxin family, is recognized as one of the most clinically significant acute-phase reactants. It is primarily synthesized by hepatocytes in the liver. In response to inflammatory stimuli—most commonly infections, autoimmune disorders, malignancies, and tissue injury such as burns, trauma, or fractures—CRP production and release into the circulation increase markedly within hours [1, 2]. Serum CRP (CRPs) levels can peak within approximately 48 h and may rise dramatically, sometimes exceeding a 1,000-fold increase, depending on the intensity of the inflammatory or tissue-damaging process. This acute-phase response is predominantly mediated by pro-inflammatory cytokines, especially interleukin-6 (IL-6), as well as tumor necrosis factor-α (TNF-α), interleukin-1β (IL-1β), and interleukin-17 (IL-17) [1, 2].
The diagnostic value of CRPs and pleural fluid CRP (CRPpf) in differentiating among the various causes of pleural effusion (PE) remains an active area of investigation [3–15]. Several studies have demonstrated that both CRPs and CRPpf can aid in distinguishing transudative PE (TrPE) from exudative PE (ExPE), as well as in differentiating between specific subtypes of ExPE [3–60]. Given that circulating blood is the primary source of CRP in pleural fluid [1, 2, 14, 18, 21, 44], a strong correlation between CRPpf and CRPs would be expected. However, available data on the strength and consistency of this correlation are limited [21, 26, 38], and to date, no study has systematically compared this relationship across different etiologies of PE.
This retrospective study aimed to evaluate the correlation between CRPpf and CRPs levels in patients with PE of varying etiologies. To the best of our knowledge, this is the first study to compare the strength of this correlation across different diagnostic groups.
| Materials and Methods | ▴Top |
The study population comprised 492 patients diagnosed with PE. Among them, 210 patients (aged 33–96 years) had TrPE, primarily due to congestive heart failure (CHF) (n = 200), with fewer cases attributed to liver cirrhosis (n = 8) and nephrotic syndrome (n = 2). Additionally, 86 patients (aged 24–91 years) presented with uncomplicated parapneumonic effusion (UCPPE), 60 (aged 30–91 years) with complicated PPE (CPPE), 126 (aged 29–95 years) with malignant pleural effusion (MPE), and 10 (aged 23–86 years) with tuberculous pleural effusion (TPE). Patients with comorbidities or medications that may significantly influence levels CRPs or CRPpf, and the results of our study, were not included in the study.
TrPE was attributed to CHF when all of the following criteria were met: 1) cardiomegaly; 2) clinical, echocardiographic evidence of cardiac dysfunction; 3) radiographic signs of pulmonary congestion and/or peripheral edema; 4) resolution of the effusion with appropriate CHF treatment; and 5) absence of alternative etiologies. TrPE was considered secondary to liver cirrhosis or nephrotic syndrome only when a definitive diagnosis of the underlying condition was established and no other cause of PE was identified. UCPPE was diagnosed in patients presenting with an acute febrile illness, purulent sputum, radiographic evidence of pulmonary infiltrates, and a favorable response to antibiotic therapy, without evidence of bacterial invasion into the pleural space or other identifiable causes of PE. CPPE was diagnosed in the presence of clinically and radiographically confirmed pneumonia, with at least one of the following indicators of pleural space infection: positive Gram stain or culture of pleural fluid, presence of loculations, pleural thickening, pleural fluid pH < 7.2, empyema, or an effusion occupying ≥ 50% of the hemithorax. MPE was defined by the presence of malignant cells on cytological examination of pleural fluid or histological analysis of pleural biopsy specimens, in the absence of other potential causes of PE. TPE was diagnosed based on either a positive culture for Mycobacterium tuberculosis (from pleural fluid, sputum, or biopsy specimens), a positive Ziehl-Neelsen stain for acid-fast bacilli, or histological evidence of caseating granulomas on pleural biopsy, with no other explanatory cause for the effusion and the caseating granulomas.
Relevant data were extracted from patients’ medical records. Only those with a definitive diagnosis of PE (classified as TrPE, UCPPE, CPPE, MPE, or TPE) and available measurements of CRPs and CRPpf levels were included.
CRPs and CRPpf concentrations were determined using a Cobas c 501 analyzer (Roche Diagnostics), following the manufacturer’s guidelines. The study protocol was approved by the Institutional Ethics Committee of Bnai Zion Medical Center (Protocol No.: 0107-16-BNZ) and conducted in accordance with the Declaration of Helsinki.
Statistical analyses were conducted using IBM SPSS Statistics, version 23 (Armonk, NY, USA). Continuous data are reported as mean ± standard deviation (SD), accompanied by 95% confidence intervals (CIs). The distribution of variables was evaluated using the Kolmogorov–Smirnov test to assess normality. Correlations between CRPpf and CRPs levels within each group were evaluated using Pearson’s correlation coefficient. To compare the strength of these correlations across groups, the Fisher r-to-z transformation was applied. A P value of ≤ 0.05 was considered indicative of statistical significance.
| Results | ▴Top |
The TrPE group comprised 210 patients with a mean age of 77.3 ± 10.4 years. The UCPPE group included 86 patients (65.9 ± 18.1 years), the CPPE group 60 patients (74.1 ± 13.6 years), the MPE group 126 patients (75.9 ± 10.2 years), and the TPE group 10 patients (66.1 ± 19.2 years) (Table 1). Across all groups, CRPs levels consistently exceeded CRPpf levels. The TrPE group was significantly older than both the UCPPE and TPE groups (P < 0.0001), but showed no significant age difference compared to the CPPE and MPE groups (P > 0.05). Patients in the MPE group were significantly older than those in the UCPPE and TPE groups (P < 0.001), as were patients in the CPPE group (P < 0.003) (Table 1).
 Click to view | Table 1. Age and CRP Levels (CRPs and CRPpf) Across TrPE, UCPPE, CPPE, MPE, and TPE Groups |
The mean concentrations of CRPs and CRPpf were 11.3 ± 5.7 mg/L and 4.6 ± 2.8 mg/L, respectively, in the TrPE group; 145.3 ± 67.6 mg/L and 58.5 ± 38.5 mg/L in the UCPPE group; 302.2 ± 75.6 mg/L and 112 ± 65 mg/L in the CPPE group; 56.1 ± 39.5 mg/L and 18.9 ± 13.9 mg/L in the MPE group; and 98.7 ± 12.9 mg/L and 45.0 ± 9.4 mg/L in the TPE group (Table 1). In each group, CRPpf levels were significantly and positively correlated with corresponding CRPs values: TrPE (r = 0.81, P < 0.0001) (Fig. 1), UCPPE (r = 0.90, P < 0.0001) (Fig. 2), CPPE (r = 0.57, P < 0.0001) (Fig. 3), MPE (r = 0.81, P < 0.0001) (Fig. 4), and TPE (r = 0.91, P < 0.0001) (Fig. 5).
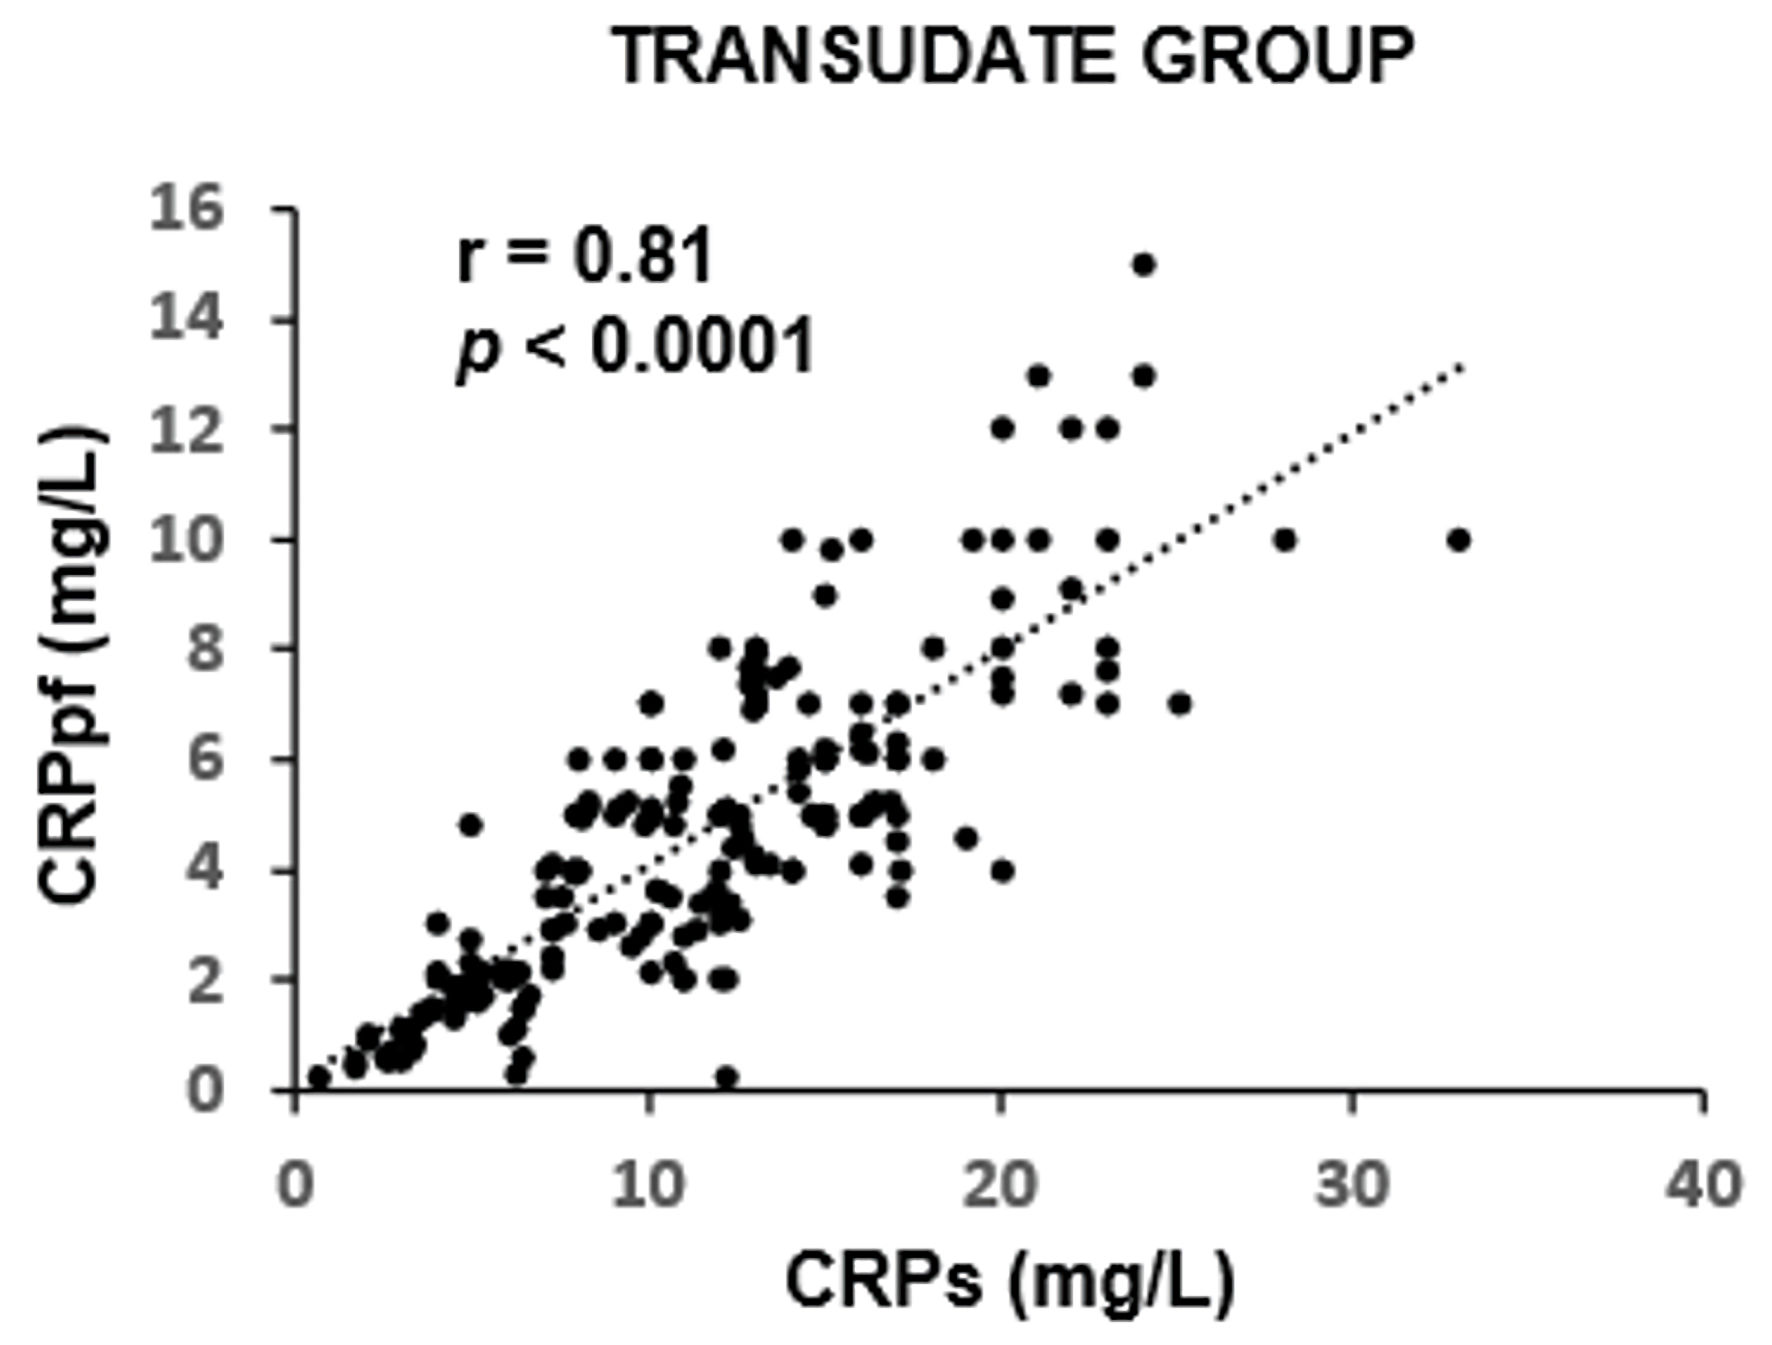 Click for large image | Figure 1. Correlation between CRPpf and CRPs in the TrPE group. CRPs: serum C-reactive protein; CRPpf: pleural fluid C-reactive protein; r: correlation coefficient; TrPE: transudative pleural effusion. |
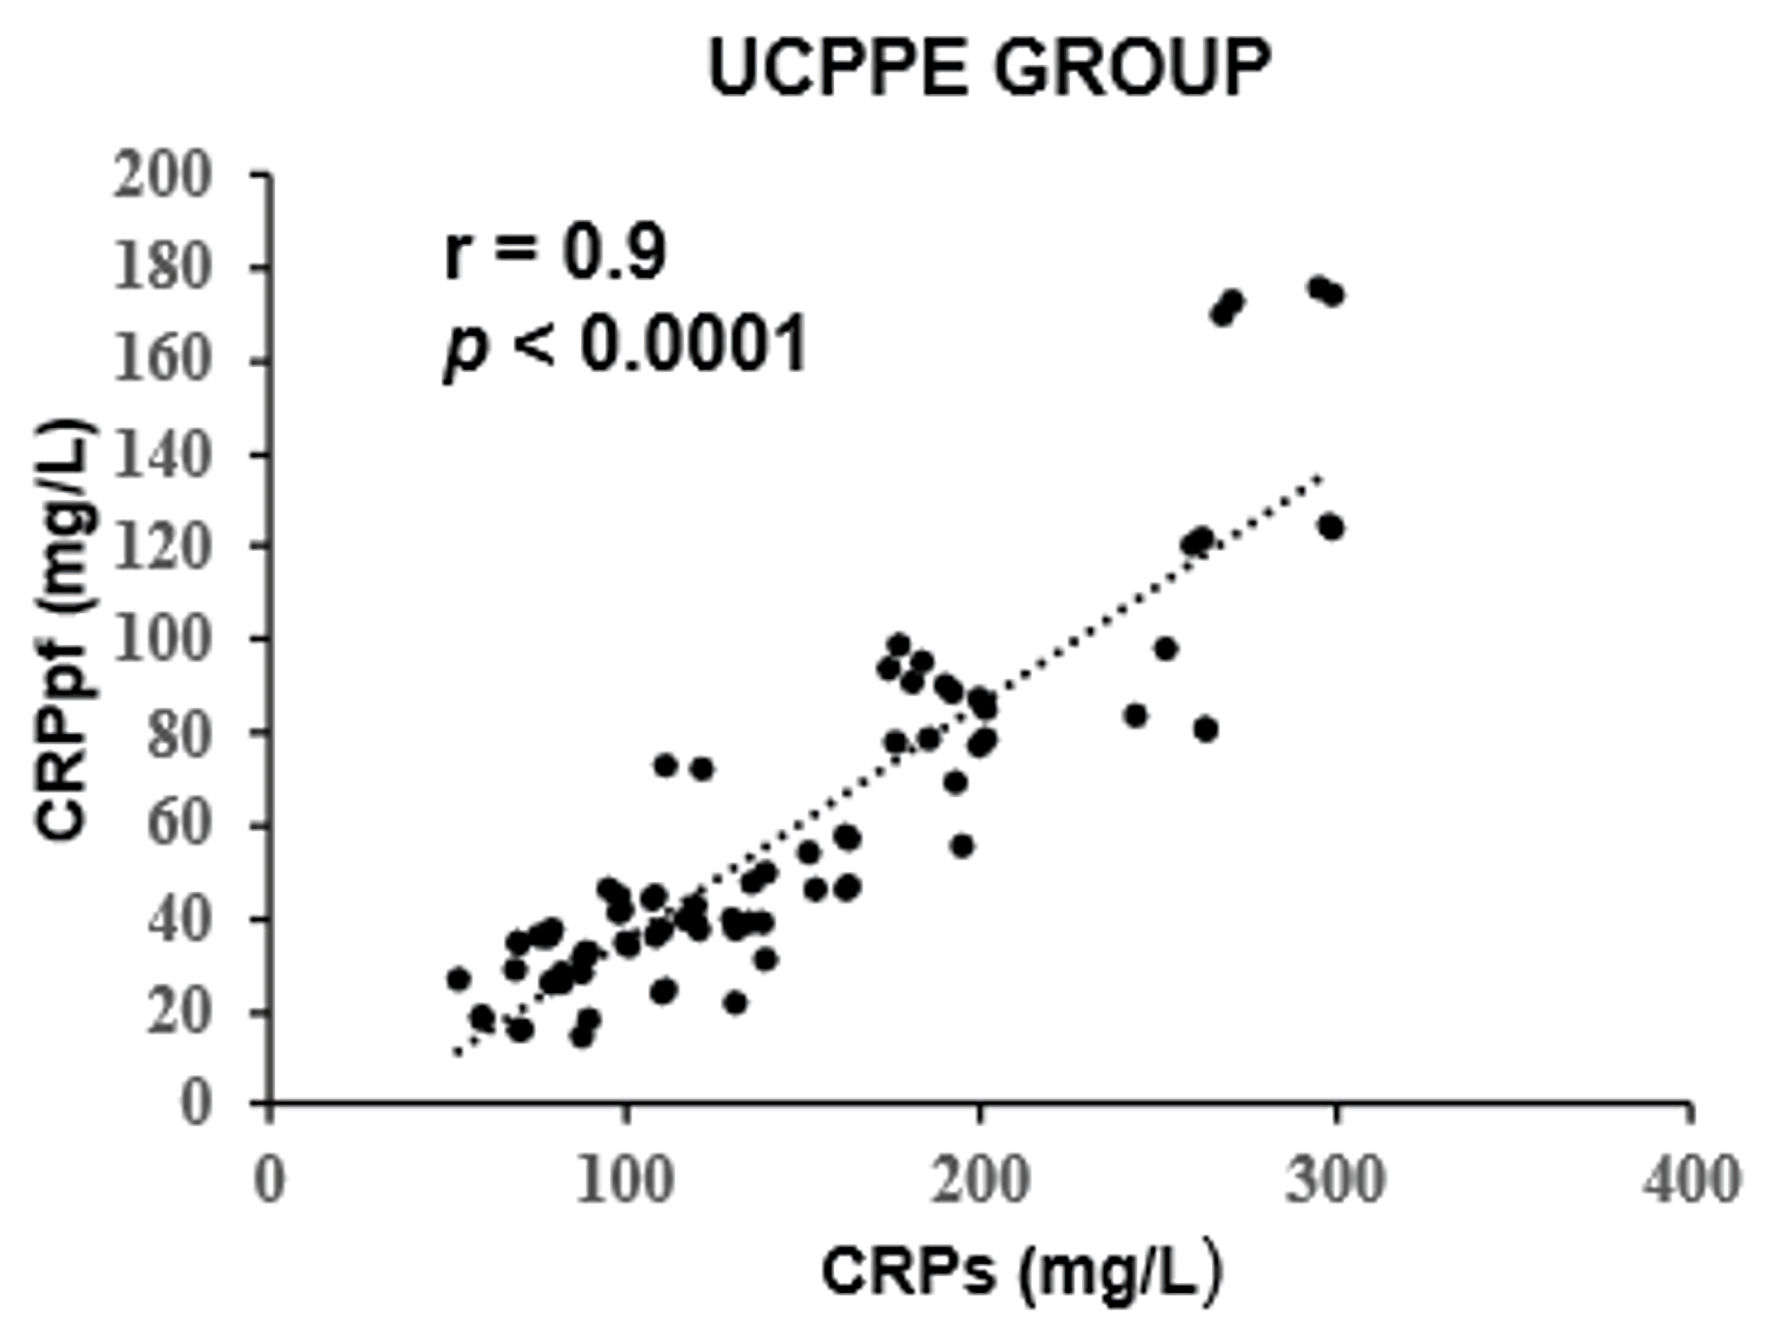 Click for large image | Figure 2. Correlation between CRPpf and CRPs in the UCPPE group. UCPPE: uncomplicated parapneumonic effusion; CRPs: serum C-reactive protein; CRPpf: pleural fluid C-reactive protein; r: correlation coefficient. |
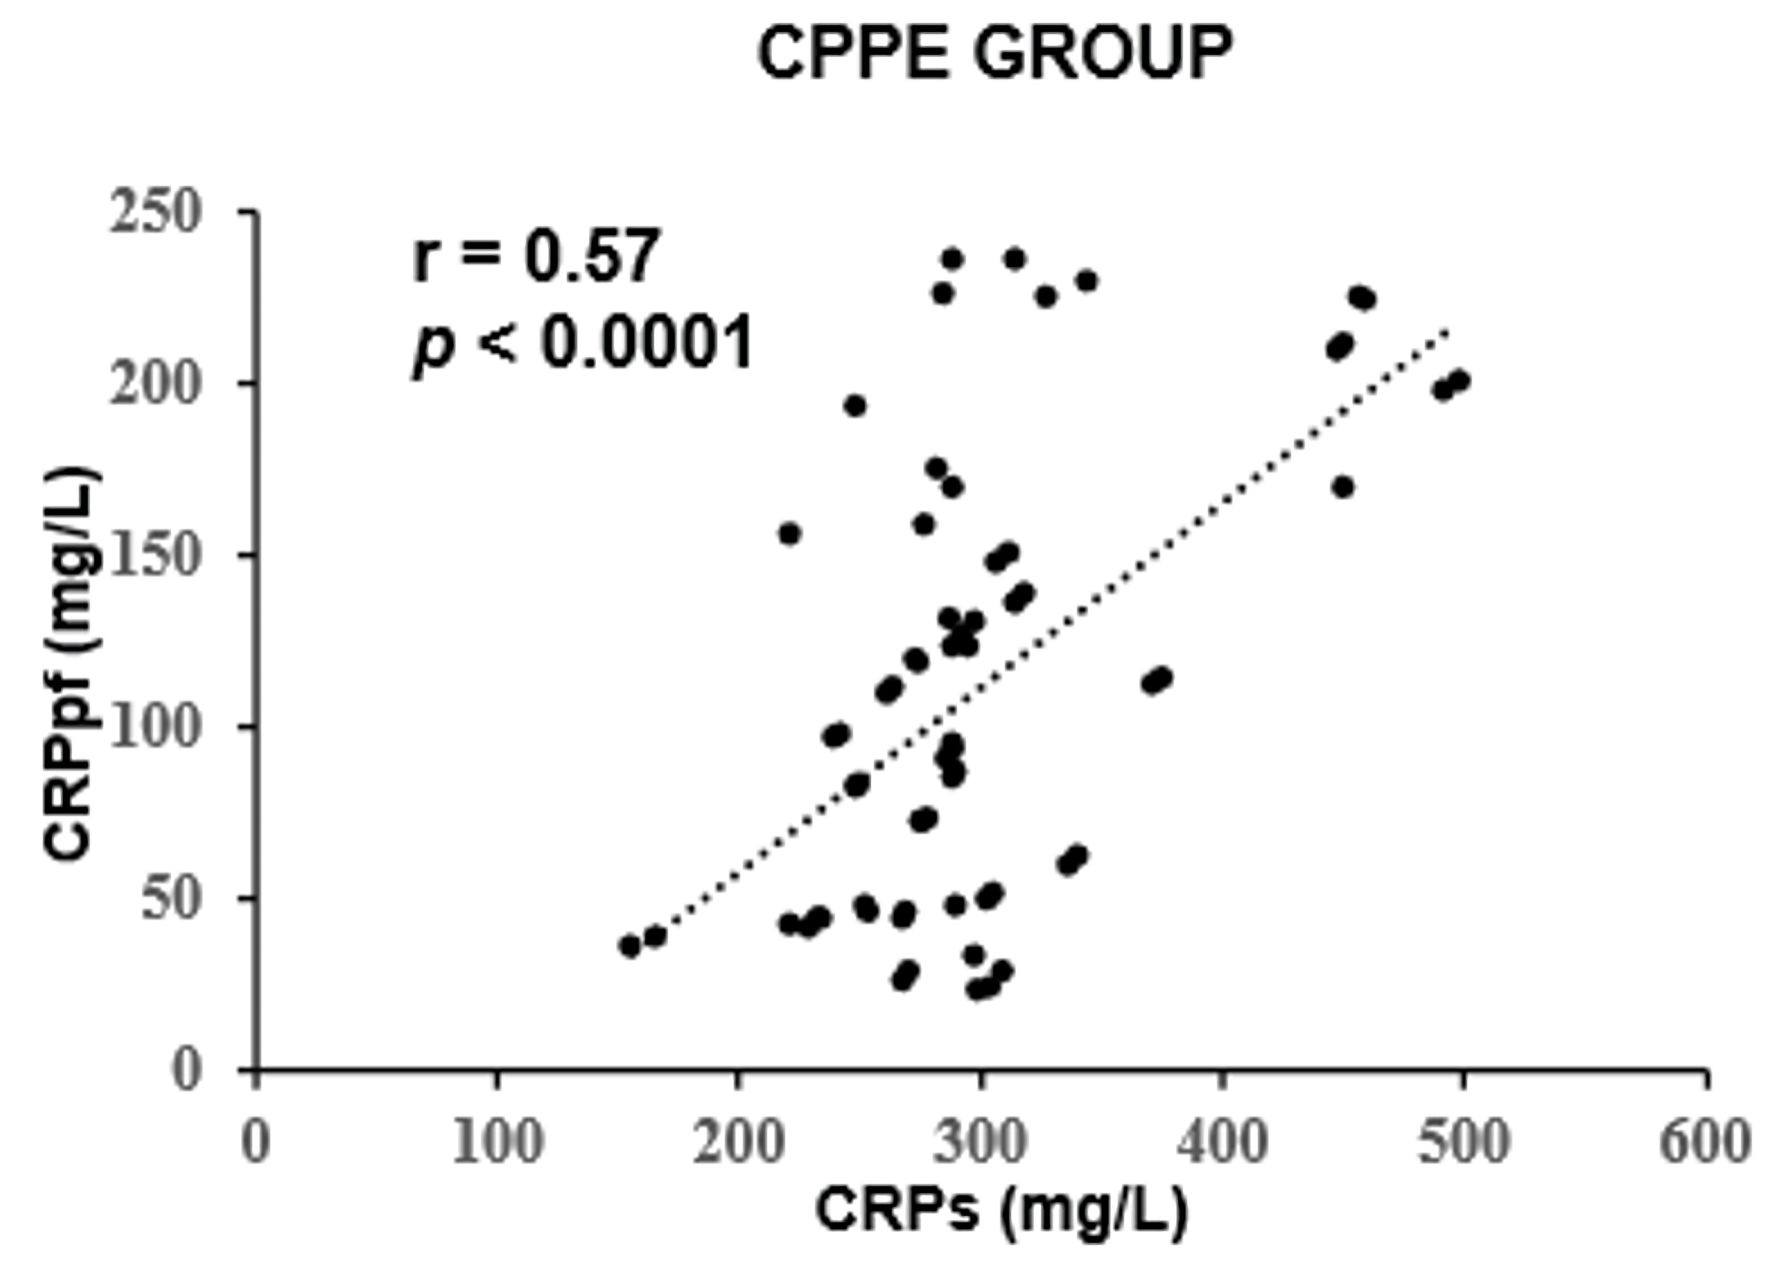 Click for large image | Figure 3. Correlation between CRPpf and CRPs in the CPPE group. CPPE: complicated parapneumonic effusion; CRPs: serum C-reactive protein; CRPpf: pleural fluid C-reactive protein; r: correlation coefficient. |
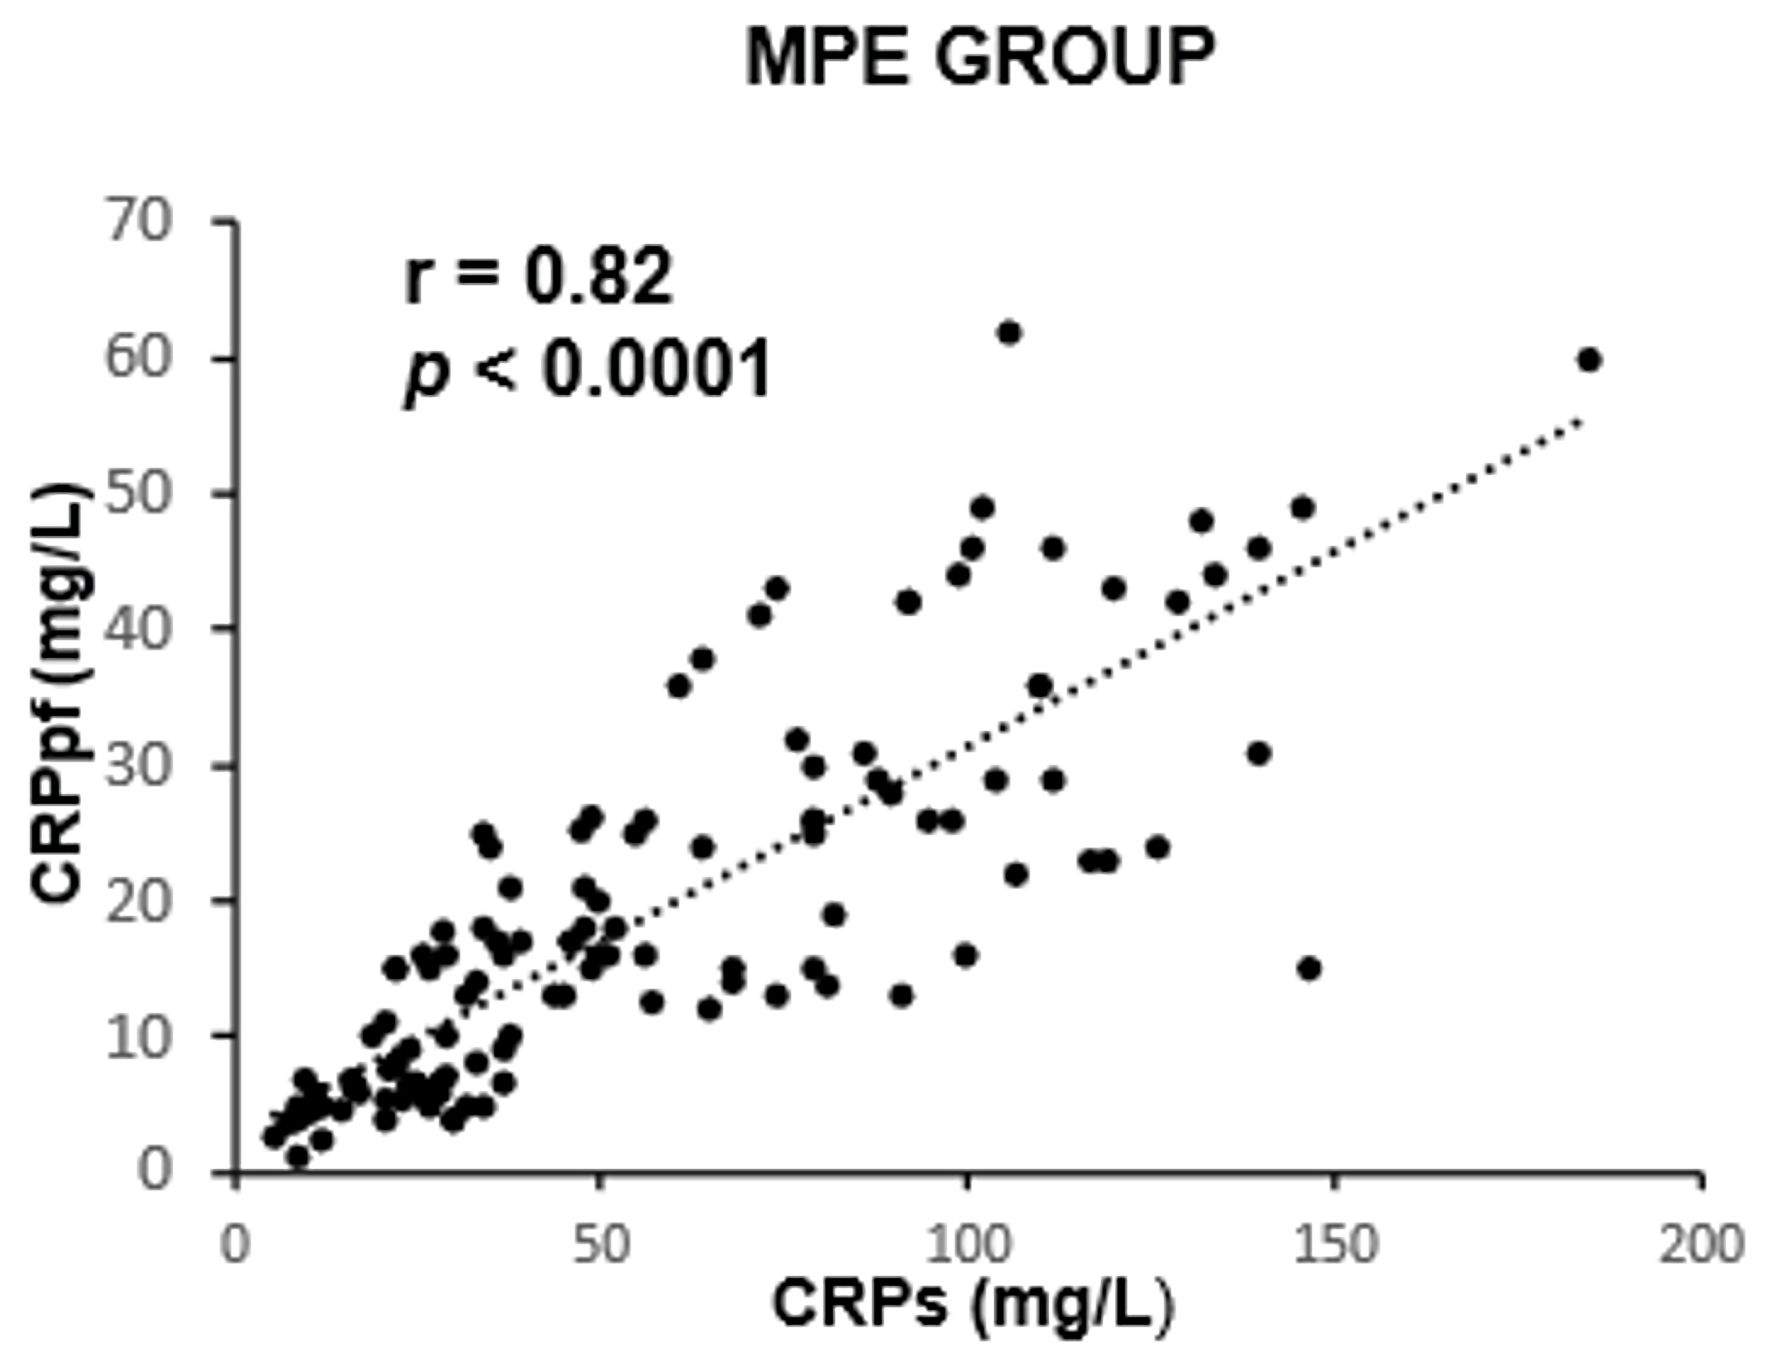 Click for large image | Figure 4. Correlation between CRPpf and CRPs in the MPE group. MPE: malignant pleural effusion; CRPs: serum C-reactive protein; CRPpf: pleural fluid C-reactive protein; r: correlation coefficient. |
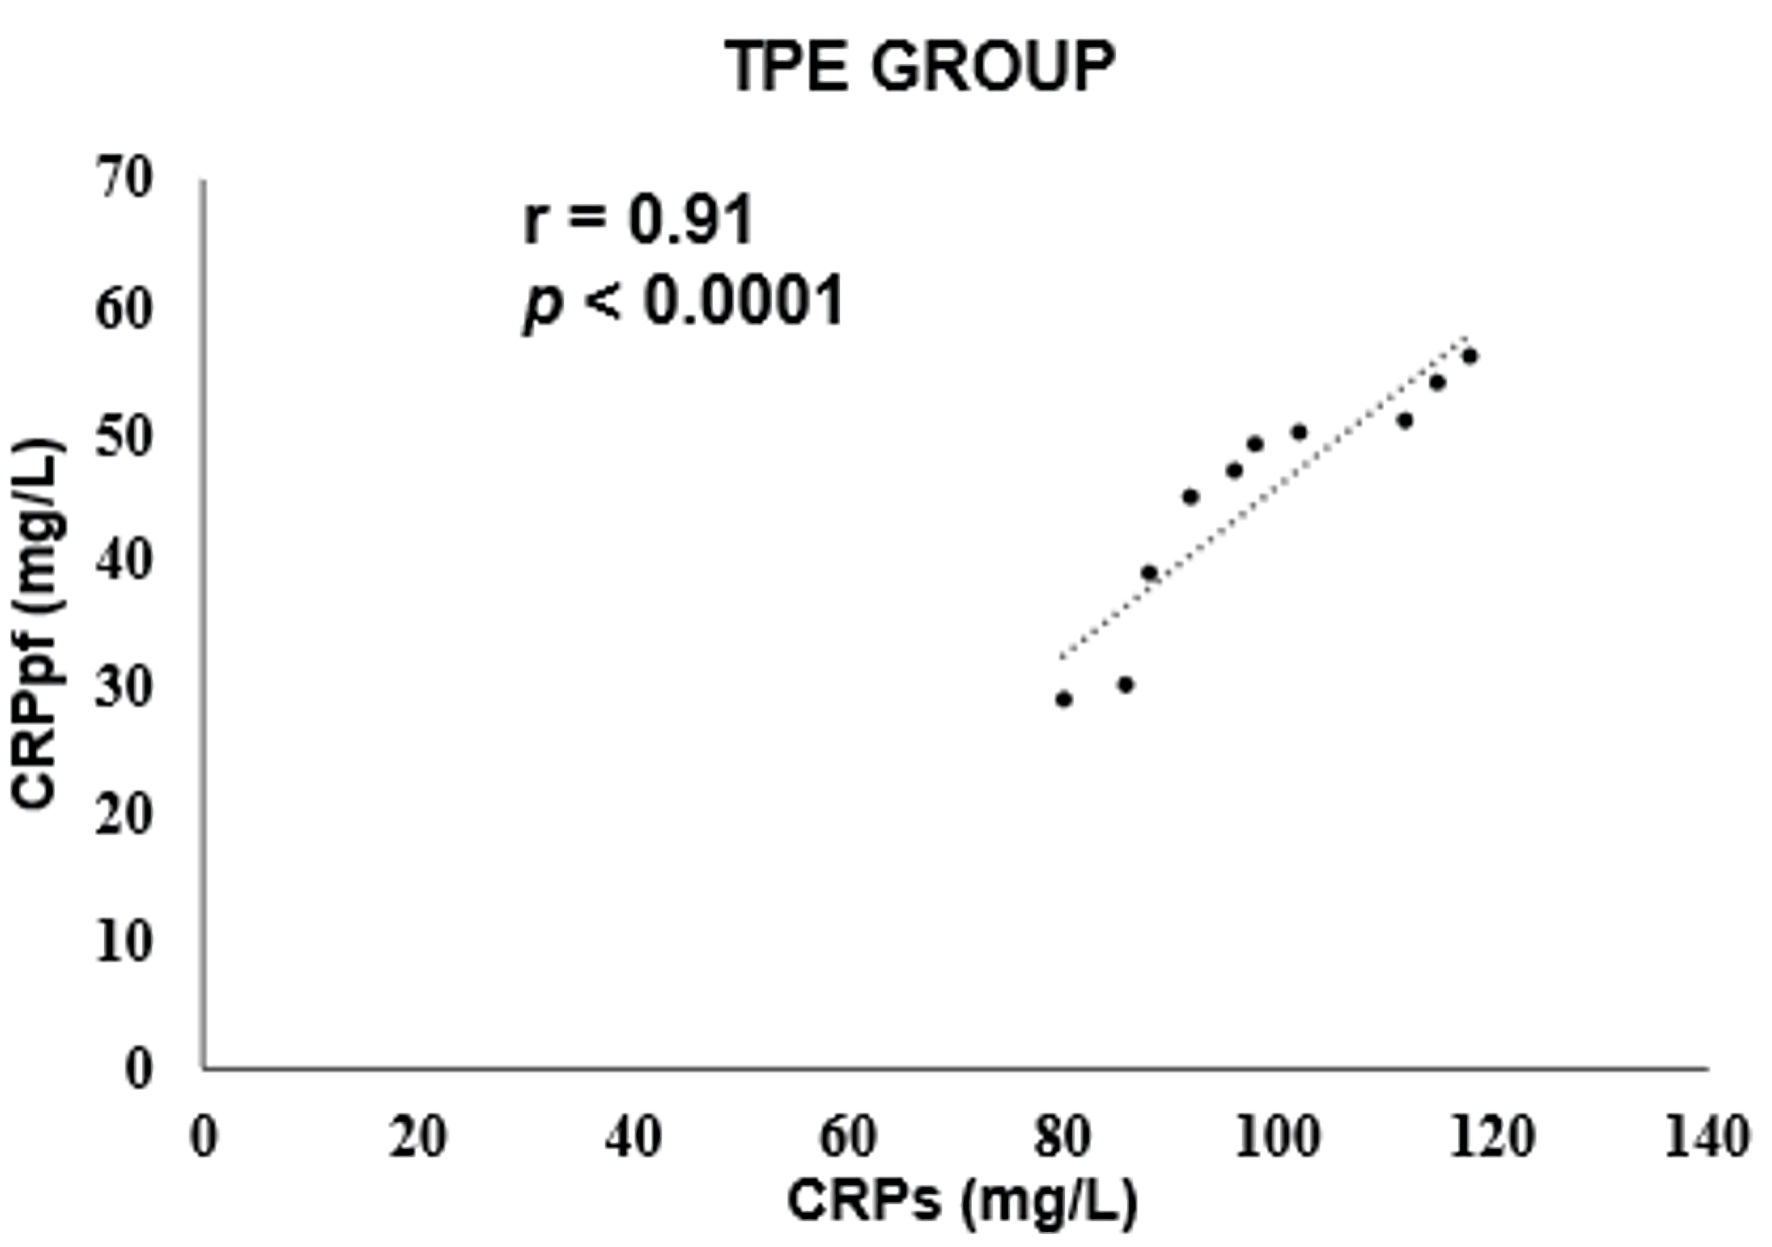 Click for large image | Figure 5. Correlation between CRPpf and CRPs in the TPE group. TPE: tuberculous pleural effusion; CRPs: serum C-reactive protein; CRPpf: pleural fluid C-reactive protein; r: correlation coefficient. |
Intergroup comparisons revealed that the correlation coefficient in the TrPE group was significantly higher than in the CPPE group (P < 0.001), but not significantly different from the MPE group (P = 0.79). The UCPPE group demonstrated a significantly stronger correlation than the TrPE (P < 0.01), CPPE (P < 0.0001), and MPE groups (P = 0.029), with no significant difference compared to the TPE group (P = 0.78). Additionally, the MPE group showed a significantly higher correlation coefficient than the CPPE group (P < 0.001). The TPE group exhibited significantly stronger correlations than the TrPE (P < 0.01), CPPE (P < 0.0001), and MPE groups (P < 0.01) (Table 2).
Click to view | Table 2. Correlation Between Levels of CRPpf and CRPs for Various Groups of PE With Its Correlation Coefficient (r) and Its Statistical Significance (P) |
| Discussion | ▴Top |
The findings of the present study revealed a significant positive correlation between CRPpf and CRPs across all five diagnostic groups (Table 1, Figs. 1–5). The strongest correlations were observed in the TPE and UCPPE groups (r = 0.91, P < 0.0001 and r = 0.90, P < 0.0001, respectively), followed by the MPE and TrPE groups (r = 0.82, P < 0.0001 and r = 0.81, P < 0.0001, respectively). The weakest correlation was found in the CPPE group (r = 0.57, P < 0.0001).
To date, only three studies have specifically examined the correlation between CRPpf and CRPs [21, 26, 38]. One study analyzed a combined cohort of 72 patients with TrPE and ExPE, reporting a significant correlation (r = 0.69, P < 0.0001) [21]. Another study assessed the relationship separately in patients with TrPE (n = 12) and ExPE (n = 36), finding a statistically significant correlation only in the ExPE group (r = 0.49, P = 0.002), while the TrPE group showed a weaker, non-significant association (r = 0.3, P = 0.35) [38]. A third investigation reported correlation coefficients of r = 0.64 in TrPE (n = 67), r = 0.54 in PPE (including both UCPPE and CPPE; n = 48), r = 0.80 in MPE (n = 72), and r = 0.74 in TPE (n = 67). However, P values were not provided for these correlations [26]. In comparison to these previous reports, our results diverge, except for the findings related to the MPE group. Given the larger size of our study population—approximately double that of the aforementioned studies—our results may offer a more robust and reliable estimation of the correlation between CRPpf and CRPs across different types of PE.
To our knowledge, this study is the first to compare the strength of correlation coefficients between CRPpf and CRPs levels across different types of PE. The analysis demonstrated that the UCPPE and TPE groups exhibited similarly strong correlations, which were significantly higher than those observed in the other groups (Table 2). Likewise, the correlation strengths in the TrPE and MPE groups were comparable to each other and significantly greater than that observed in the CPPE group (Table 2). As this comparative analysis has not been previously reported, there are no available data in the current medical literature to account for the observed differences in correlation strength among the various PE groups. Nevertheless, several potential explanations may be proposed to account for these findings.
Given that CRPpf primarily originates from CRPs, which is predominantly synthesized and secreted by the liver [1, 2], significant differences in the correlation strength between CRPpf and CRPs across various PE types would not be expected—unless additional, non-hepatic sources of CRP contribute to its pleural fluid concentration. Indeed, although the liver is the principal source of circulating CRP, limited local production has been documented in various cell types, including macrophages, lymphocytes, lung epithelial cells, vascular smooth muscle cells, endothelial cells, adipocytes, and certain neuronal cells [1, 2, 61–69]. The regulatory mechanisms underlying CRP expression by these cells remain incompletely understood. Importantly, such local production does not significantly impact CRPs levels [1, 2, 61–69], but may contribute to CRPpf concentrations, particularly in conditions characterized by intense local inflammation.
CPPE is associated with markedly increased pleural capillary permeability due to elevated levels of proinflammatory cytokines such as TNF-α and IL-8. This results in the exudation of protein-rich plasma and inflammatory cells—predominantly neutrophils—into the pleural space [70–73]. CPPE is distinguished by a higher degree of inflammation and tissue injury within the pleura, pleural cavity, and adjacent pulmonary tissue compared to other PE types. It also features elevated absolute numbers of lymphocytes and macrophages at the site of inflammation [60, 70–73]. Although neutrophils do not produce CRP, macrophages and lymphocytes, along with activated lung epithelial, endothelial, and vascular smooth muscle cells, may locally synthesize CRP in response to inflammatory stimuli [1, 2, 61–69], potentially increasing CRPpf levels in CPPE. Conversely, the extensive tissue damage and cellular lysis characteristic of CPPE may lead to the release of intracellular contents into the pleural space. Since CRP is not typically an intracellular protein [1, 2], this lysis may dilute CRP concentrations in the pleural fluid. Furthermore, impaired pleural lymphatic drainage—commonly seen in CPPE due to inflammatory damage [70–76]—can lead to pleural fluid accumulation and dilution of soluble mediators, including CRP. Collectively, while local CRP production in CPPE might increase CRPpf levels, this effect may be offset by dilutional factors resulting from increased fluid volume and cellular breakdown. The net effect appears to be a relative decrease in CRPpf levels, which could explain the weaker correlation observed between CRPpf and CRPs in CPPE compared to other PE subtypes.
UCPPE, like CPPE, results from increased pleural capillary permeability triggered by proinflammatory cytokines, leading to the exudation of protein- and neutrophil-rich plasma into the pleural space [70–73, 76–79]. However, UCPPE is typically associated with sterile pleural fluid and a markedly lower degree of inflammation and tissue injury affecting the pleura, pleural cavity, and adjacent lung parenchyma compared to CPPE [60, 70–73, 76–79]. Consequently, the extent of cellular lysis and the resulting release of intracellular contents into the pleural space, as well as the damage and obstruction of pleural lymphatic drainage pathways, are considerably less pronounced [70–74]. Although both cell lysis and impaired lymphatic absorption can contribute to a reduction in CRPpf levels, in UCPPE, these effects are likely modest. Moreover, any potential decrease in CRPpf due to such local factors may be counterbalanced by limited local CRP synthesis by inflammatory and structural cells present in the affected tissues. Overall, the relatively mild local pathology in UCPPE appears to minimize confounding influences on CRPpf concentration. As a result, CRPpf levels in this group are more directly reflective of CRPs concentrations, which may explain the strong correlation observed between CRPpf and CRPs in UCPPE.
From a pathophysiological perspective, TPE is perhaps the most similar to UCPPE. Like UCPPE, TPE commonly presents as a sterile exudate and is driven by increased pleural capillary permeability secondary to proinflammatory cytokine activity, resulting in protein-rich plasma leakage into the pleural space. In its early (hyperacute) phase, TPE may also exhibit neutrophil predominance, similar to UCPPE, which later transitions to a lymphocyte-dominant profile. Overall, the intensity of inflammation in TPE is comparable to that observed in UCPPE [80–85]. However, several distinguishing features set TPE apart. Unlike UCPPE, TPE involves the formation of caseating granulomas within the pleura and is associated with diffuse pleural inflammation, triggered primarily by mycobacterial antigens, and less frequently by the bacilli themselves [80–85]. This granulomatous response may further increase macrophage infiltration into the pleural space. The combined presence of activated macrophages and lymphocytes, both stimulated by inflammatory cytokines, could contribute to local CRP production at a potentially higher level than that seen in UCPPE [80–85]. This, in turn, may elevate CRP concentrations in the pleural fluid. Conversely, the extensive granulomatous inflammation may also result in enhanced cellular lysis, releasing additional fluid into the pleural cavity and contributing to a dilutional effect on CRPpf levels [80–85]. Furthermore, the diffuse lymphocytic pleuritis characteristic of TPE may cause greater damage and obstruction to the pleural lymphatics—key structures involved in pleural fluid resorption—than is typically observed in UCPPE [70–73, 76, 80–85]. The resulting accumulation of pleural fluid could further reduce CRPpf concentration due to dilution. Taken together, while local cellular production of CRP in TPE may increase CRPpf levels, this effect appears to be counterbalanced by the dilutional influences of increased pleural fluid volume. The net result is that CRPpf in TPE, similar to UCPPE, largely reflects systemic CRP levels rather than being significantly altered by local pleural factors. This is consistent with the strong correlation between CRPpf and CRPs observed in the TPE group in our study.
In MPE, the degree of inflammation is generally lower than that observed in CPPE, UCPPE, and TPE [73–76, 86–89], a finding supported in our study by the comparatively lower levels of both CRPs and CRPpf in the MPE group. However, tissue injury and cellular lysis within the pleura and pleural space—driven by malignant cell infiltration—appear to be more pronounced in MPE than in UCPPE and TPE, though less severe than in CPPE [73–76, 86–89]. Additionally, the high turnover rate of malignant cells, characterized by rapid proliferation and death, contributes further to the overall burden of cellular lysis in MPE. This extensive cell breakdown in the pleura, pleural cavity, and surrounding lung tissue releases intracellular contents into the pleural space, potentially diluting CRP concentrations. The effect is compounded by impaired pleural fluid absorption, commonly due to obstruction of lymphatic channels by malignant cells [73–76, 86–89]. While local CRP production by inflammatory and structural cells—such as lymphocytes, macrophages, lung epithelial cells, and vascular smooth muscle and endothelial cells—may modestly elevate CRPpf, the dilutional effects from cellular lysis and reduced lymphatic clearance likely outweigh this contribution. As a result, CRPpf levels in MPE are influenced by local pathophysiological processes, leading to a diminished correlation with CRPs. Nonetheless, this reduction in correlation strength is less pronounced than that observed in CPPE, where tissue destruction, cellular breakdown, and lymphatic obstruction are considerably more extensive [73–76, 86–89].
Unlike the other four groups, patients with TrPE do not exhibit an inflammatory process, tissue damage, or significant cellular lysis in the pleura, pleural cavity, or adjacent lung tissue [73–76, 86]. Therefore, in these patients, the concentration of CRPpf is expected to reflect solely CRPs level, and the correlation between CRPpf and CRPs should be the strongest. Our findings did demonstrate a strong correlation in the TrPE group—significantly stronger than that observed in CPPE. However, this correlation was similar to that found in MPE and significantly weaker than in both UCPPE and TPE. To interpret this result, it is important to consider that our TrPE patients were undergoing treatment with diuretics of varying dosages and durations. It is well known that, according to Light’s criteria, approximately 25% of patients receiving high-dose or long-term diuretic therapy may have their TrPE misclassified as an exudate [86, 90–94]. This misclassification is primarily due to an increase in the pleural fluid/serum protein ratio to > 0.5, which results from diuretics removing more solvent (water) than solute (protein) from the PE [86, 90–94]. This mechanism likely led to an elevated CRPpf concentration in a subset of our TrPE patients, thereby reducing the strength of the correlation between CRPpf and CRPs in this group. This reduction in correlation strength was similar to that seen in MPE but remained significantly greater than in CPPE. Thus, the TrPE group, in terms of correlation strength, occupied an intermediate position—comparable to MPE and between the stronger correlations observed in UCPPE and TPE and the weaker correlation seen in CPPE.
The mean age of the TrPE, CPPE, and MPE groups was significantly higher than that of the UCPPE and TPE groups (Table 1). Although CRPs levels may increase with age by approximately 1 mg/L [95–98], this increase is minimal and typically remains within the normal range (< 5 mg/L). Such a small increment is unlikely to significantly affect comparisons of CRPs or CRPpf levels among different groups of PE, including those examined in our study, in which the mean CRPs and CRPpf levels were substantially higher than 1 mg/L. This is even more evident when considering the comparison of correlations between CRPpf and CRPs across different PE groups (the aim of our present study). Because CRPpf is primarily derived from CRPs, any increase in CRPs would be accompanied by a corresponding increase in CRPpf. Therefore, the correlation between CRPpf and CRPs levels is unlikely to be meaningfully influenced by small age-related increases in CRPs. This argument also applies to other potential covariates, such as gender [99–102], body mass index [103–106], and smoking [107–110].
This study has two main limitations. First, its retrospective design may introduce inherent biases related to data collection and analysis. Second, the sample size TPE group is too small for robust statistical inference. This main limitation was unavoidable because tuberculosis and tuberculous pleurisy are uncommon in our country. However, statistically, the results are meaningful since the correct statistical test was applied, providing a significant P value. At least, although weak, this statistical significance stimulates performing similar studies on large cohorts of subjects in regions where tuberculous pleurisy is common, in order to validate this statistical significance and its clinical meaningfulness.
Conclusions
This study demonstrated a significant positive correlation between CRPpf and CRPs levels across all five PE groups, a finding consistent with the understanding that CRPs is the primary source of CRPpf. Compared to the limited existing studies on this topic, our results appear more robust and comprehensive. Notably, this is the first study to compare the strength of this correlation across different PE etiologies. We found the strongest associations in the UCPPE and TPE groups, and the weakest in the CPPE group. These variations suggest that local pleural factors—such as cellular CRP production, tissue lysis, and impaired fluid resorption—may influence CRPpf levels independently of CRPs. While plausible mechanistic explanations for these differences have been discussed in detail above, they remain, to some extent, hypothetical. These findings highlight the need for further research—both prospective and retrospective—in larger and more diverse patient populations to confirm and expand upon our observations.
Acknowledgments
None to declare.
Financial Disclosure
This work did not receive external funding.
Conflict of Interest
The authors declare no conflict of interest.
Informed Consent
Patient consent was waived because the study is retrospective and anonymous.
Author Contributions
Conceptualization: MO and YK; methodology: MO, YK and ES; software: MO, YK and ES; validation: MO, YK and ES; formal analysis: MO, YK and ES; investigation: MO, YK and ES; data curation: MO and YK; writing—original draft preparation: MO and YK; writing—review and editing: MO, YK and ES; visualization: MO and YK; supervision: MO; project administration: MO and YK. All authors approved the final version of the manuscript for submission.
Data Availability
Data supporting the findings of this study are available from the corresponding author upon reasonable request.
Institutional Review Board Statement
The study was conducted according to the guidelines of the Declaration of Helsinki, and approved by the Institutional Ethics Committee of Bnai Zion Medical Center (Protocol No.: 0107-16-BNZ).
Abbreviations
CRP: C-reactive protein; CRPs: serum C-reactive protein; CRPpf: pleural fluid C-reactive protein; PE: pleural effusion; TrPE: transudative pleural effusion; UCPPE: uncomplicated parapneumonic effusion; CPPE: complicated parapneumonic effusion; MPE: malignant pleural effusion; TPE: tuberculous pleural effusion; IL-6: interleukin-6; TNF-α: tumor necrosis factor-α; IL-1β: interleukin-1β; IL-17: interleukin-17; ExPE: exudative pleural effusion; CHF: congestive heart failure; SD: standard deviation; CI: confidence interval; IL-8: interleukin-8
| References | ▴Top |
- Mouliou DS. C-reactive protein: pathophysiology, diagnosis, false test results and a novel diagnostic algorithm for clinicians. Diseases. 2023;11(4):132.
doi pubmed - Zhou HH, Tang YL, Xu TH, Cheng B. C-reactive protein: structure, function, regulation, and role in clinical diseases. Front Immunol. 2024;15:1425168.
doi pubmed - Hou H, Li J, Huang T, Ruan Z, Hui X, Huang Y, Gao J. A scoring model based on the pleural effusion adenosine deaminase-to-serum C-reactive protein ratio for differentiating tuberculous pleural effusion from non-tuberculous benign pleural effusion. BMC Pulm Med. 2025;25(1):139.
doi pubmed - Yang Q, Cha SN, Niu Y, Wen JX, Yan L, Hai L, Wang YJ, et al. Diagnostic utility of pleural C-reactive protein and procalcitonin for parapneumonic pleural effusion: a head-to-head comparison study. Infect Drug Resist. 2025;18:919-927.
doi pubmed - Bergamo S, Trape J, Gonzalez-Garcia L, Gonzalez-Fernandez C, Vergara C, la-Torre ND, Bosch-Presegue L, et al. The diagnostic accuracy of HE4 in the differential diagnosis of pleural effusions. Clin Chim Acta. 2025;566:120027.
doi pubmed - Mammadova A, Galata Z, Yaylcinkaya Z, Yilmaz Demirci N. Diagnostic value of pleural fluid and serum C-reactive protein/albumin ratio in exudate/transudate, infectious/non-infectious pleural fluid discrimination. Monaldi Arch Chest Dis. 2025.
doi pubmed - Dole SS, Balan A, Gaikwad NS. Utility of the Ratio of Adenosine Deaminase and Serum C-reactive Protein in Differentiating Parapneumonic, Tuberculous, and Malignant Pleural Effusions. Cureus. 2024;16(7):e65659.
doi pubmed - Jeon DS, Kim SH, Lee JH, Choi CM, Park HJ. Conditional diagnostic accuracy according to inflammation status and age for diagnosing tuberculous effusion. BMC Pulm Med. 2023;23(1):400.
doi pubmed - Liu Y, Huang W, Yang J, Yuan S, Li C, Wang W, Liang Z, et al. Construction of a multi-classified decision tree model for identifying malignant pleural effusion and tuberculous pleural effusion. Clin Biochem. 2023;120:110655.
doi pubmed - Rabbi MF, Ahmed MN, Patowary MSA, Huq SR, Razzaque SMA, Arafat HM, Nahar T, et al. Pleural fluid adenosine deaminase to serum C-reactive protein ratio for diagnosing tuberculous pleural effusion. BMC Pulm Med. 2023;23(1):349.
doi pubmed - Wang J, Feng ZX, Ren T, Meng WY, Khan I, Fan XX, Pan HD, et al. Novel clinical biomarkers in blood and pleural effusion for diagnosing patients with tuberculosis distinguishing from malignant tumor. Medicine (Baltimore). 2022;101(41):e31027.
doi pubmed - Lee J, Park JE, Choi SH, Seo H, Lee SY, Lim JK, Yoo SS, et al. Laboratory and radiological discrimination between tuberculous and malignant pleural effusions with high adenosine deaminase levels. Korean J Intern Med. 2022;37(1):137-145.
doi pubmed - Rismantab O, Moosavi SAJ, Farahnak MR, Dastoorpoor M, Raji H. Role of CRP as a marker for discrimination of exudative and transudative pleural effusion. Monaldi Arch Chest Dis. 2022; 92:2059.
- Qu SY, Zhang Y, Wu S, Wang MM, Liu LL, Yang XM, Shan HL, et al. Combined analysis of C-reactive protein in pleural fluid and serum is effective in the differential diagnosis of exudative pleural effusions. Ann Transl Med. 2021;9(14):1183.
doi pubmed - Perlepe G, Varsamas C, Petinaki E, Antonopoulos D, Daniil Z, Gourgoulianis KI. Discrimination of exudative pleural effusions based on pleural adenosine deaminase (ADA)-C-reactive protein (CRP) levels, and their combination: an observational prospective study. J Pers Med. 2021;11(9):864.
doi pubmed - Zheng WQ, Hu ZD. Pleural fluid biochemical analysis: the past, present and future. Clin Chem Lab Med. 2023;61(5):921-934.
doi pubmed - Cao XS, Zheng WQ, Hu ZD. Diagnostic value of soluble biomarkers for parapneumonic pleural effusion. Crit Rev Clin Lab Sci. 2023;60(3):233-247.
doi pubmed - Izhakian S, Wasser WG, Fox BD, Vainshelboim B, Kramer MR. The Diagnostic Value of the Pleural Fluid C-Reactive Protein in Parapneumonic Effusions. Dis Markers. 2016;2016:7539780.
doi pubmed - Yilmaz Turay U, Yildirim Z, Turkoz Y, Biber C, Erdogan Y, Keyf AI, Ugurman F, et al. Use of pleural fluid C-reactive protein in diagnosis of pleural effusions. Respir Med. 2000;94(5):432-435.
doi pubmed - Rezaeetalab F, Parizadeh SM, Esmaeely H, Akbari H, Akbari F, Saberi S. Tumor necrosis factor alpha and high sensitivity C-reactive protein in diagnosis of exudative pleural effusion. J Res Med Sci. 2011;16(11):1405-1409.
pubmed - Castano Vidriales JL, Amores Antequera C. Use of pleural fluid C-reactive protein in laboratory diagnosis of pleural effusions. Eur J Med. 1992;1(4):201-207.
pubmed - Elsammak MM, Morsi TS, Khamis HI, Ragab MS, Zaki MA, Abdel-Hadi M, Hassan HA. Osteopontin and C-reactive protein in Egyptian patients affected with tuberculous and malignant pleural effusion. Ann Clin Biochem. 2007;44(Pt 3):264-272.
doi pubmed - Kiropoulos TS, Kostikas K, Oikonomidi S, Tsilioni I, Nikoulis D, Germenis A, Gourgoulianis KI. Acute phase markers for the differentiation of infectious and malignant pleural effusions. Respir Med. 2007;101(5):910-918.
doi pubmed - Alexandrakis MG, Coulocheri SA, Bouros D, Vlachonikolis IG, Eliopoulos GD. Significance of alpha-2-macroglobulin, alpha-1-acid glycoprotein, and C-reactive protein in pleural effusion differentiation. Respiration. 2000;67(1):30-35.
doi pubmed - Porcel JM, Vives M, Cao G, Bielsa S, Ruiz-Gonzalez A, Martinez-Iribarren A, Esquerda A. Biomarkers of infection for the differential diagnosis of pleural effusions. Eur Respir J. 2009;34(6):1383-1389.
doi pubmed - Kapisyzi P, Argjiri D, Mitre A, Burazeri G, Hasa R, Nuredini O, et al. The use of pleural fluid C-reactive protein level as a diagnostic marker for pleural effusions. Int J Sci Res. 2015;4:206-213.
- Bielsa S, Valencia H, Ruiz-Gonzalez A, Esquerda A, Porcel JM. Serum C-reactive protein as an adjunct for identifying complicated parapneumonic effusions. Lung. 2014;192(4):577-581.
doi pubmed - Li D, Shen Y, Qin J, Wan C, Zeng N, Chen L, Dong Y. Diagnostic performance of C-reactive protein for parapneumonic pleural effusion: a meta-analysis. Ann Transl Med. 2019;7(1):1.
doi pubmed - Chen SC, Chen W, Hsu WH, Yu YH, Shih CM. Role of pleural fluid C-reactive protein concentration in discriminating uncomplicated parapneumonic pleural effusions from complicated parapneumonic effusion and empyema. Lung. 2006;184(3):141-145.
doi pubmed - Porcel JM, Galindo C, Esquerda A, Trujillano J, Ruiz-Gonzalez A, Falguera M, Vives M. Pleural fluid interleukin-8 and C-reactive protein for discriminating complicated non-purulent from uncomplicated parapneumonic effusions. Respirology. 2008;13(1):58-62.
doi pubmed - Zhong M, Ni R, Zhang H, Sun Y. Analysis of clinical characteristics and risk factors of community-acquired pneumonia complicated by parapneumonic pleural effusion in elderly patients. BMC Pulm Med. 2023;23(1):355.
doi pubmed - Porcel JM, Bielsa S, Esquerda A, Ruiz-Gonzalez A, Falguera M. Pleural fluid C-reactive protein contributes to the diagnosis and assessment of severity of parapneumonic effusions. Eur J Intern Med. 2012;23(5):447-450.
doi pubmed - Skouras V, Boultadakis E, Nikoulis D, Polychronopoulos V, Daniil Z, Kalomenidis I, Gourgoulianis KI. Prognostic value of C-reactive protein in parapneumonic effusions. Respirology. 2012;17(2):308-314.
doi pubmed - Porcel JM, Valencia H, Bielsa S. Factors influencing pleural drainage in parapneumonic effusions. Rev Clin Esp (Barc). 2016;216(7):361-366.
doi pubmed - Marinkovic SP, Topuzovska IK, Stevanovic M, Anastasovska A. Features of parapneumonic effusions. Pril (Makedon Akad Nauk Umet Odd Med Nauki). 2018;39(1):131-141.
doi pubmed - Petrusevska-Marinkovic S, Kondova-Topuzovska I, Milenkovic Z, Kondov G, Anastasovska A. Clinical, laboratory and radiographic features of patients with pneumonia and parapneumonic effusions. Open Access Maced J Med Sci. 2016;4(3):428-434.
doi pubmed - Wu KA, Wu CC, Liu YC, Hsueh PC, Chin CY, Wang CL, Chu CM, et al. Combined serum biomarkers in the noninvasive diagnosis of complicated parapneumonic effusions and empyema. BMC Pulm Med. 2019;19(1):108.
doi pubmed - Okino AM, Burger C, Cardoso JR, Lavado EL, Lotufo PA, Campa A. The acute-phase proteins serum amyloid A and C reactive protein in transudates and exudates. Mediators Inflamm. 2006;2006(1):47297.
doi pubmed - Chierakul N, Kanitsap A, Chaiprasert A, Viriyataveekul R. A simple C-reactive protein measurement for the differentiation between tuberculous and malignant pleural effusion. Respirology. 2004;9(1):66-69.
doi pubmed - San Jose ME, Valdes L, Vizcaino LH, Mora T, Pose A, Soneira E, Crecente C, et al. Procalcitonin, C-reactive protein, and cell counts in the diagnosis of parapneumonic pleural effusions. J Investig Med. 2010;58(8):971-976.
doi pubmed - Botana-Rial M, Casado-Rey P, Leiro-Fernandez V, Andrade-Olivie M, Represas-Represas C, Fernandez-Villar A. Validity of procalcitonin and C-reactive protein measurement when differentiating between benign and malignant pleural effusion. Clin Lab. 2011;57(5-6):373-378.
pubmed - Watanabe N, Ishii T, Kita N, Kanaji N, Nakamura H, Nanki N, Ueda Y, et al. The usefulness of pleural fluid presepsin, C-reactive protein, and procalcitonin in distinguishing different causes of pleural effusions. BMC Pulm Med. 2018;18(1):176.
doi pubmed - Zhou G, Liu K, Ji X, Fen Y, Gu Y, Ding H. Diagnosis of parapneumonic pleural effusion with serum and pleural fluid Activin A. Clinics (Sao Paulo). 2022;77:100133.
doi pubmed - Makwana S, Gohil P, Gabhawala Y. The role of pleural fluid C-reactive protein in the diagnosis of exudative pleural effusions. Cureus. 2022;14(7):e27000.
doi pubmed - Garcia-Pachon E, Llorca I. Diagnostic value of C-reactive protein in exudative pleural effusions. Eur J Intern Med. 2002;13(4):246-249.
doi pubmed - Garcia-Pachon E, Soler MJ, Padilla-Navas I, Romero V, Shum C. C-reactive protein in lymphocytic pleural effusions: a diagnostic aid in tuberculous pleuritis. Respiration. 2005;72(5):486-489.
doi pubmed - Daniil ZD, Zintzaras E, Kiropoulos T, Papaioannou AI, Koutsokera A, Kastanis A, Gourgoulianis KI. Discrimination of exudative pleural effusions based on multiple biological parameters. Eur Respir J. 2007;30(5):957-964.
doi pubmed - Ji Q, Huang B, Wang M, Ren Z, Zhang S, Zhang Y, Sheng L, et al. Pleural fluid prealbumin and C-reactive protein in the differential diagnosis of infectious and malignant pleural effusions. Exp Ther Med. 2014;7(4):778-784.
doi pubmed - Valdes L, San-Jose E, Ferreiro L, Golpe A, Gonzalez-Barcala FJ, Toubes ME, Rodriguez-Alvarez MX, et al. Predicting malignant and tuberculous pleural effusions through demographics and pleural fluid analysis of patients. Clin Respir J. 2015;9(2):203-213.
doi pubmed - Gabhale SD, Taparia P, Yadav D, Agnihotri SP. Usefulness of pleural fluid CRP level in differential diagnosis of exudative pleural effusion - a pilot study. Int J Clin Biochem Res. 2015;2:97-109.
- Ferreiro L, Lado-Baleato O, Suarez-Antelo J, Toubes ME, San Jose ME, Lama A, Rodriguez-Nunez N, et al. Diagnosis of infectious pleural effusion using predictive models based on pleural fluid biomarkers. Ann Thorac Med. 2019;14(4):254-263.
doi pubmed - Zhang J, Chen Y, He G, Jiang X, Chen P, Ouyang J. Differential diagnosis of tuberculous and malignant pleural effusions: comparison of the Th1/Th2 cytokine panel, tumor marker panel and chemistry panel. Scand J Clin Lab Invest. 2020;80(4):265-270.
doi pubmed - Dixon G, Lama-Lopez A, Bintcliffe OJ, Morley AJ, Hooper CE, Maskell NA. The role of serum procalcitonin in establishing the diagnosis and prognosis of pleural infection. Respir Res. 2017;18(1):30.
doi pubmed - Dongel I, Gokmen AA, Camas HE, Gonen I, Kaya S. Diagnostic significance of biochemical markers and pentraxin-3 in the differential diagnosis of malign, benign pleural effusion and empyema. J Pak Med Assoc. 2020;70(5):860-864.
doi pubmed - Lin L, Li S, Xiong Q, Wang H. A retrospective study on the combined biomarkers and ratios in serum and pleural fluid to distinguish the multiple types of pleural effusion. BMC Pulm Med. 2021;21(1):95.
doi pubmed - Zhao T, Zhang J, Zhang X, Wang C. Clinical significance of pleural fluid lactate dehydrogenase/adenosine deaminase ratio in the diagnosis of tuberculous pleural effusion. BMC Pulm Med. 2024;24(1):241.
doi pubmed - Kim ES, Islam J, Lee HJ, Seong SY, Youn JI, Kwon BS, Kim SJ, et al. Myeloid-derived suppressor cells in pleural effusion as a diagnostic marker for early discrimination of pulmonary tuberculosis from pneumonia. Front Immunol. 2024;15:1390327.
doi pubmed - Odeh M, Kogan Y, Sabo E. Diagnostic efficacy of C-reactive protein in differentiating various causes of exudative pleural effusion: Disease research should not be exclusive to the wealthy. Adv Respir Med. 2025;93(4):29.
doi pubmed - Kogan Y, Sabo E, Odeh M. Role of C-reactive protein in discrimination between transudative and exudative pleural effusions. Diagnostics (Basel). 2021;11(11):2003.
doi pubmed - Kogan Y, Sabo E, Odeh M. Diagnostic value of C-reactive protein in discrimination between uncomplicated and complicated parapneumonic effusion. Diagnostics (Basel). 2020;10(10):829.
doi pubmed - Black S, Kushner I, Samols D. C-reactive protein. J Biol Chem. 2004;279(47):48487-48490.
doi pubmed - Agassandian M, Shurin GV, Ma Y, Shurin MR. C-reactive protein and lung diseases. Int J Biochem Cell Biol. 2014;53:77-88.
doi pubmed - Gould JM, Weiser JN. Expression of C-reactive protein in the human respiratory tract. Infect Immun. 2001;69(3):1747-1754.
doi pubmed - Kaplan M, Shur A, Tendler Y. M1 Macrophages but Not M2 Macrophages Are Characterized by Upregulation of CRP Expression via Activation of NFkappaB: a Possible Role for Ox-LDL in Macrophage Polarization. Inflammation. 2018;41(4):1477-1487.
doi pubmed - Salazar J, Martinez MS, Chavez-Castillo M, Nunez V, Anez R, Torres Y, Toledo A, et al. C-reactive protein: an in-depth look into structure, function, and regulation. Int Sch Res Notices. 2014;2014:653045.
doi pubmed - Boncler M, Wu Y, Watala C. The multiple faces of C-reactive protein-physiological and pathophysiological implications in cardiovascular disease. Molecules. 2019;24(11):2062.
doi pubmed - Xu S, Zhao J, Liu J, Gou W. Fibrinopeptide a induces expression of C-reactive protein via the ROS-ERK1/2/ P38-NF-kappaB signal pathway in vascular smooth muscle cells. Cell Physiol Biochem. 2018;47(1):266-278.
doi pubmed - Calabro P, Willerson JT, Yeh ET. Inflammatory cytokines stimulated C-reactive protein production by human coronary artery smooth muscle cells. Circulation. 2003;108(16):1930-1932.
doi pubmed - Calabro P, Chang DW, Willerson JT, Yeh ET. Release of C-reactive protein in response to inflammatory cytokines by human adipocytes: linking obesity to vascular inflammation. J Am Coll Cardiol. 2005;46(6):1112-1113.
doi pubmed - Ferreiro L, Toubes ME, Suarez-Antelo J, Rodriguez-Nunez N, Valdes L. Clinical overview of the physiology and pathophysiology of pleural fluid movement: a narrative review. ERJ Open Res. 2024;10(5):00050-2024.
doi pubmed - Botana Rial M, Perez Pallares J, Cases Viedma E, Lopez Gonzalez FJ, Porcel JM, Rodriguez M, Romero Romero B, et al. Diagnosis and treatment of pleural effusion. recommendations of the spanish society of pulmonology and thoracic surgery. Update 2022. Arch Bronconeumol. 2023;59(1):27-35.
doi pubmed - Abdulelah M, Abu Hishmeh M. Infective Pleural Effusions - a comprehensive narrative review article. Clin Pract. 2024;14(3):870-881.
doi pubmed - McCauley L, Dean N. Pneumonia and empyema: causal, casual or unknown. J Thorac Dis. 2015;7(6):992-998.
doi pubmed - Foley SPF, Parrish JS. Pleural Space Infections. Life (Basel). 2023;13(2):376.
doi pubmed - Zocchi L. Physiology and pathophysiology of pleural fluid turnover. Eur Respir J. 2002;20(6):1545-1558.
doi pubmed - Porcel JM, Light RW. Pleural effusions. Dis Mon. 2013;59(2):29-57.
doi pubmed - Odeh M, Sabo E, Srugo I, Oliven A. Correlation between polymorphonuclear leukocyte counts and levels of tumor necrosis factor-a in pleural fluid of patients with parapneumonic effusion. Lung. 2002;180(5):265-271.
doi pubmed - Odeh M, Sabo E, Oliven A, Srugo I. Role of tumor necrosis factor-alpha in the differential diagnosis of parapneumonic effusion. Int J Infect Dis. 2000;4(1):38-41.
doi pubmed - Odeh M, Makhoul B, Sabo E, Srugo I, Oliven A. The role of pleural fluid-serum gradient of tumor necrosis factor-alpha concentration in discrimination between complicated and uncomplicated parapneumonic effusion. Lung. 2005;183(1):13-27.
doi pubmed - Chan KKP, Lee YCG. Tuberculous pleuritis: clinical presentations and diagnostic challenges. Curr Opin Pulm Med. 2024;30(3):210-216.
doi pubmed - McNally E, Ross C, Gleeson LE. The tuberculous pleural effusion. Breathe (Sheff). 2023;19(4):230143.
doi pubmed - Shaw JA, Koegelenberg CFN. Pleural tuberculosis. Clin Chest Med. 2021;42(4):649-666.
doi pubmed - Lo Cascio CM, Kaul V, Dhooria S, Agrawal A, Chaddha U. Diagnosis of tuberculous pleural effusions: a review. Respir Med. 2021;188:106607.
doi pubmed - Cohen LA, Light RW. Tuberculous pleural effusion. Turk Thorac J. 2015;16(1):1-9.
doi pubmed - Light RW. Update on tuberculous pleural effusion. Respirology. 2010;15(3):451-458.
doi pubmed - Ferreiro L, Toubes ME, San Jose ME, Suarez-Antelo J, Golpe A, Valdes L. Advances in pleural effusion diagnostics. Expert Rev Respir Med. 2020;14(1):51-66.
doi pubmed - Gonnelli F, Hassan W, Bonifazi M, Pinelli V, Bedawi EO, Porcel JM, Rahman NM, et al. Malignant pleural effusion: current understanding and therapeutic approach. Respir Res. 2024;25(1):47.
doi pubmed - Pardessus Otero A, Rafecas-Codern A, Porcel JM, Serra-Mitja P, Ferreiro L, Botana-Rial M, Ramos-Hernandez C, et al. Malignant pleural effusion: a multidisciplinary approach. Open Respir Arch. 2024;6(4):100349.
doi pubmed - Yalcin NG, Choong CK, Eizenberg N. Anatomy and pathophysiology of the pleura and pleural space. Thorac Surg Clin. 2013;23(1):1-10, v.
doi pubmed - Feller-Kopman D, Light R. Pleural Disease. N Engl J Med. 2018;378(8):740-751.
doi pubmed - Bielsa S, Porcel JM, Castellote J, Mas E, Esquerda A, Light RW. Solving the Light's criteria misclassification rate of cardiac and hepatic transudates. Respirology. 2012;17(4):721-726.
doi pubmed - Mohan G, Bhide P, Agrawal A, Kaul V, Chaddha U. A practical approach to pseudoexudative pleural effusions. Respir Med. 2023;214:107279.
doi pubmed - Heffner JE, Brown LK, Barbieri CA. Diagnostic value of tests that discriminate between exudative and transudative pleural effusions. Primary Study Investigators. Chest. 1997;111(4):970-980.
doi pubmed - Romero-Candeira S, Hernandez L, Romero-Brufao S, Orts D, Fernandez C, Martin C. Is it meaningful to use biochemical parameters to discriminate between transudative and exudative pleural effusions? Chest. 2002;122(5):1524-1529.
doi pubmed - Hutchinson WL, Koenig W, Frohlich M, Sund M, Lowe GD, Pepys MB. Immunoradiometric assay of circulating C-reactive protein: age-related values in the adult general population. Clin Chem. 2000;46(7):934-938.
pubmed - Gabay C, Kushner I. Acute-phase proteins and other systemic responses to inflammation. N Engl J Med. 1999;340(6):448-454.
doi pubmed - Gao D, Ni X, Fang S, Wang Z, Jiao J, Liu D, Huang X, et al. Exploration for the reference interval of C-reactive protein in the Chinese longevity people over 90 years of age. Diabetes Metab Syndr. 2023;17(8):102817.
doi pubmed - Tang YB, Huo JS, Huang J, Li H, Piao JH, Sun J, Wang LJ. Distribution of High-sensitivity C-reactive protein status in an urban population in China. Biomed Environ Sci. 2020;33(6):396-402.
doi pubmed - Khera A, McGuire DK, Murphy SA, Stanek HG, Das SR, Vongpatanasin W, Wians FH, Jr., et al. Race and gender differences in C-reactive protein levels. J Am Coll Cardiol. 2005;46(3):464-469.
doi pubmed - Rogowski O, Zeltser D, Shapira I, Burke M, Zakut V, Mardi T, Ben-Assayag E, et al. Gender difference in C-reactive protein concentrations in individuals with atherothrombotic risk factors and apparently healthy ones. Biomarkers. 2004;9(1):85-92.
doi pubmed - Lee YJ, Lee JH, Shin YH, Kim JK, Lee HR, Lee DC. Gender difference and determinants of C-reactive protein level in Korean adults. Clin Chem Lab Med. 2009;47(7):863-869.
doi pubmed - Lakoski SG, Cushman M, Criqui M, Rundek T, Blumenthal RS, D'Agostino RB, Jr., Herrington DM. Gender and C-reactive protein: data from the Multiethnic Study of Atherosclerosis (MESA) cohort. Am Heart J. 2006;152(3):593-598.
doi pubmed - Qin T, Liu W, Yin M, Shu C, Yan M, Zhang J, Yin P. Body mass index moderates the relationship between C-reactive protein and depressive symptoms: evidence from the China Health and Retirement Longitudinal Study. Sci Rep. 2017;7:39940.
doi pubmed - Ridker PM, Buring JE, Cook NR, Rifai N. C-reactive protein, the metabolic syndrome, and risk of incident cardiovascular events: an 8-year follow-up of 14 719 initially healthy American women. Circulation. 2003;107(3):391-397.
doi pubmed - Nishitani N, Sakakibara H. Association between body mass index and high-sensitivity C-reactive protein in male Japanese. Obes Res Clin Pract. 2013;7(4):e297-300.
doi pubmed - Won CW, Lee SW, Choi HR, Kim BS, Park HS, Yukawa M. Body mass index and C-reactive protein in the healthy Korean aged men. J Korean Med Sci. 2006;21(5):811-815.
doi pubmed - Madsen C, Nafstad P, Eikvar L, Schwarze PE, Ronningen KS, Haaheim LL. Association between tobacco smoke exposure and levels of C-reactive protein in the Oslo II Study. Eur J Epidemiol. 2007;22(5):311-317.
doi pubmed - Ohsawa M, Okayama A, Nakamura M, Onoda T, Kato K, Itai K, Yoshida Y, et al. CRP levels are elevated in smokers but unrelated to the number of cigarettes and are decreased by long-term smoking cessation in male smokers. Prev Med. 2005;41(2):651-656.
doi pubmed - Levitzky YS, Guo CY, Rong J, Larson MG, Walter RE, Keaney JF, Jr., Sutherland PA, et al. Relation of smoking status to a panel of inflammatory markers: the framingham offspring. Atherosclerosis. 2008;201(1):217-224.
doi pubmed - Kianoush S, Bittencourt MS, Lotufo PA, Bensenor IM, Jones SR, DeFilippis AP, Toth PP, et al. Association between smoking and serum GlycA and high-sensitivity C-reactive protein levels: the multi-ethnic study of atherosclerosis (MESA) and Brazilian longitudinal study of adult health (ELSA-Brasil). J Am Heart Assoc. 2017;6(8):e006545.
doi pubmed
This article is distributed under the terms of the Creative Commons Attribution 4.0 International License (CC BY 4.0), which permits unrestricted use, distribution, and reproduction in any medium, including commercial use, provided the original work is properly cited.
Journal of Clinical Medicine Research is published by Elmer Press Inc.