Figures
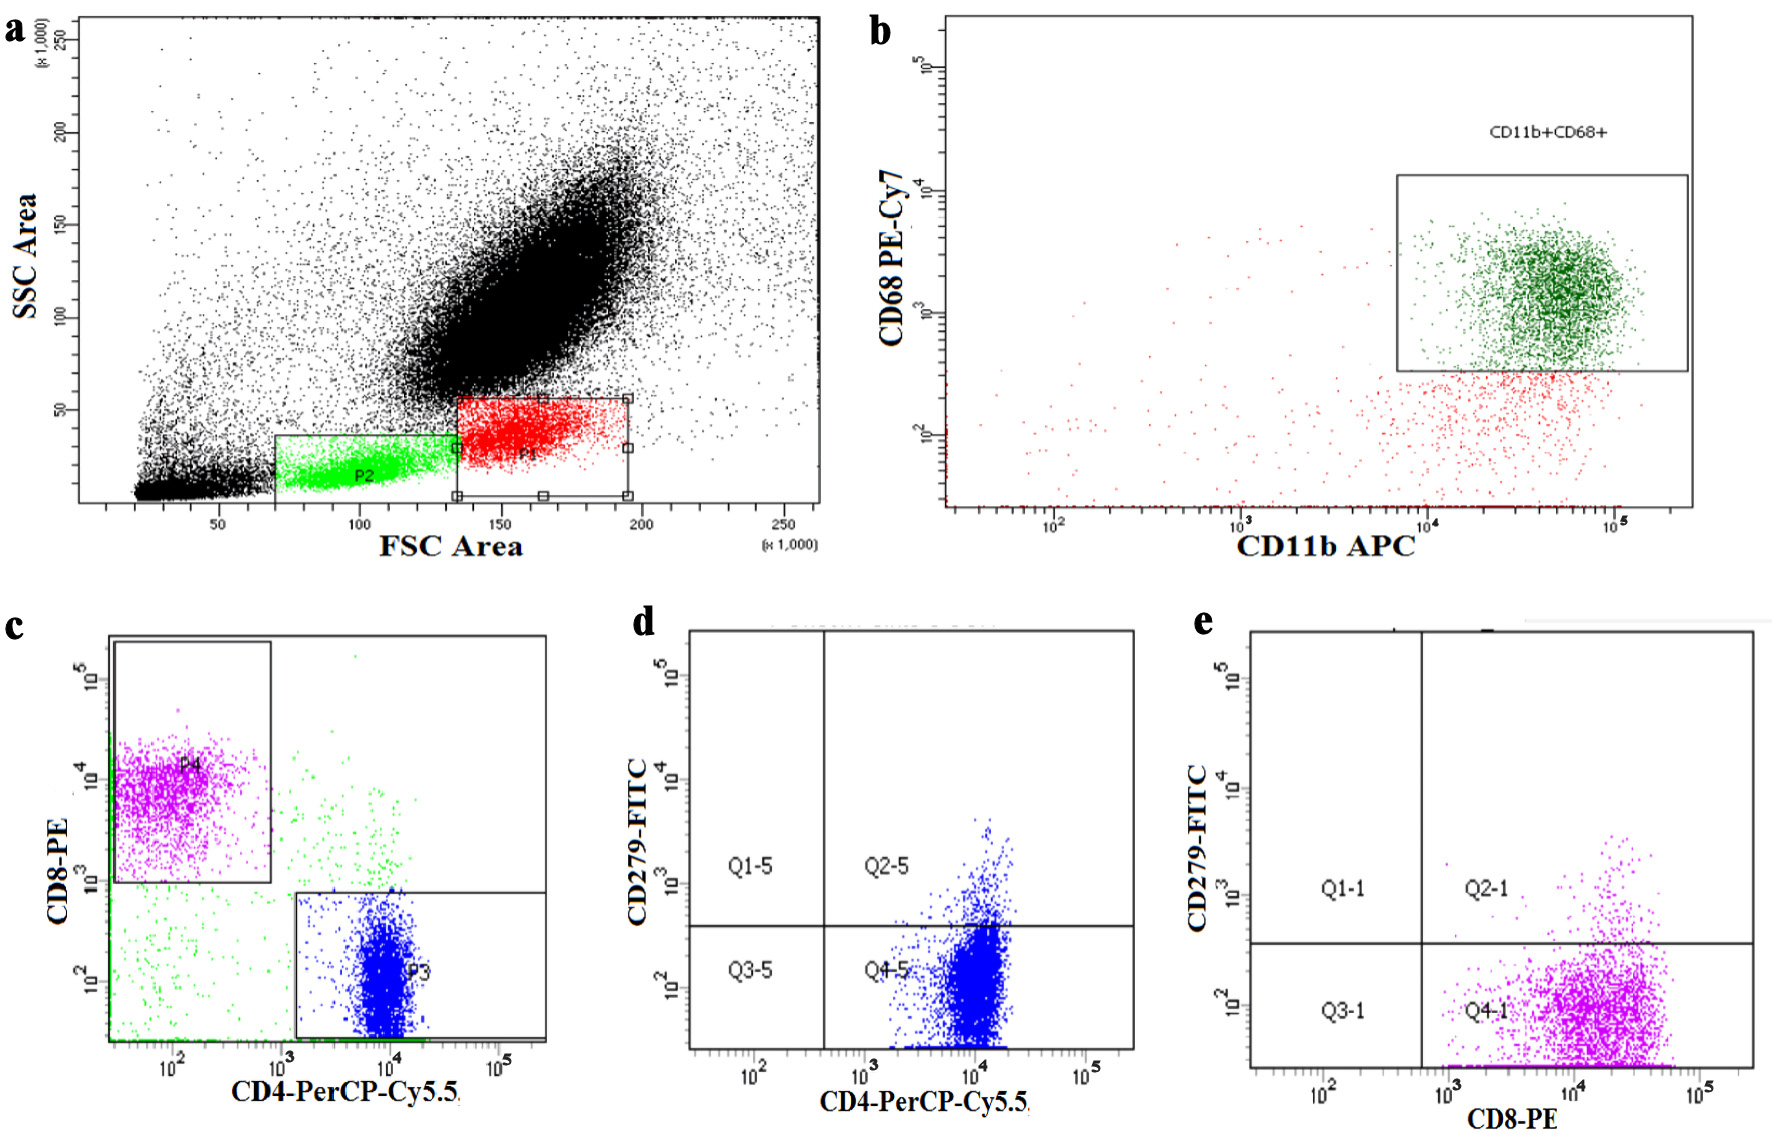
↓ Figure 1. Flow cytometric detection of the
checkpoint expression on T cells. (a) Forward and side scatter histogram was used to define monocytes
and lymphocytes population. (b) CD68 and CD11b were assessed on the monocyte population to detect total
macrophage. (c) Then CD4+ cells and CD8+ cells were assessed on lymphocytes and then gated.
(d, e) The expression of CD279 (PD-1) was assessed on CD4+ and CD8+ cells. PD-1:
programmed cell death protein 1.
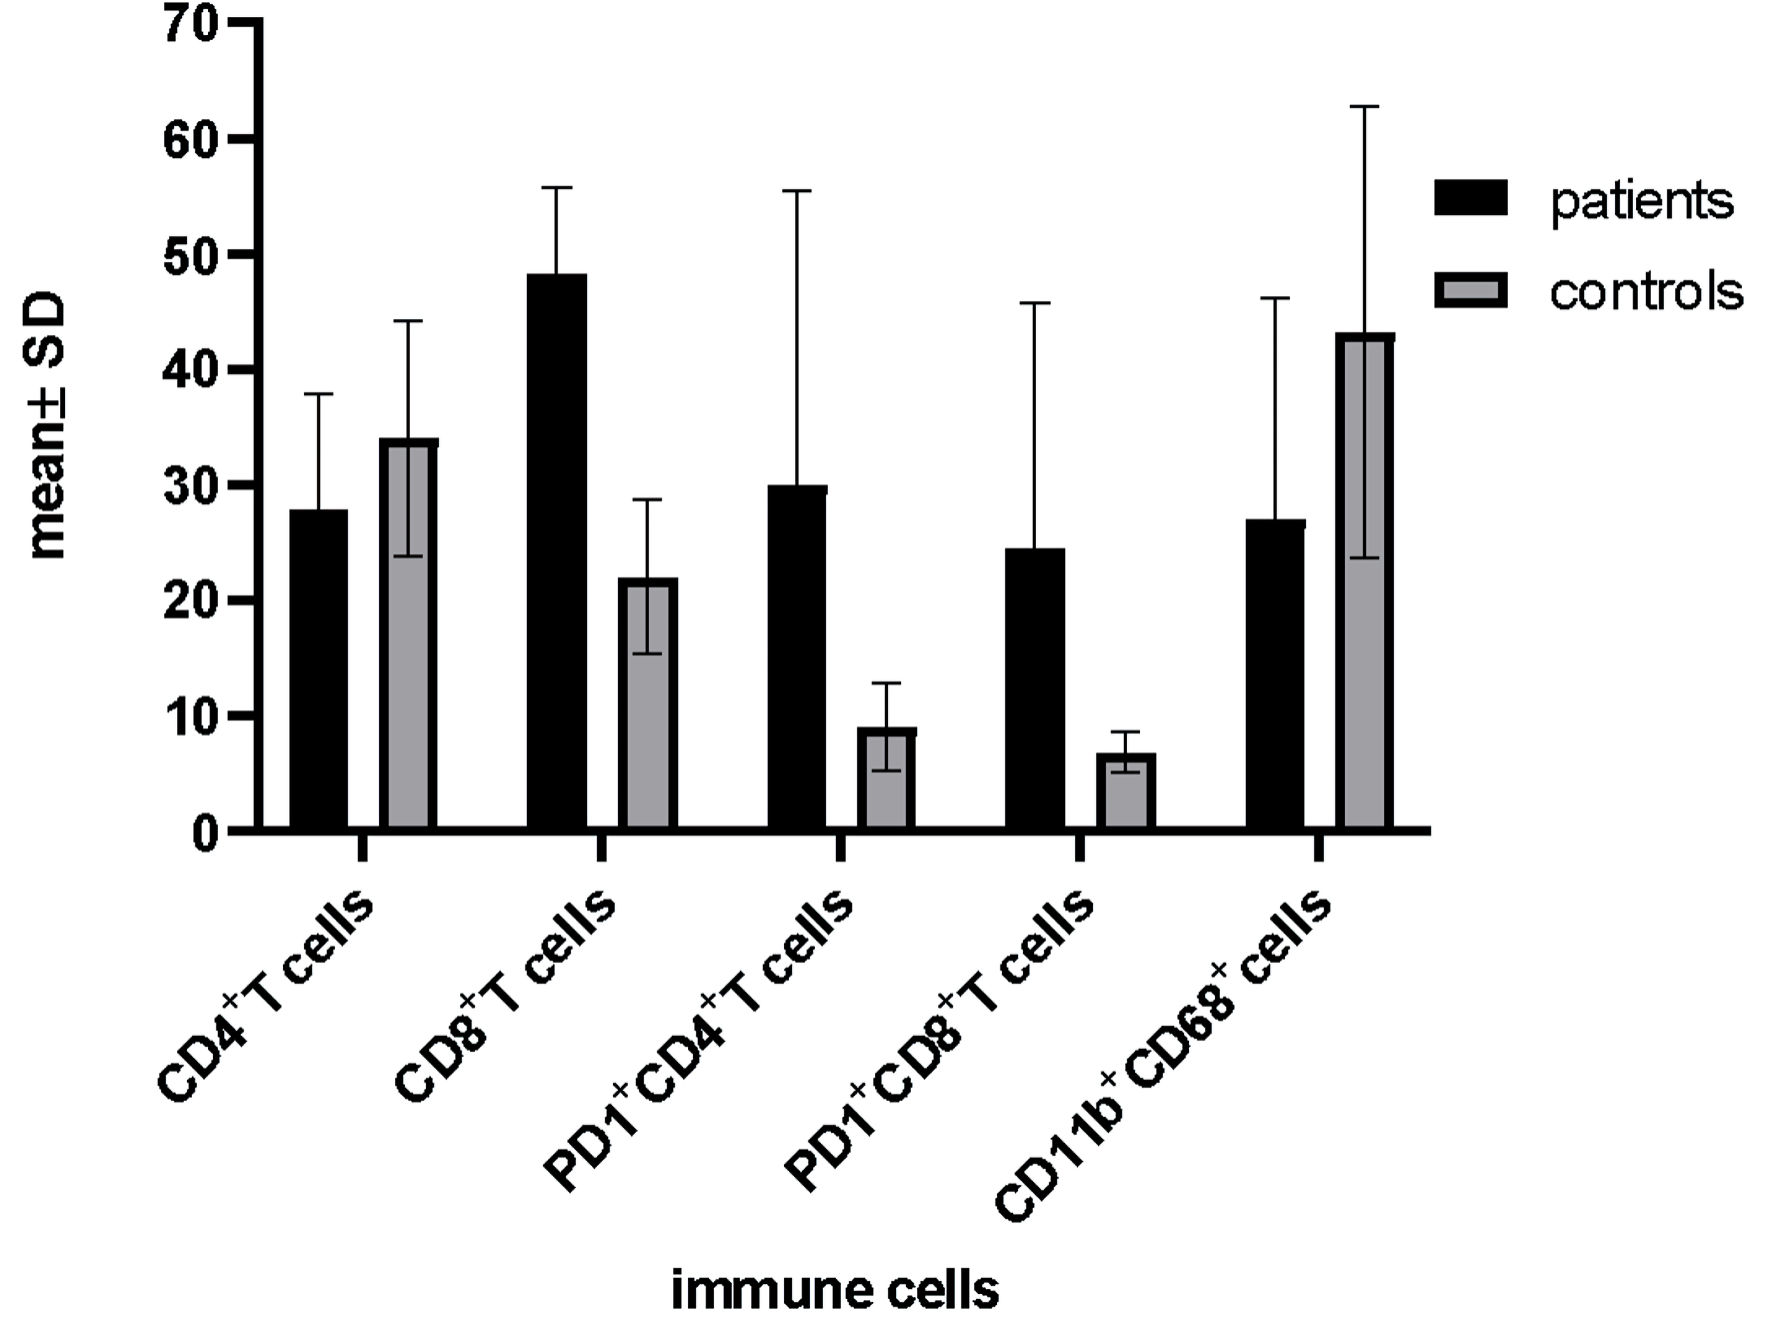
↓ Figure 2. Differential expression of PD-1 and
macrophages between patients and healthy controls. Data are analyzed by Mann Whitney U-test. PD-1:
programmed cell death protein 1.
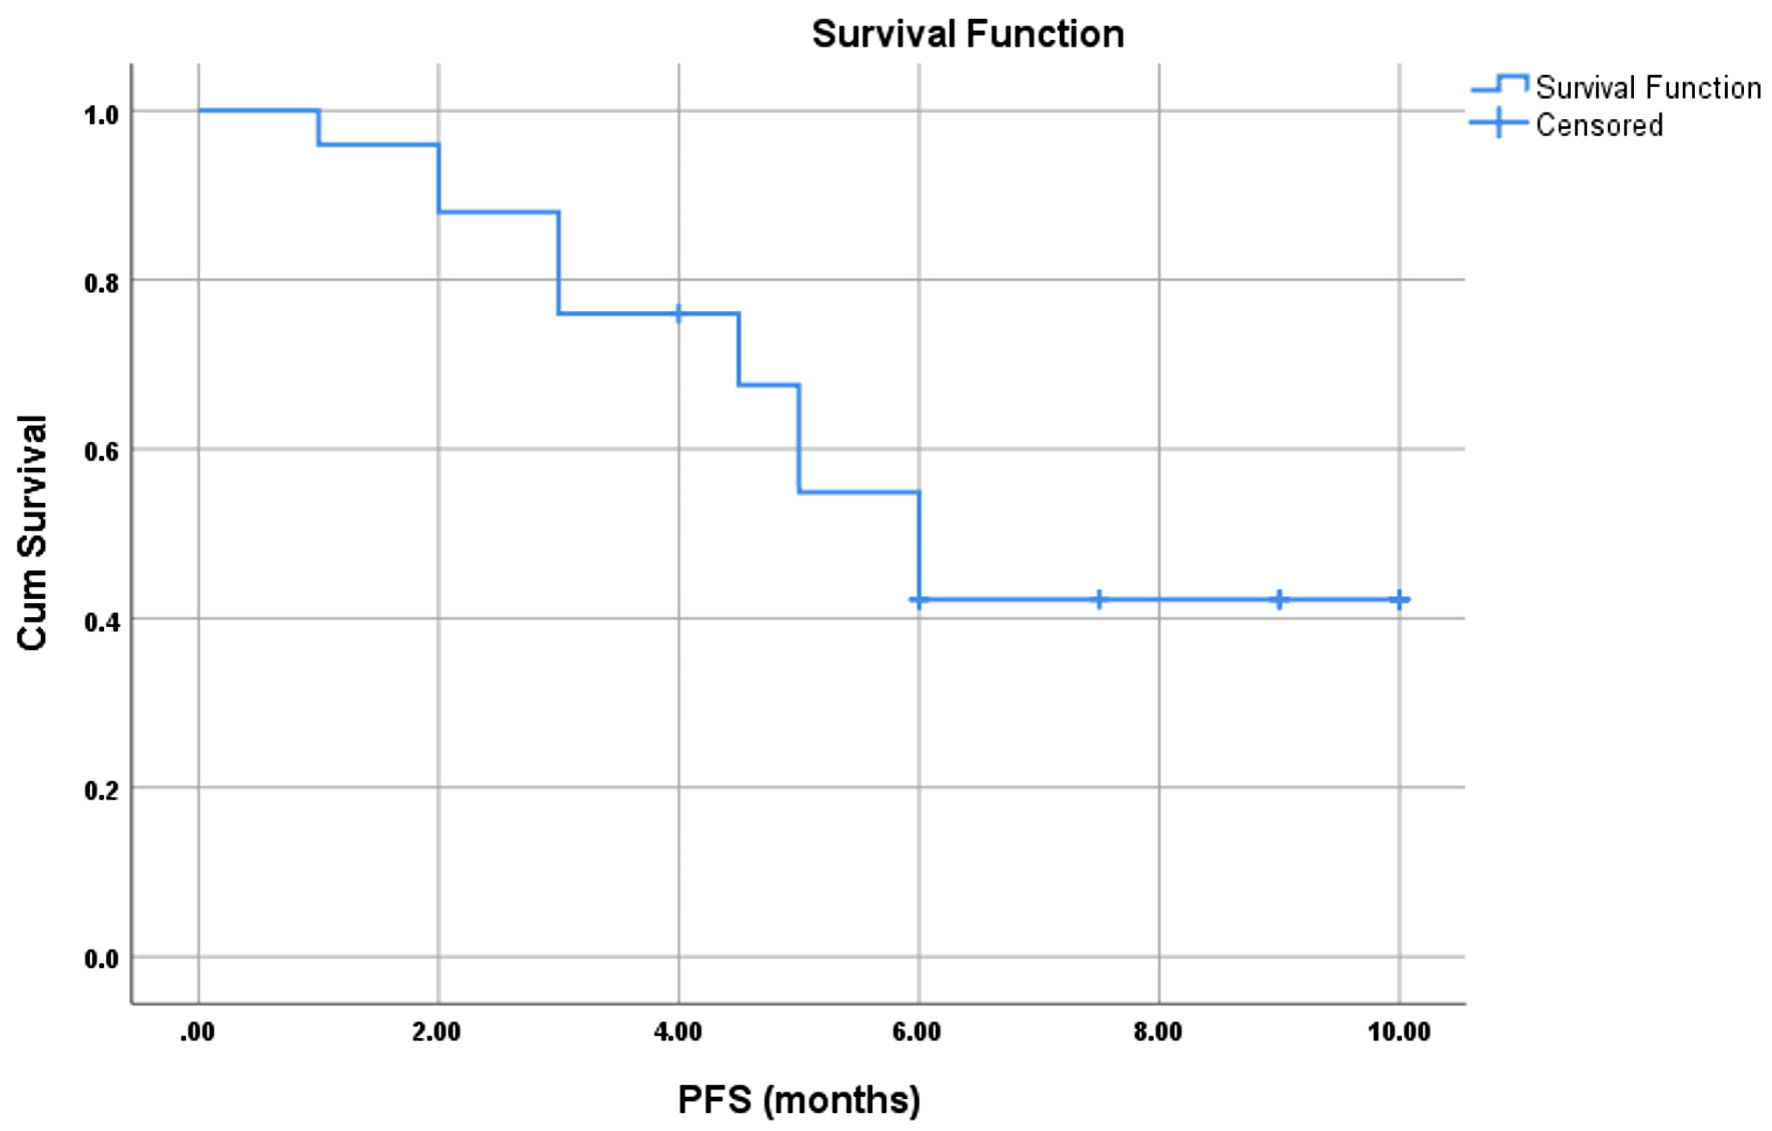
↓ Figure 3. PFS of 25 metastatic
cholangiocarcinoma. PFS: progression-free survival
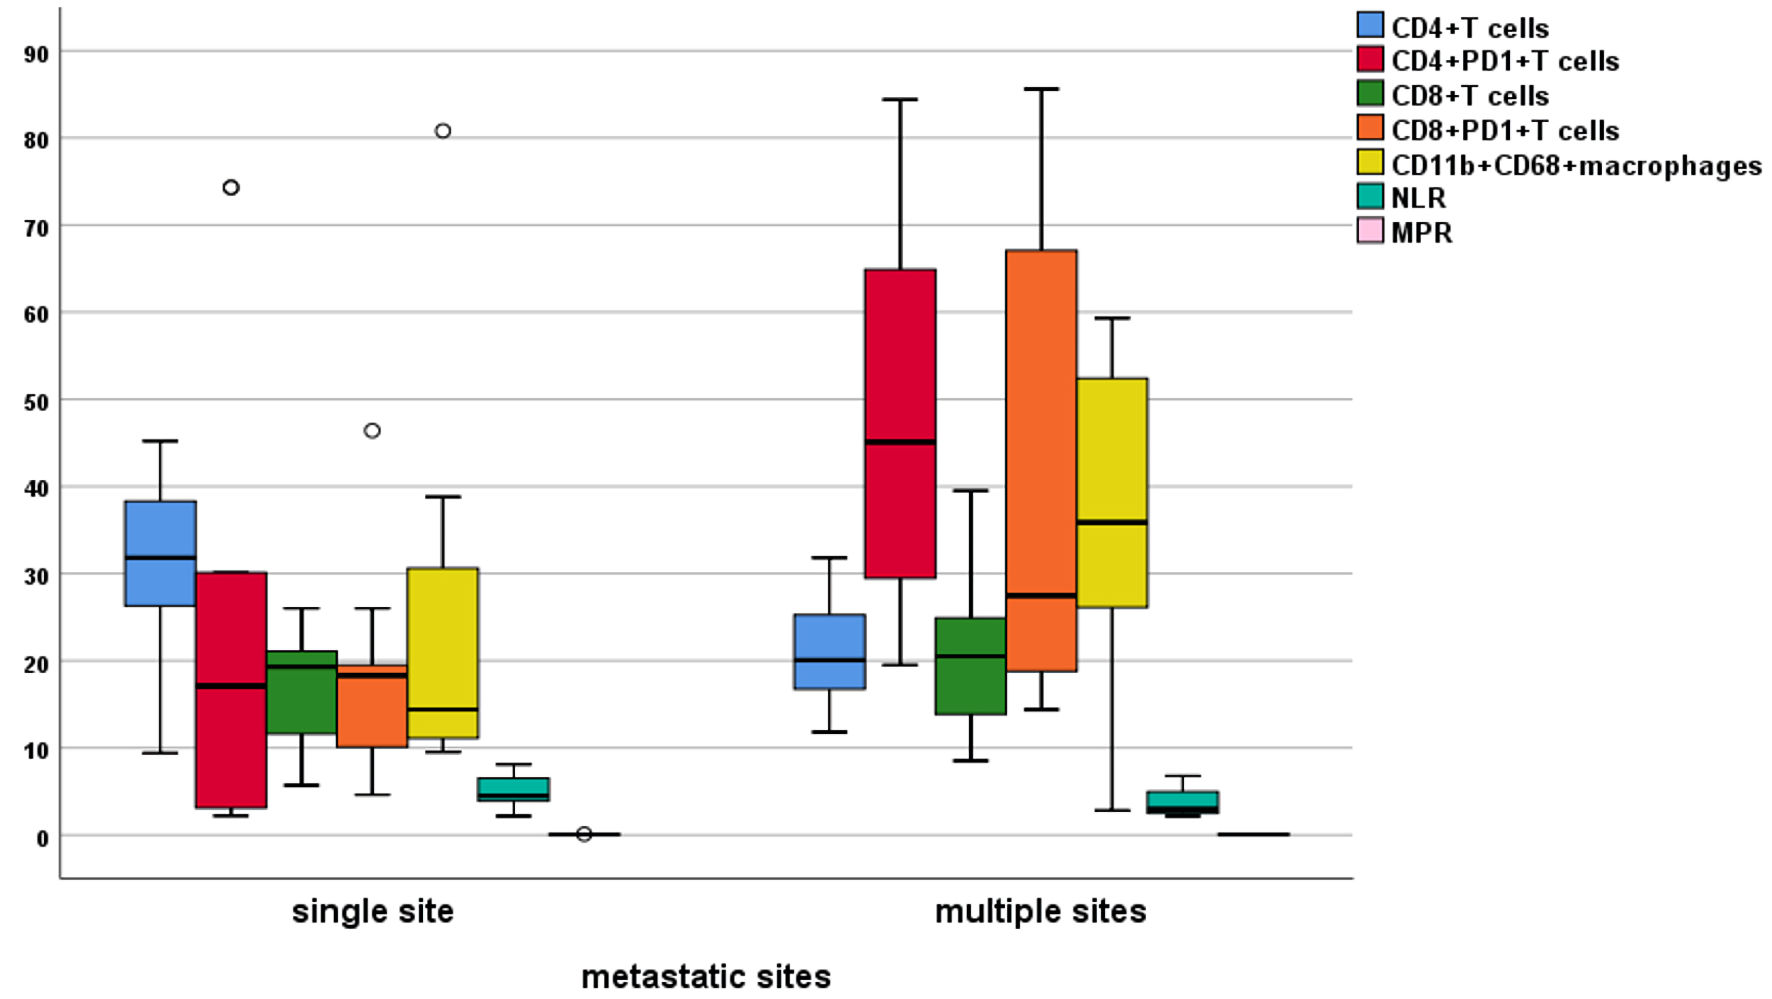
↓ Figure 4. Differential expression of immune
cells between single and multiple sites of metastasis (Mann-Whitney test). PD-1: programmed cell death
protein 1; NLR: neutrophil to lymphocyte ratio; MPR: mean platelet volume/platelet count ratio.
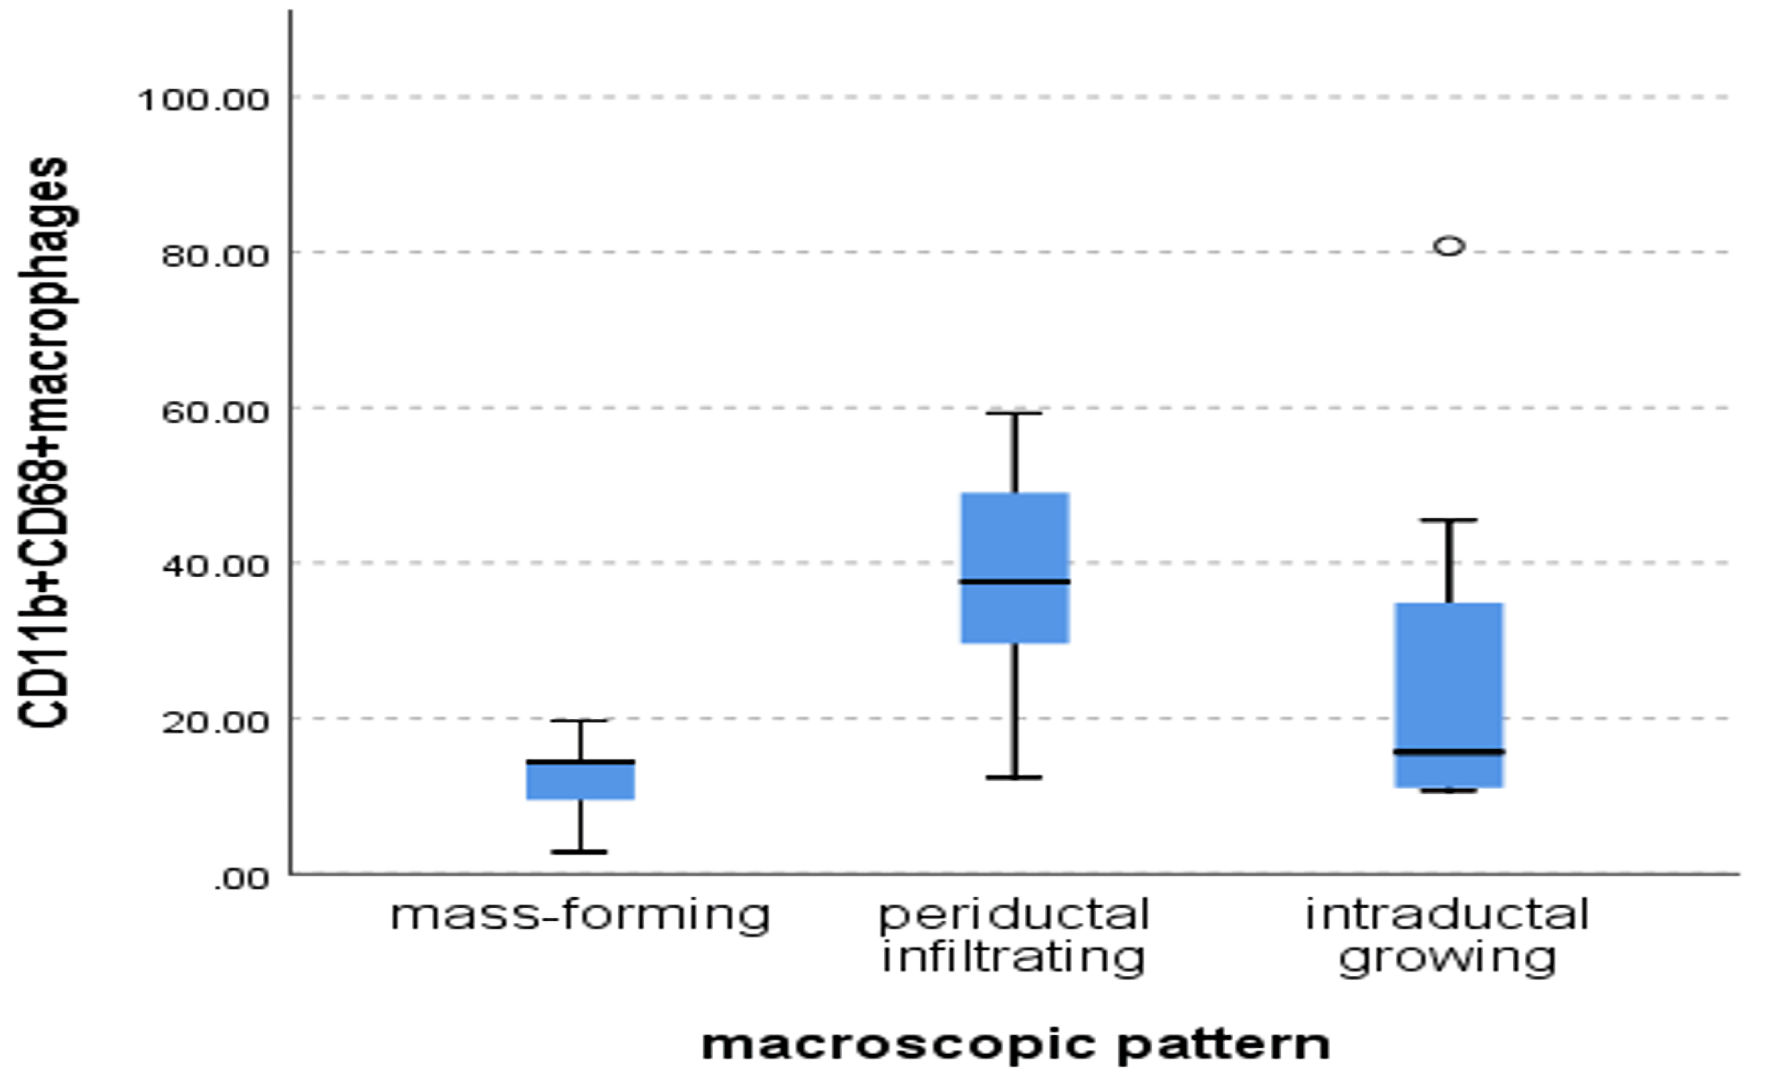
↓ Figure 5. Differential expression of
CD11bCD68+ macrophages according to the macroscopic pattern (Kruskal Wallis test, P =
0.037).
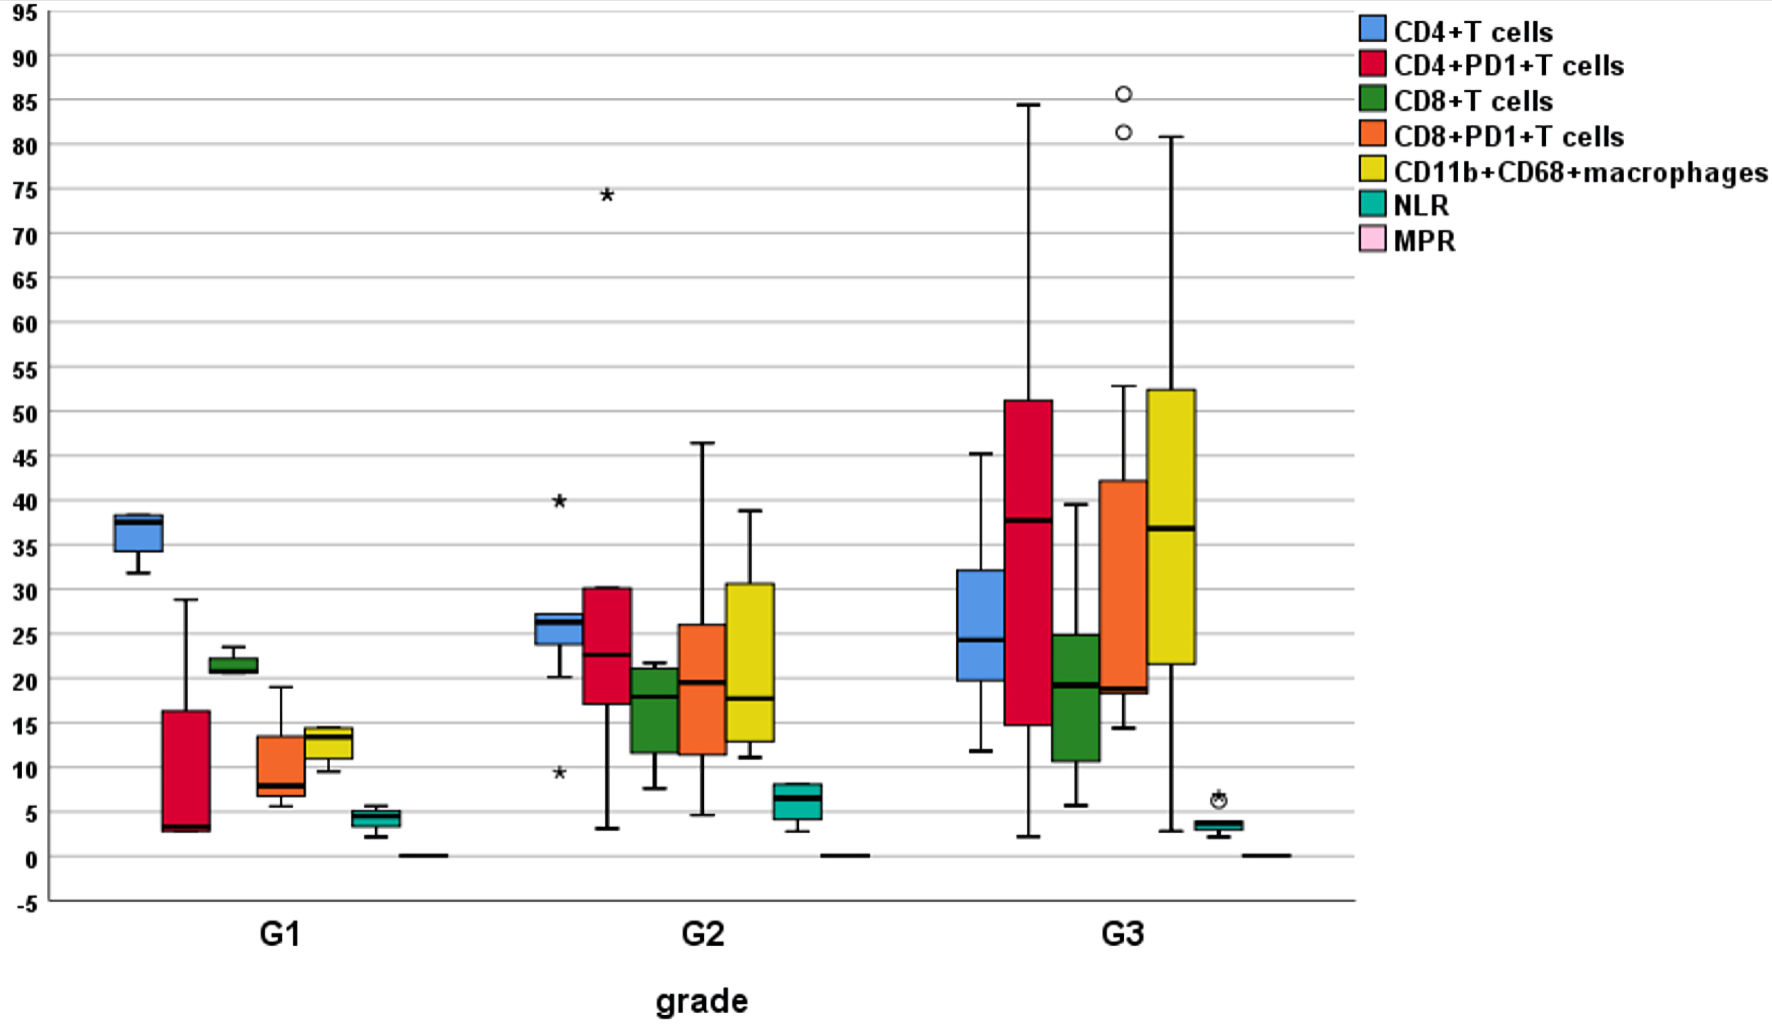
↓ Figure 6. Differential accumulation of immune
cells according to grading. PD-1: programmed cell death protein 1; NLR: neutrophil to lymphocyte ratio;
MPR: mean platelet volume/platelet count ratio.
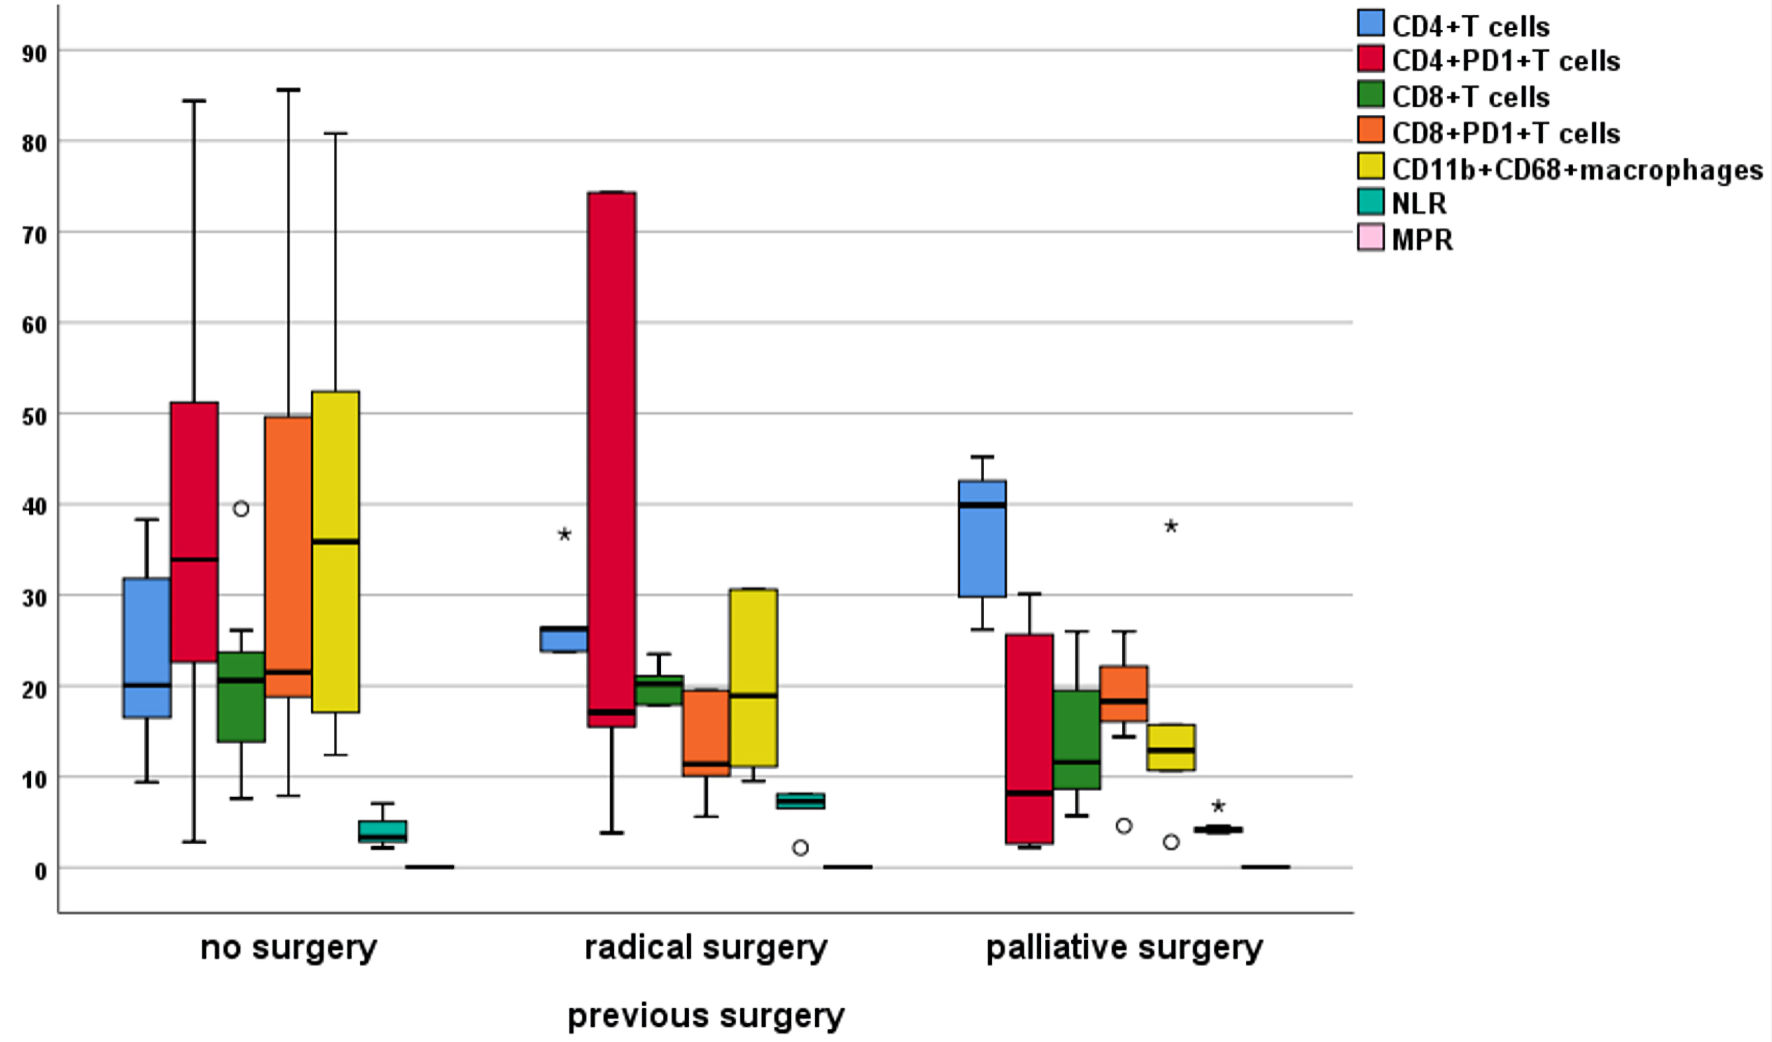
↓ Figure 7. Differential expression of immune
cells according to previous surgery. PD-1: programmed cell death protein 1; NLR: neutrophil to
lymphocyte ratio; MPR: mean platelet volume/platelet count ratio.
Tables
↓ Table 1. Demographic Data of Patients
|
Demographic data |
Descriptive |
| Data are expressed as mean, median, SD, number, and percentages, as well as ECOG.
ECOG-PS: Eastern Cooperative Oncology Group-performance status; SD: standard deviation; Min:
minimum; Max: maximum; BMI: body mass index; DM: diabetes mellitus; HTN: hypertension. |
| Age (median) |
59 years |
| Mean ± SD |
56.6 ± 10.8 years |
| Min -Max |
34 - 77 years |
| Sex (male/female) |
13/12 (1.1/1) |
| ECOG-PS |
|
| PS = 0 |
9 (36%) |
| PS = 1 - 2 |
16 (64%) |
| BMI |
|
| Underweight |
9 (36%) |
| Normal weight |
6 (24%) |
| Overweight |
10 (40%) |
| Smoking |
|
| None |
12 (48%) |
| Smoker |
4 (16%) |
| Ex-smoker |
9 (36%) |
| Comorbidities |
|
| None |
2 (8%) |
| Diabetic |
6 (24%) |
| Hypertensive |
11 (44%) |
| Both DM and HTN |
6 (24%) |
↓ Table 2. Clinicopathologic Characteristics
|
Characteristics |
Descriptive |
| Data are expressed as numbers and percentages. CCA: cholangiocarcinoma; iCCA:
intrahepatic CCA; pCCA: perihilar CCA; dCCA: distal CCA. |
| Primary site |
|
| dCCA |
10 (40%) |
| pCCA |
10 (40%) |
| iCCA |
5 (20%) |
| Sites of metastasis |
|
| Single site |
17 (68%) |
| Multiple sites |
8 (32%) |
| Macroscopic pattern |
|
| Mass-forming |
5 (20%) |
| Periductal-infiltrating |
7 (28%) |
| Intraductal-growing |
13 (52%) |
| Grading of CCA |
|
| G1 |
4 (16%) |
| G2 |
10 (40%) |
| G3 |
11 (44%) |
| Previous surgery |
|
| No surgery |
12 (48%) |
| Radical surgery |
6 (24%) |
| Palliative surgery |
7 (28%) |
| Response |
|
| Complete response |
9 (36%) |
| Partial response |
5 (20%) |
| Stable disease |
7 (28%) |
| Progressive disease |
4 (16%) |
| Outcome |
|
| Dead |
10 (40%) |
| Alive |
15 (60%) |
↓ Table 3. Comparison Between Patients and Controls Regarding Hematologic
Indices
|
Index |
Groups |
Mean
± SD |
P
value |
| Data are expressed as mean ± SD and analyzed by Mann-Whitney test. SD: standard
deviation; RBCs: red blood cells; Hb: hemoglobin; WBCs: white blood cells; NLR: neutrophil to
lymphocyte ratio; MPV: mean platelet volume; MPR: mean platelet volume/platelet count ratio. |
| RBC |
Patients |
4.2 ± 0.43 |
0.012 |
|
Healthy controls |
4.8 ± 1.0 |
|
| Hb |
Patients |
11.7 ± 1.2 |
0.038 |
|
Healthy controls |
13.01 ± 2.3 |
|
| WBCs |
Patients |
6.85 ± 3.7 |
0.012 |
|
Healthy controls |
10.15 ± 4.7 |
|
| Neutrophils, % |
Patients |
75.37 ± 8.9 |
0.6 |
|
Healthy controls |
77.14 ± 15.4 |
|
| Lymphocytes, % |
Patients |
17.97 ± 5.6 |
0.4 |
|
Healthy controls |
15.27 ± 11.8 |
|
| Monocytes, % |
Patients |
4.99 ± 3.4 |
0.05 |
|
Healthy controls |
7.84 ± 6.0 |
|
| Platelet count |
Patients |
181.44 ± 44.8 |
< 0.001 |
|
Healthy controls |
278.1 ± 114.5 |
|
| MPV |
Patients |
9.64 ± 1.2 |
0.001 |
|
Healthy controls |
10.89 ± 1.1 |
|
| NLR |
Patients |
4.7 ± 1.9 |
0.012 |
|
Healthy controls |
8.5 ± 5.7 |
|
| MPR |
Patients |
0.057 ± 0.02 |
0.8 |
|
Healthy controls |
0.059 ± 0.07 |
|
↓ Table 4. Correlations Between Survival and PD-1 Expression and
Macrophages
| Variable |
PFS
|
CD4+ |
CD4+PD-1+ |
CD8+ |
CD8+PD-1+ |
CD11b+CD68+ |
NLR
|
MPR
|
| aSignificant. Spearman rho correlation, r: correlation coefficient. PFS:
progression-free survival; PD-1: programmed cell death protein 1; NLR: neutrophil to lymphocyte
ratio; MPR: mean platelet volume/platelet count ratio; M: macrophages. |
| PFS |
r |
1 |
0.472a |
-0.262 |
0.088 |
-0.428a |
-0.213 |
-0.48a |
0.133 |
|
P |
|
0.017 |
0.205 |
0.677 |
0.033 |
0.308 |
0.015 |
0.526 |
| CD4+ |
r |
0.472a |
1 |
-0.593 |
-0.084 |
-0.280 |
-0.569 |
-0.2 |
-0.11 |
|
P |
0.017 |
|
0.002 |
0.689 |
0.175 |
0.003 |
0.453 |
0.587 |
| CD4+PD-1+ |
r |
-0.262 |
-0.593 |
1 |
0.152 |
0.544 |
0.300 |
0.030 |
-0.1 |
|
P |
0.205 |
0.002 |
|
0.468 |
0.005 |
0.146 |
0.888 |
0.646 |
| CD8+ T cells |
r |
0.088 |
-0.084 |
0.152 |
1 |
0.241 |
0.246 |
-0.15 |
-0.32 |
|
P |
0.677 |
0.689 |
0.468 |
|
0.246 |
0.236 |
0.462 |
0.116 |
| CD8+PD-1+ |
r |
-0.43a |
-0.280 |
0.544 |
0.241 |
1 |
0.29 |
-0.15 |
-0.26 |
|
P |
0.033 |
0.175 |
0.005 |
0.246 |
|
0.163 |
0.475 |
0.206 |
| CD11b+CD68+ M |
r |
-0.213 |
-0.569 |
0.300 |
0.246 |
0.288 |
1 |
-0.3 |
0.258 |
|
P |
0.308 |
0.003 |
0.146 |
0.236 |
0.163 |
|
0.199 |
0.212 |
| NLR |
r |
-0.5a |
-0.157 |
0.030 |
-0.154 |
-0.150 |
-0.27 |
1 |
-0.3 |
|
P |
0.015 |
0.453 |
0.888 |
0.462 |
0.475 |
0.199 |
|
0.191 |
| MPR |
r |
0.133 |
-0.114 |
-0.097 |
-0.322 |
-0.262 |
0.258 |
-0.27 |
1 |
|
P |
0.526 |
0.587 |
0.646 |
0.116 |
0.206 |
0.212 |
0.191 |
|
↓ Table 5. Disturbance of Immune Cells According to Responses to
Treatment
| Immune cells |
Complete response |
Partial response |
Stable disease |
Progressive disease |
P
value |
| Data are expressed as mean ± SD and analyzed by Robust test. NLR: neutrophil to
lymphocyte ratio; MPR: mean platelet volume/platelet count ratio; M: macrophages; SD: standard
deviation; PD-1: programmed cell death protein 1. |
| CD4+ T cells |
Mean ± SD |
38.1 ± 5.8 |
25.3 ± 4.5 |
21.7 ± 4.9 |
19.33 ± 10.6 |
0.001 |
| CD4+PD-1+ |
Mean ± SD |
11.77 ±13.4 |
39.5 ± 32.2 |
32.47 ± 16.8 |
55.1 ± 27.9 |
0.04 |
| CD8+ T cells |
Mean ± SD |
15.77 ± 7.1 |
18.8 ± 4.2 |
19.5 ± 5.2 |
21.5 ± 14.3 |
0.7 |
| CD8+PD-1+ |
Mean ± SD |
14.8 ± 8.5 |
18.9 ± 3.3 |
17.37 ± 7.4 |
66.53 ± 19.8 |
0.008 |
| CD11b+CD68+ M |
Mean ± SD |
12.9 ± 2.3 |
16.5 ± 13.2 |
45.69 ± 20.8 |
39.0 ± 4.6 |
< 0.001 |
| NLR |
Mean ± SD |
4.2 ± 0.9 |
5.3 ± 1.8 |
4.93 ± 3.0 |
5.0 ± 1.9 |
0.6 |
| MPR |
Mean ± SD |
0.06 ± 0.01 |
0.05 ± 0.02 |
0.06 ± 0.02 |
0.05 ± 0.03 |
0.7 |
↓ Table 6. Differential Expression of Immune Cells According to
Grading
| Variable |
G1
|
G2
|
G3
|
P
value |
| Data are expressed as mean ± SD and analyzed by Robust test. M: macrophages; NLR:
neutrophil to lymphocyte ratio; MPR: mean platelet volume/platelet count ratio; SD: standard
deviation; PD-1: programmed cell death protein 1. |
| CD4+ T cells |
Mean ± SD |
36.3 ± 3.1 |
26.3 ± 8.9 |
26.4 ± 11.3 |
0.009 |
| CD4+PD-1+T cells |
Mean ± SD |
9.6 ± 12.8 |
30.7 ± 24.3 |
36.91 ± 27.6 |
0.049 |
| CD8+ T cells |
Mean ± SD |
21.4 ± 1.4 |
16.5 ± 4.8 |
18.9 ± 10.3 |
0.036 |
| CD8+PD-1+ T cells |
Mean ± SD |
10.1 ± 6.03 |
19.8 ± 11.9 |
34.3 ± 26.6 |
0.027 |
| CD11b+CD68+ M |
Mean ± SD |
12.7 ± 2.3 |
21.3 ± 9.7 |
37.4 ± 23.6 |
0.004 |
| NLR |
Mean ± SD |
4.2 ± 1.5 |
6.0 ± 1.9 |
3.8 ± 1.5 |
0.06 |
| MPR |
Mean ± SD |
0.06 ± 0.01 |
0.053 ± 0.01 |
0.059 ± 0.02 |
0.4 |
↓ Table 7. Disturbances of Immune Cells According to Previous
Surgery
|
Variable (mean ± SD) |
No
surgery |
Radical surgery |
Palliative surgery |
P
value |
| Data are expressed as mean ± SD and analyzed by Kruskal Wallis testa,
and Robust test. PD-1: programmed cell death protein 1; M: macrophages; NLR: neutrophil to
lymphocyte ratio; MPR: mean platelet volume/platelet count ratio; SD: standard deviation. |
| CD4+ T cells |
23.2 ± 9.8 |
27.2 ± 4.8 |
36.6 ± 8.0 |
0.01 |
| CD4+PD-1+ T cells |
37.7 ± 25.1 |
33.7 ± 31.9 |
13.9 ± 12.9 |
0.1 |
| CD8+ T cells |
19.8 ± 8.6 |
20.1 ±2.2 |
14.2 ± 7.8 |
0.2 |
| CD8+PD-1+ T cellsa |
34.4 ± 26.6 |
12.92 ± 5.6 |
17.9 ± 7.3 |
0.045 |
| CD11b+CD68+ M |
37.4 ± 21.2 |
19.9 ± 10.4 |
15.2 ± 10.8 |
0.022 |
| NLR |
3.97 ± 1.6 |
6.6 ± 2.3 |
4.5 ± 1.04 |
0.016 |
| MPR |
0.059 ± 0.02 |
0.05 ± 0.01 |
0.06 ± 0.01 |
0.3 |
↓ Table 8. Multivariate Analysis of Prognostic Factors of PFS
| Variable |
B |
Wald |
P value |
HR |
95.0% CI for HR |
|
Lower |
Upper |
| Data were analyzed using Cox regression using forward stepwise methods (likelihood
ratio), HR = eB. HR: hazard ratio; CI: confidence interval; NLR: neutrophil to lymphocyte
ratio; PFS: progression-free survival. |
| Step 1 |
NLR |
0.440 |
7.699 |
0.006 |
1.553 |
1.138 |
2.119 |
| Step 2 |
Response |
|
11.773 |
0.008 |
|
|
|
|
Complete response |
-3.144 |
10.762 |
0.001 |
0.043 |
0.007 |
0.282 |
|
Partial response |
-2.540 |
6.710 |
0.010 |
0.079 |
0.012 |
0.539 |
|
Stable disease |
-1.806 |
3.917 |
0.048 |
0.164 |
0.027 |
0.983 |
|
Progressive disease |
Reference |
|
NLR |
0.556 |
7.945 |
0.005 |
1.743 |
1.184 |
2.565 |