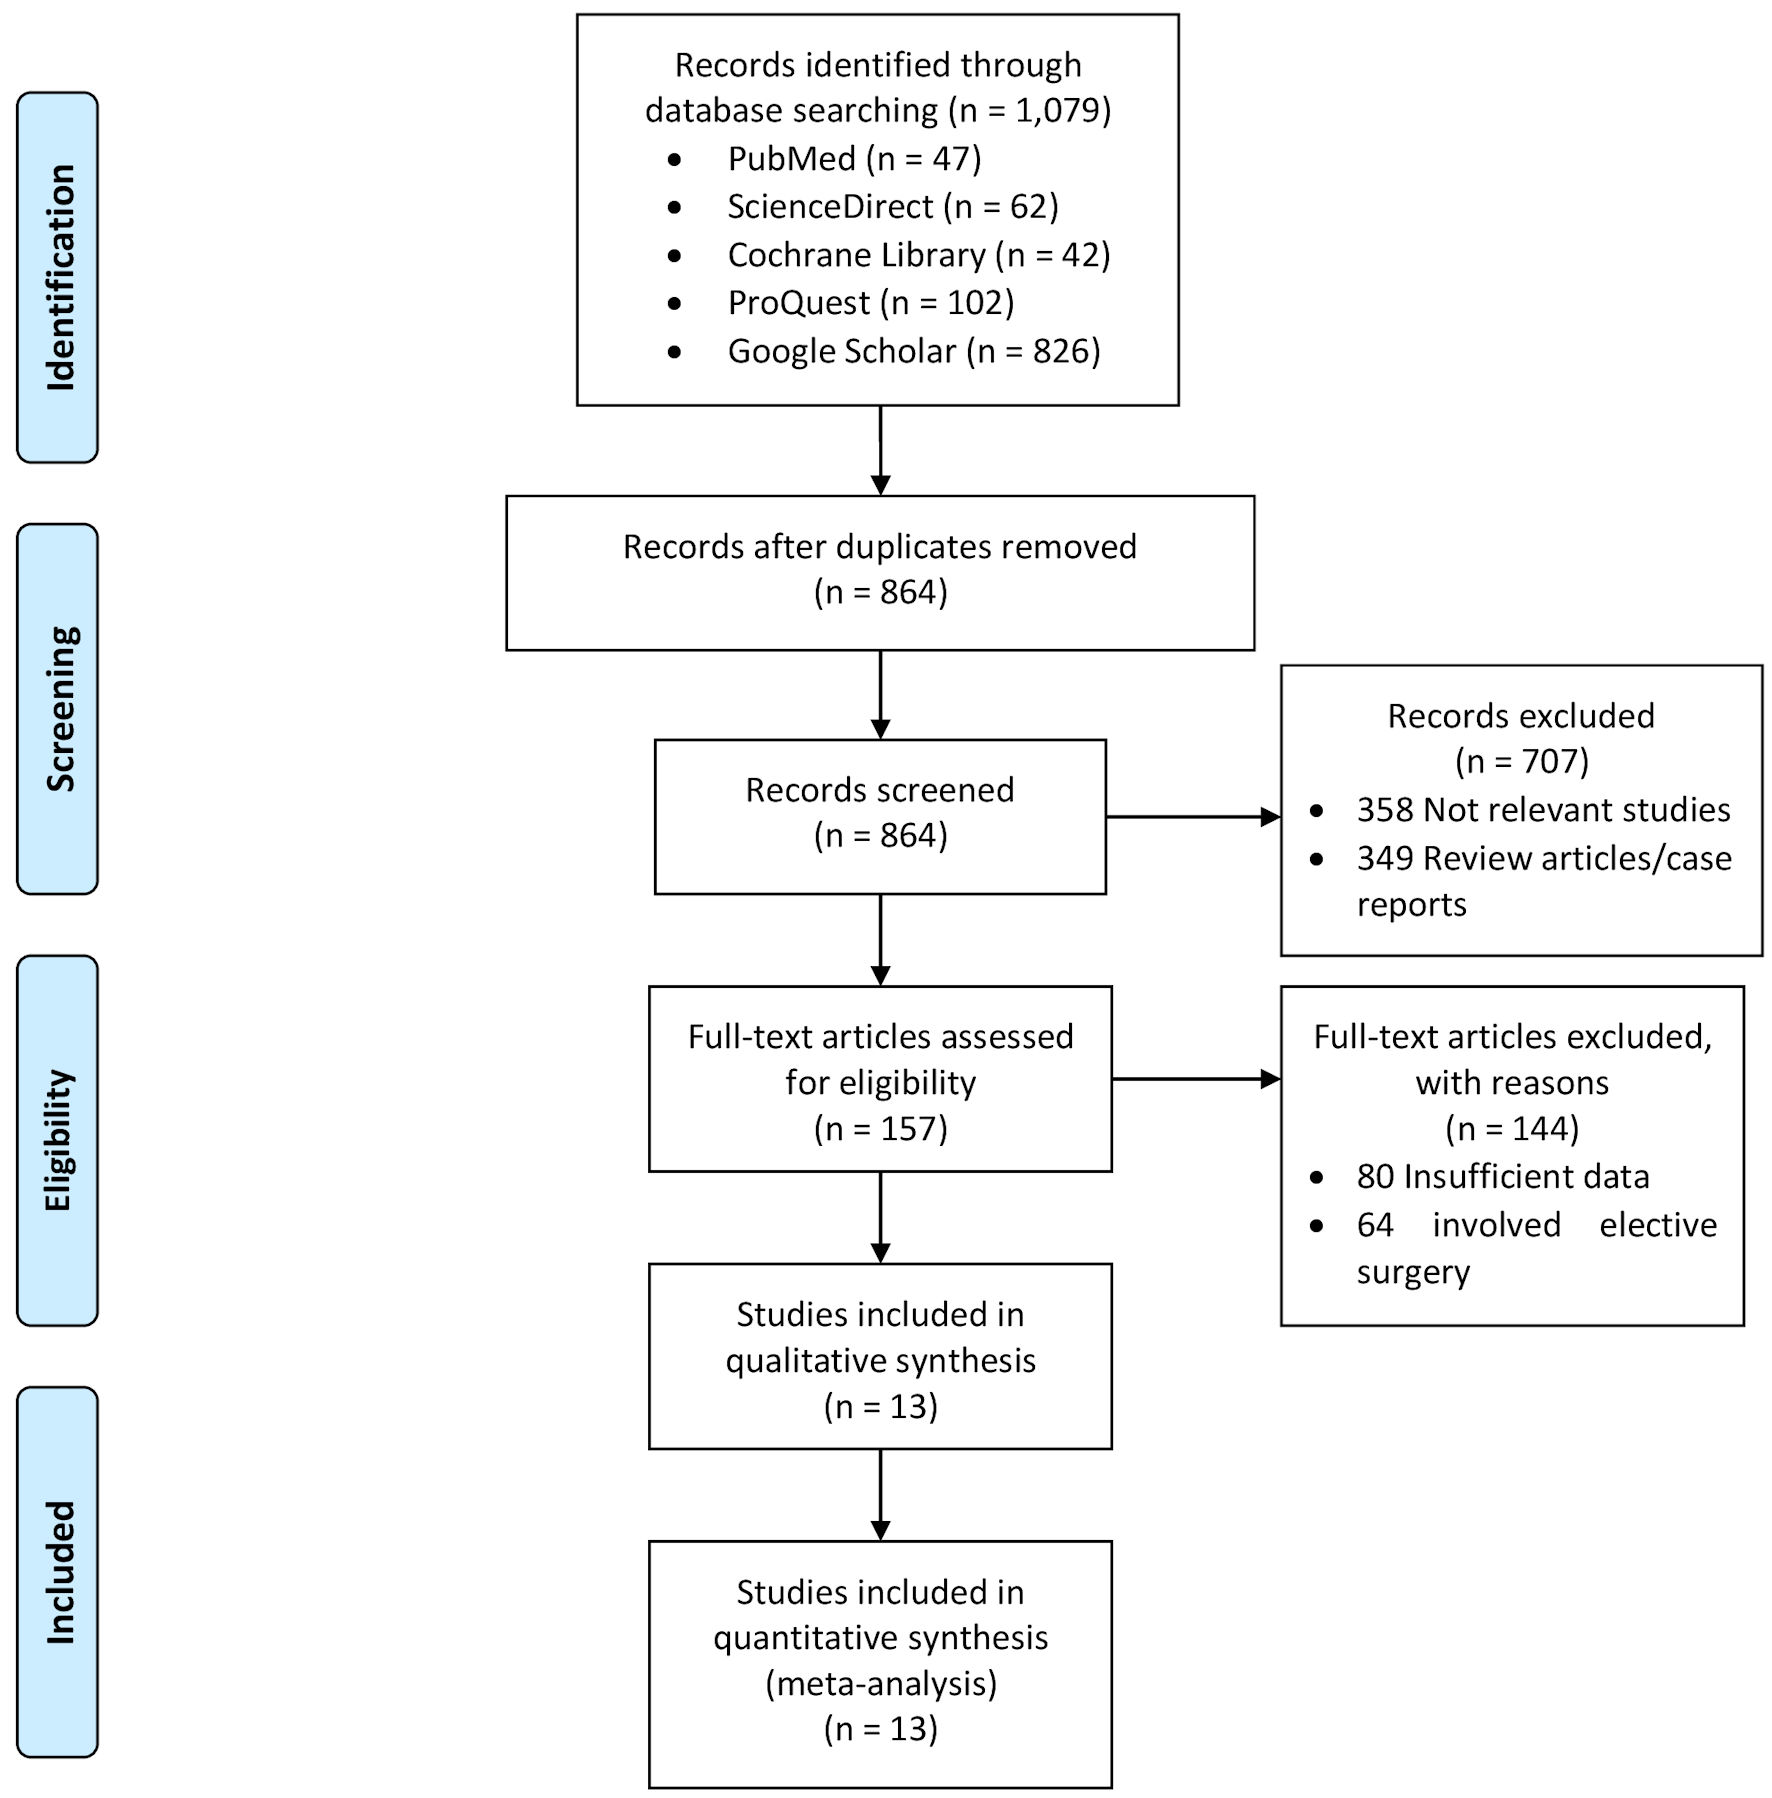
↓ Figure 1. Literature search flow chart.
| Journal of Clinical Medicine Research, ISSN 1918-3003 print, 1918-3011 online, Open Access |
| Article copyright, the authors; Journal compilation copyright, J Clin Med Res and Elmer Press Inc |
| Journal website https://jocmr.elmerjournals.com |
Original Article
Volume 16, Number 7-8, August 2024, pages 345-354
Effect of Comorbidities on the Incidence of Surgical Site Infection in Patients Undergoing Emergency Surgery: A Systematic Review and Meta-Analysis
Figures
Tables
| First author, year | Country | Design | Patients’ characteristics | Sample size | Mean age (years) | Male, n (%) | Incidence of SSI, n (%) |
|---|---|---|---|---|---|---|---|
| PC: prospective cohort; RC: retrospective cohort; SSI: surgical site infection; NR: not reported. | |||||||
| El-Kholy et al, 2018 [15] | Egypt | PC | Patients underwent emergency general surgery | 99 | 43 | 67 (68) | 33 (6.7) |
| Fernandez-Moure et al, 2021 [16] | USA | RC | Patients underwent emergency exploratory laparotomy | 4,738 | 50 | NR | 632 (15.2) |
| Isbell et al, 2021 [17] | USA | RC | Patients underwent emergency trauma laparotomy | 1,322 | 33 | 1,032 (78) | 88 (7) |
| Khan et al, 2022 [18] | Bangladesh | PC | Patients underwent emergency abdominal surgery | 112 | 37 | 85 (76) | 17 (15.2) |
| Li et al, 2021 [19] | China | PC | Patients underwent emergency abdominal surgery | 953 | 49 | 534 (56) | 71 (7.5) |
| Mathew et al, 2015 [20] | India | PC | Patients underwent emergency general surgery | 132 | 35 | 97 (73) | 33 (25) |
| Narueponjirakul et al, 2021 [21] | USA | RC | Patients underwent emergency colon surgery | 236 | 67 | 101 (43) | 61 (25.8) |
| Pandey et al, 2016 [22] | India | PC | Patients underwent emergency general surgery | 108 | 46 | 81 (75) | 18 (16.7) |
| Papadopoulos et al, 2021 [23] | Greece | PC | Patients underwent emergency general surgery | 838 | 51 | 470 (56) | 157 (18.7) |
| Watanabe et al, 2014 [24] | Japan | RC | Patients underwent emergency colorectal surgery | 78 | 61 | 45 (58) | 25 (32.1) |
| Yang et al, 2015 [25] | China | RC | Patients underwent emergency hernia surgery | 121 | 68 | 100 (83) | 9 (7.4) |
| Feng et al, 2022 [26] | China | RC | Patients underwent emergency ileus surgery | 125 | 62 | 67 (54) | 37 (29.6) |
| Yadav et al, 2023 [27] | Nepal | PC | Patients underwent emergency abdominal surgery | 90 | 43 | 62 (69) | 29 (32.2) |
| First author, year | Selection | Comparability | Outcome | Total score |
|---|---|---|---|---|
| El-Kholy et al, 2018 [15] | 3 | 2 | 2 | 7 |
| Fernandez-Moure et al, 2021 [16] | 4 | 2 | 3 | 9 |
| Isbell et al, 2021 [17] | 4 | 2 | 3 | 9 |
| Khan et al, 2022 [18] | 4 | 2 | 3 | 9 |
| Li et al, 2021 [19] | 4 | 2 | 3 | 9 |
| Mathew et al, 2015 [20] | 4 | 2 | 2 | 8 |
| Narueponjirakul et al, 2021 [21] | 3 | 2 | 3 | 8 |
| Pandey et al, 2016 [22] | 3 | 2 | 2 | 7 |
| Papadopoulos et al, 2021 [23] | 4 | 2 | 3 | 9 |
| Watanabe et al, 2014 [24] | 4 | 2 | 3 | 9 |
| Yang et al, 2015 [25] | 3 | 2 | 3 | 8 |
| Feng et al, 2022 [26] | 4 | 2 | 3 | 9 |
| Yadav et al, 2023 [27] | 4 | 2 | 2 | 8 |
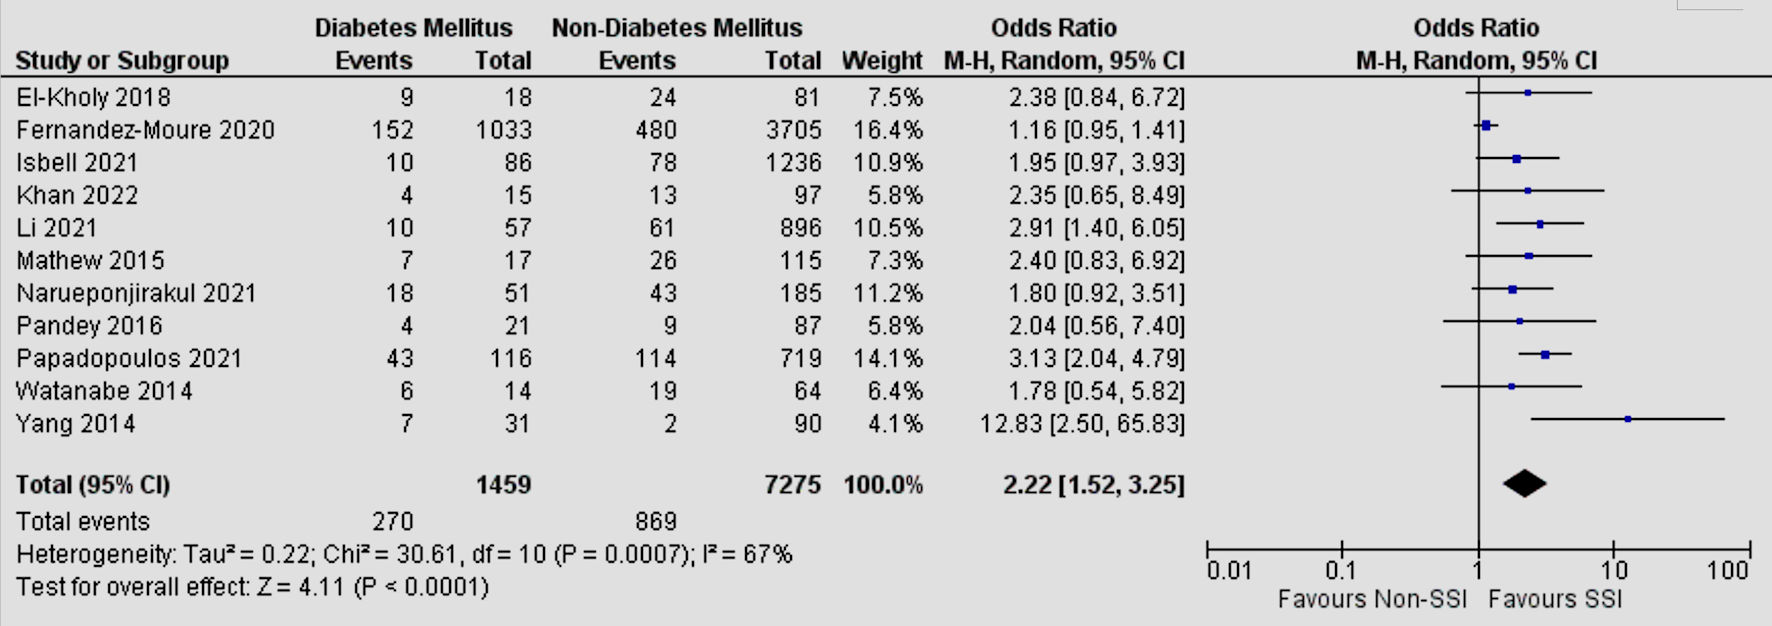
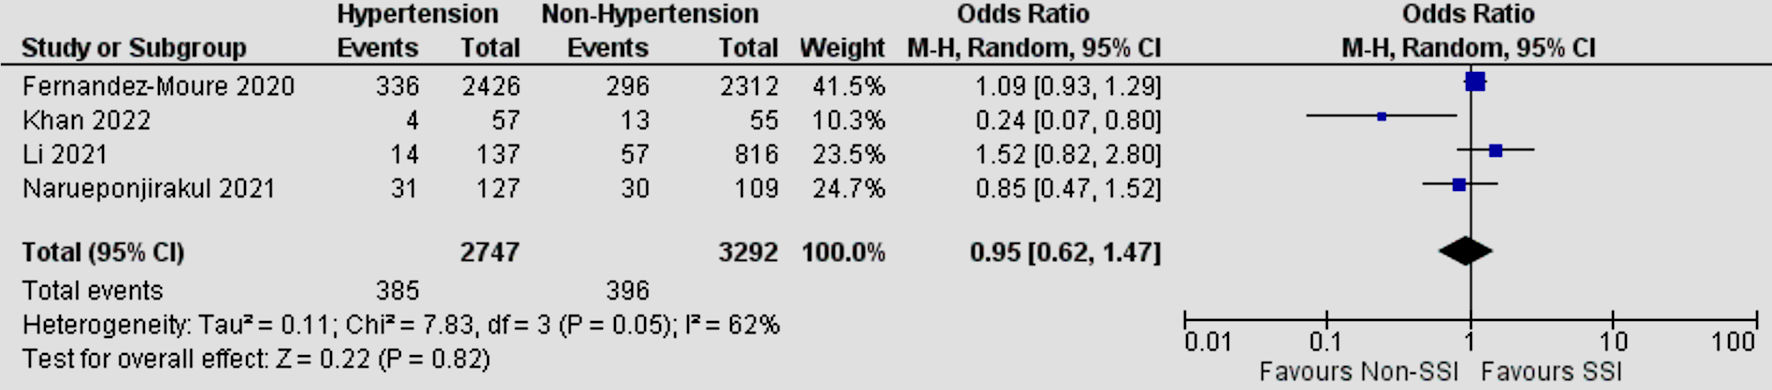
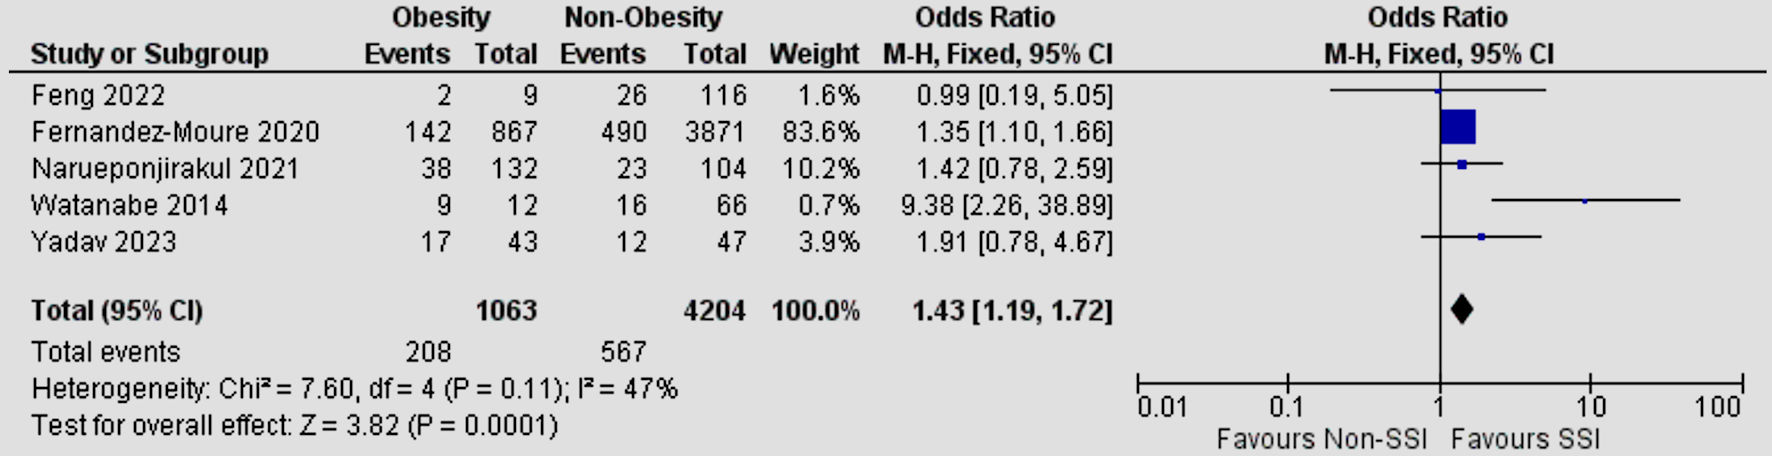
| Risk factor | Studies | I2 (%) | OR | 95% CI | P value |
|---|---|---|---|---|---|
| SSI: surgical site infection; OR: odds ratio; CI: confidence interval. | |||||
| Diabetes mellitus | 11 | 67 | 2.22 | 1.52 - 3.25 | < 0.0001 |
| Hypertension | 4 | 62 | 0.95 | 0.62 - 1.47 | 0.82 |
| Obesity | 5 | 47 | 1.43 | 1.19 - 1.72 | 0.0001 |
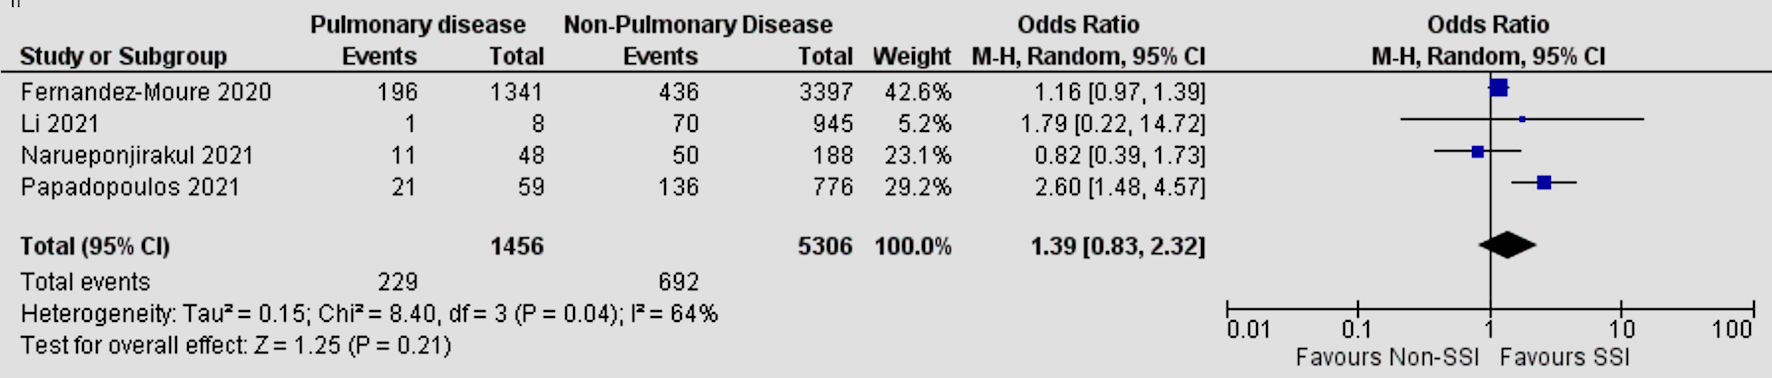
| Pulmonary disease | 4 | 64 | 1.39 | 0.83 - 2.32 | 0.21 |
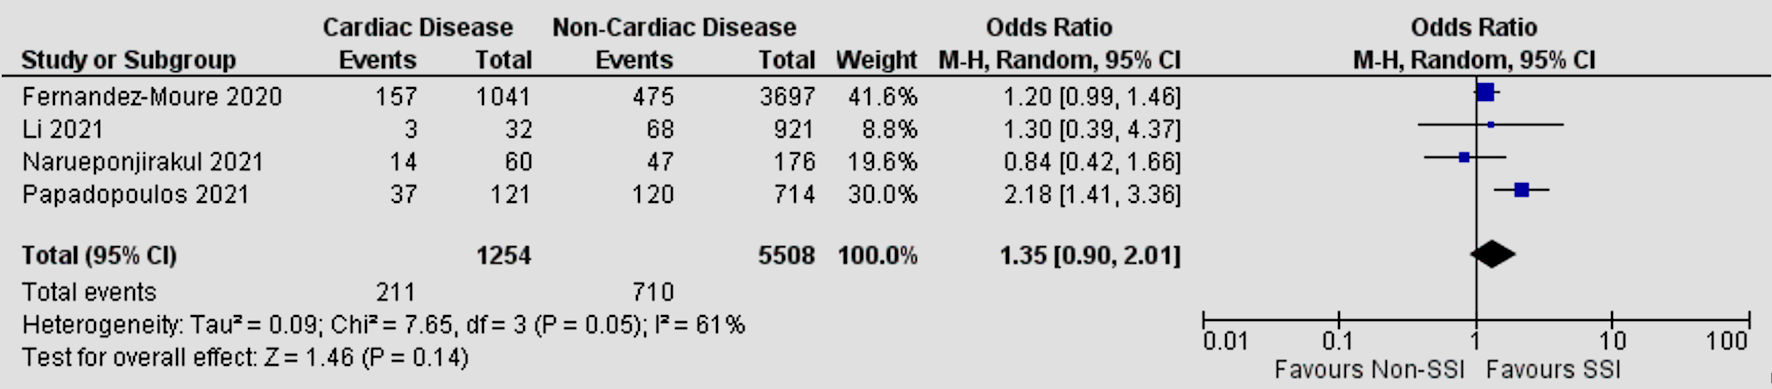
| Cardiac disease | 4 | 61 | 1.35 | 0.90 - 2.01 | 0.14 |
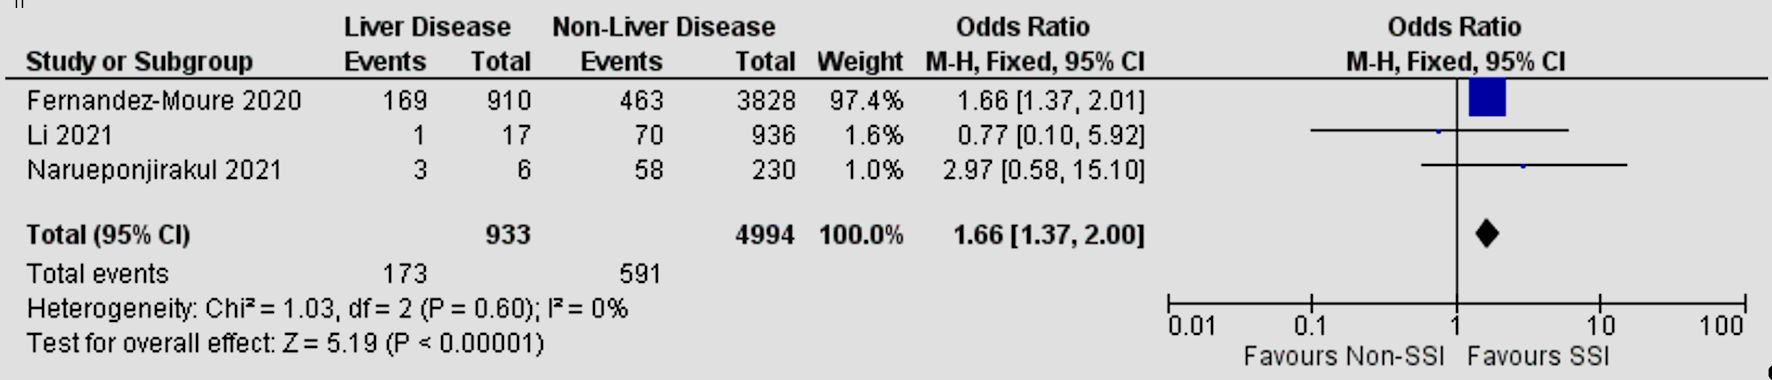
| Liver disease | 3 | 0 | 1.66 | 1.37 - 2.00 | < 0.00001 |
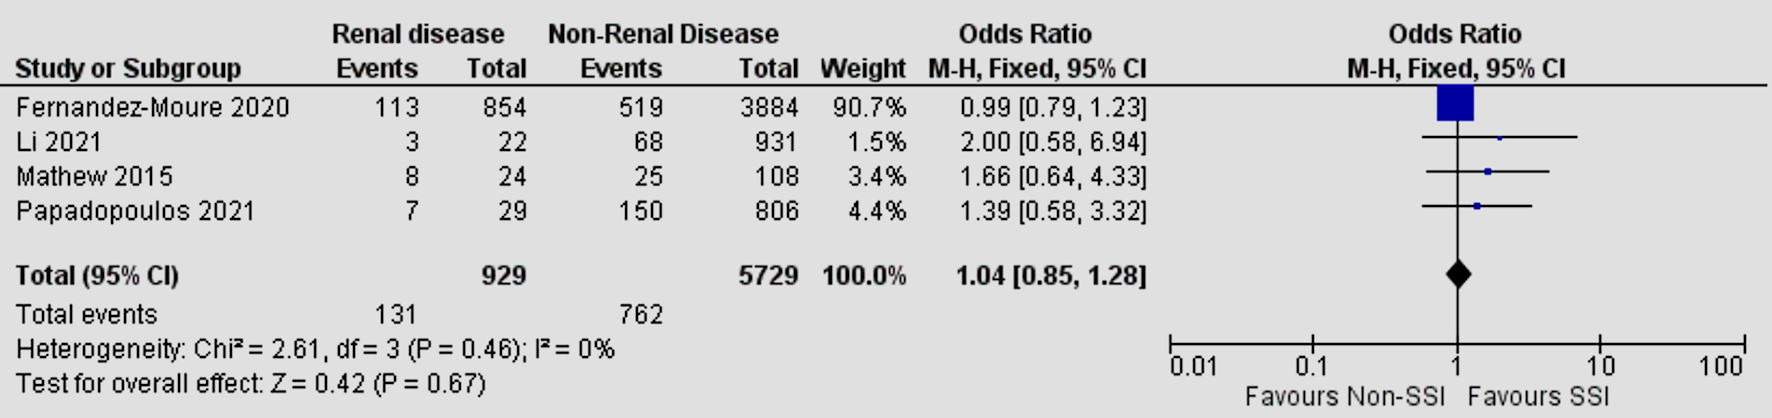
| Renal disease | 4 | 0 | 1.04 | 0.85 - 1.28 | 0.67 |