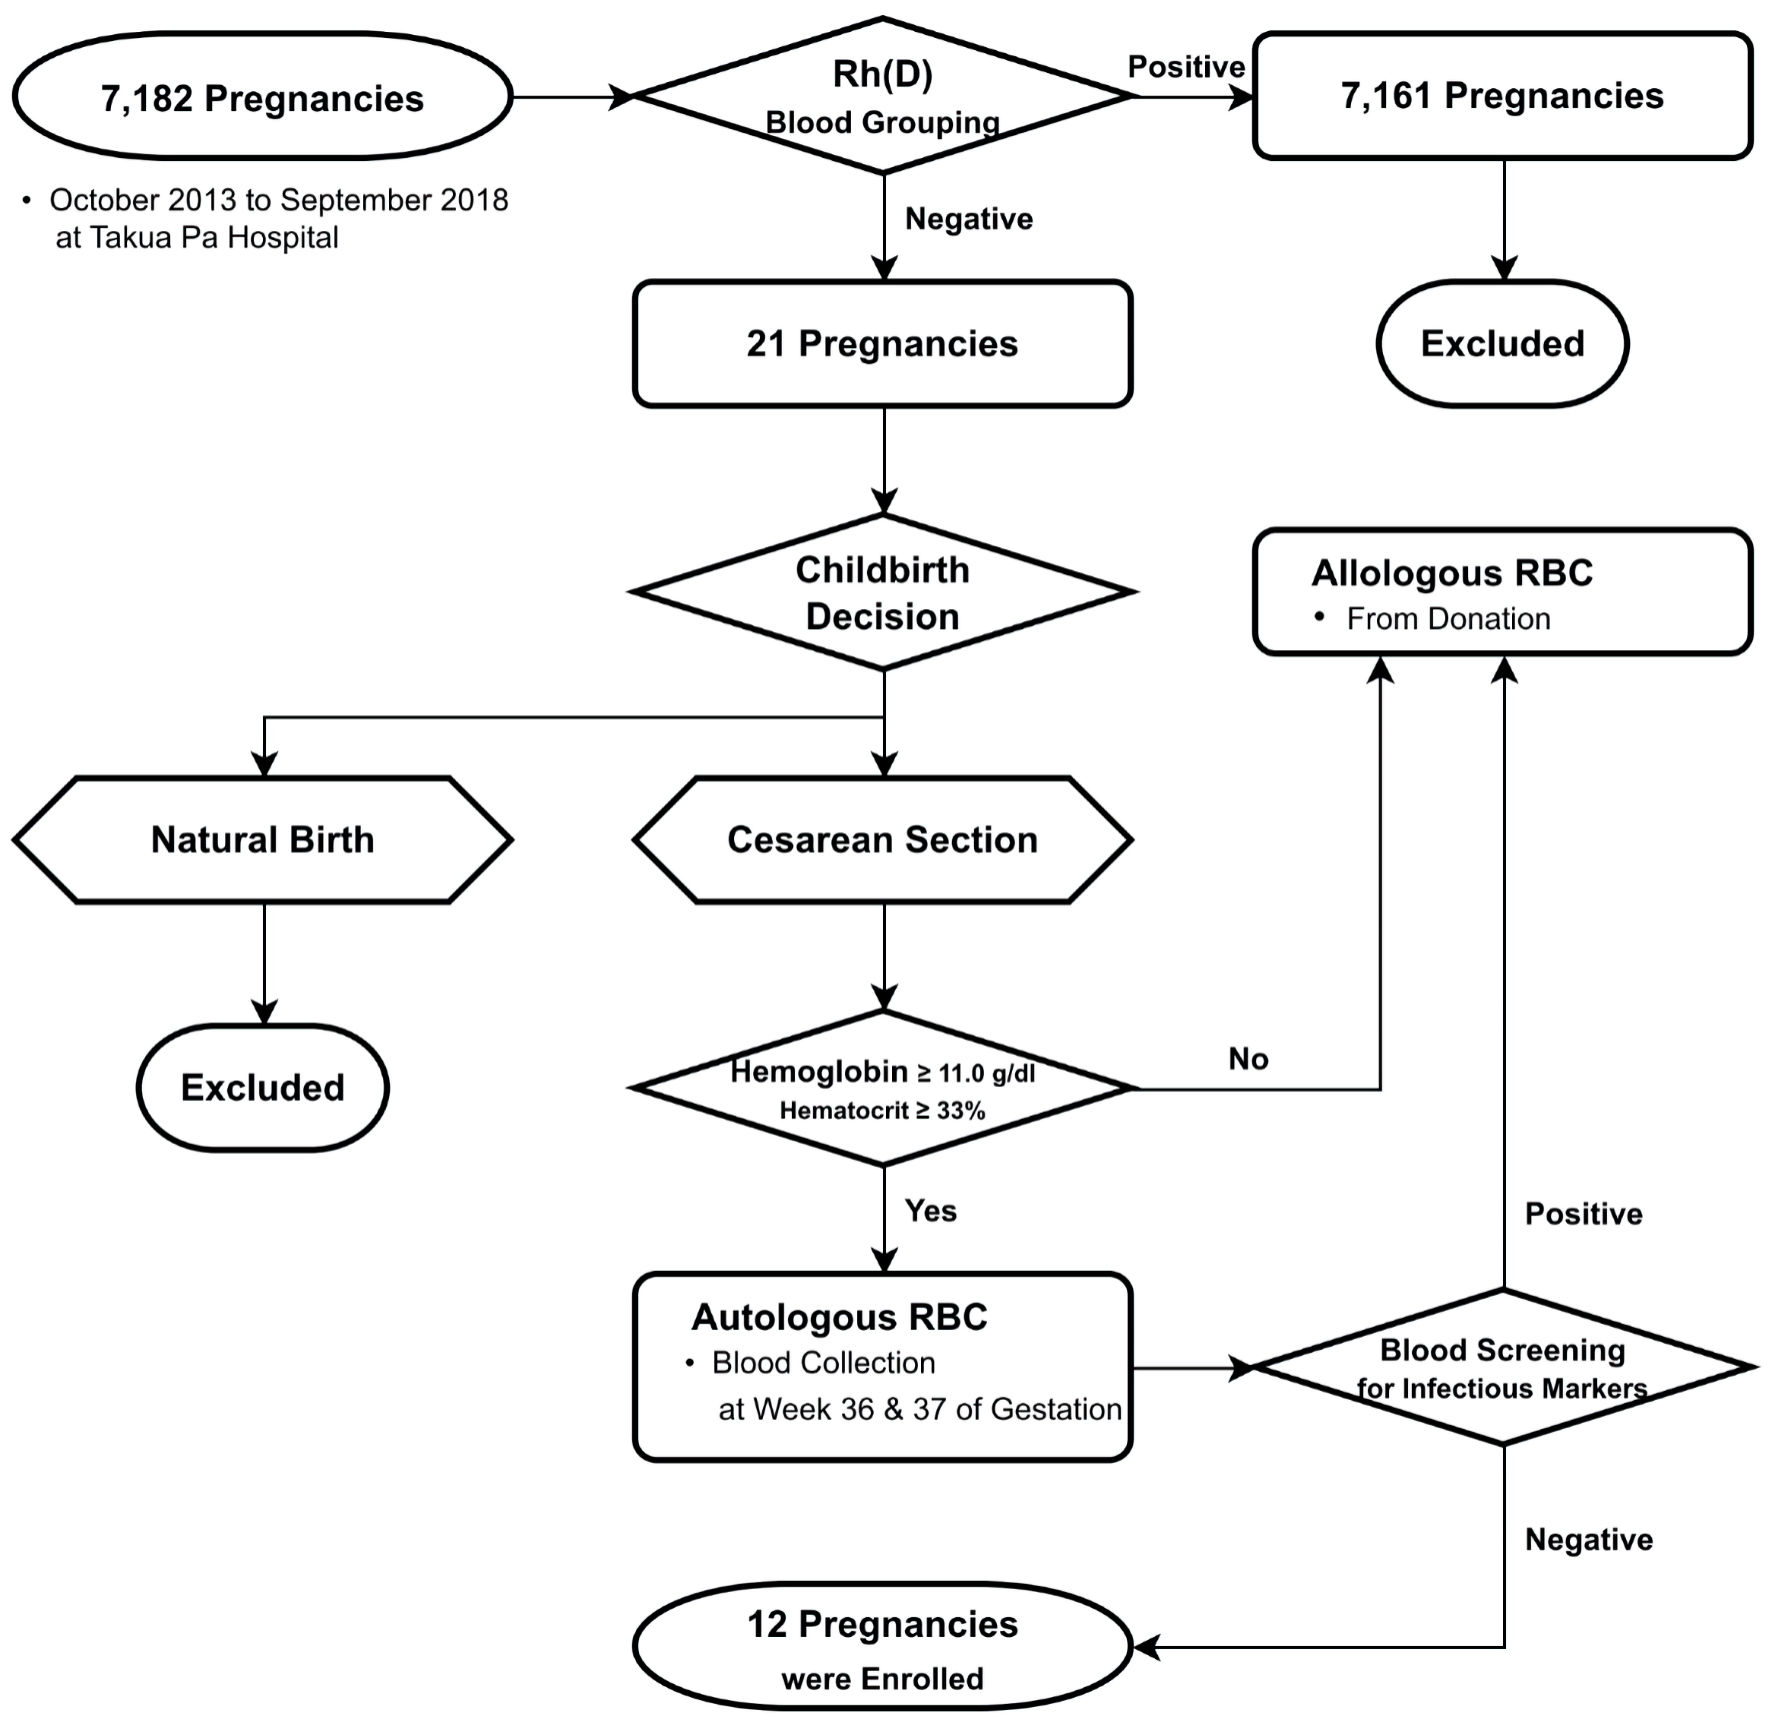
↓ Figure 1. Flowchart illustrating the selection
process for pregnancies enrolled in the autologous blood donation program. RBC: red blood cell.
| Journal of Clinical Medicine Research, ISSN 1918-3003 print, 1918-3011 online, Open Access |
| Article copyright, the authors; Journal compilation copyright, J Clin Med Res and Elmer Press Inc |
| Journal website https://jocmr.elmerjournals.com |
Original Article
Volume 16, Number 7-8, August 2024, pages 335-344
Preoperative Autologous Blood Donation for Rh-Negative Pregnant Women Undergoing Cesarean Sections
Figures
Tables
| Pregnant women | Age | ABO | Rh | Baby gender | Baby weight (g) |
|---|---|---|---|---|---|
| 1 | 30 | AB | Negative | Boy | 3,590 |
| 2 | 24 | A | Negative | Girl | 3,070 |
| 3 | 31 | B | Negative | Girl | 4,080 |
| 4 | 27 | O | Negative | Girl | 3,200 |
| 5 | 41 | O | Negative | Girl | 2,870 |
| 6 | 28 | O | Negative | Boy | 3,210 |
| 7 | 17 | A | Negative | Girl | 2,730 |
| 8 | 18 | B | Negative | Boy | 3,000 |
| 9 | 40 | O | Negative | Boy | 2,640 |
| 10 | 21 | O | Negative | Boy | 3,160 |
| 11 | 32 | B | Negative | Boy | 3,820 |
| 12 | 25 | A | Negative | Girl | 3,220 |
| Demographic variables | Pregnancy (n = 12) |
|---|---|
| Age (years) | |
| Range | 17 - 41 |
| Mean | 27.83 |
| BMI category (kg/m2), n (%) | |
| Underweight (< 18.5) | 0 (0) |
| Normal weight (18.5 - 24.9) | 4 (33.33) |
| Overweight (25.0 - 29.9) | 6 (50.00) |
| Obesity class I (30.0 - 34.9) | 2 (16.67) |
| ABO, n (%) | |
| AB | 1 (8.33) |
| A | 3 (25.00) |
| B | 3 (25.00) |
| O | 5 (41.67) |
| Rh, n (%) | |
| Negative | 12 (100) |
| Demographic variables | Baby (n = 12) |
|---|---|
| Body weight (g) | |
| Range | 2,640 - 4,080 |
| Mean | 3,216 |
| Gender, % | |
| Male | 50 |
| Female | 50 |
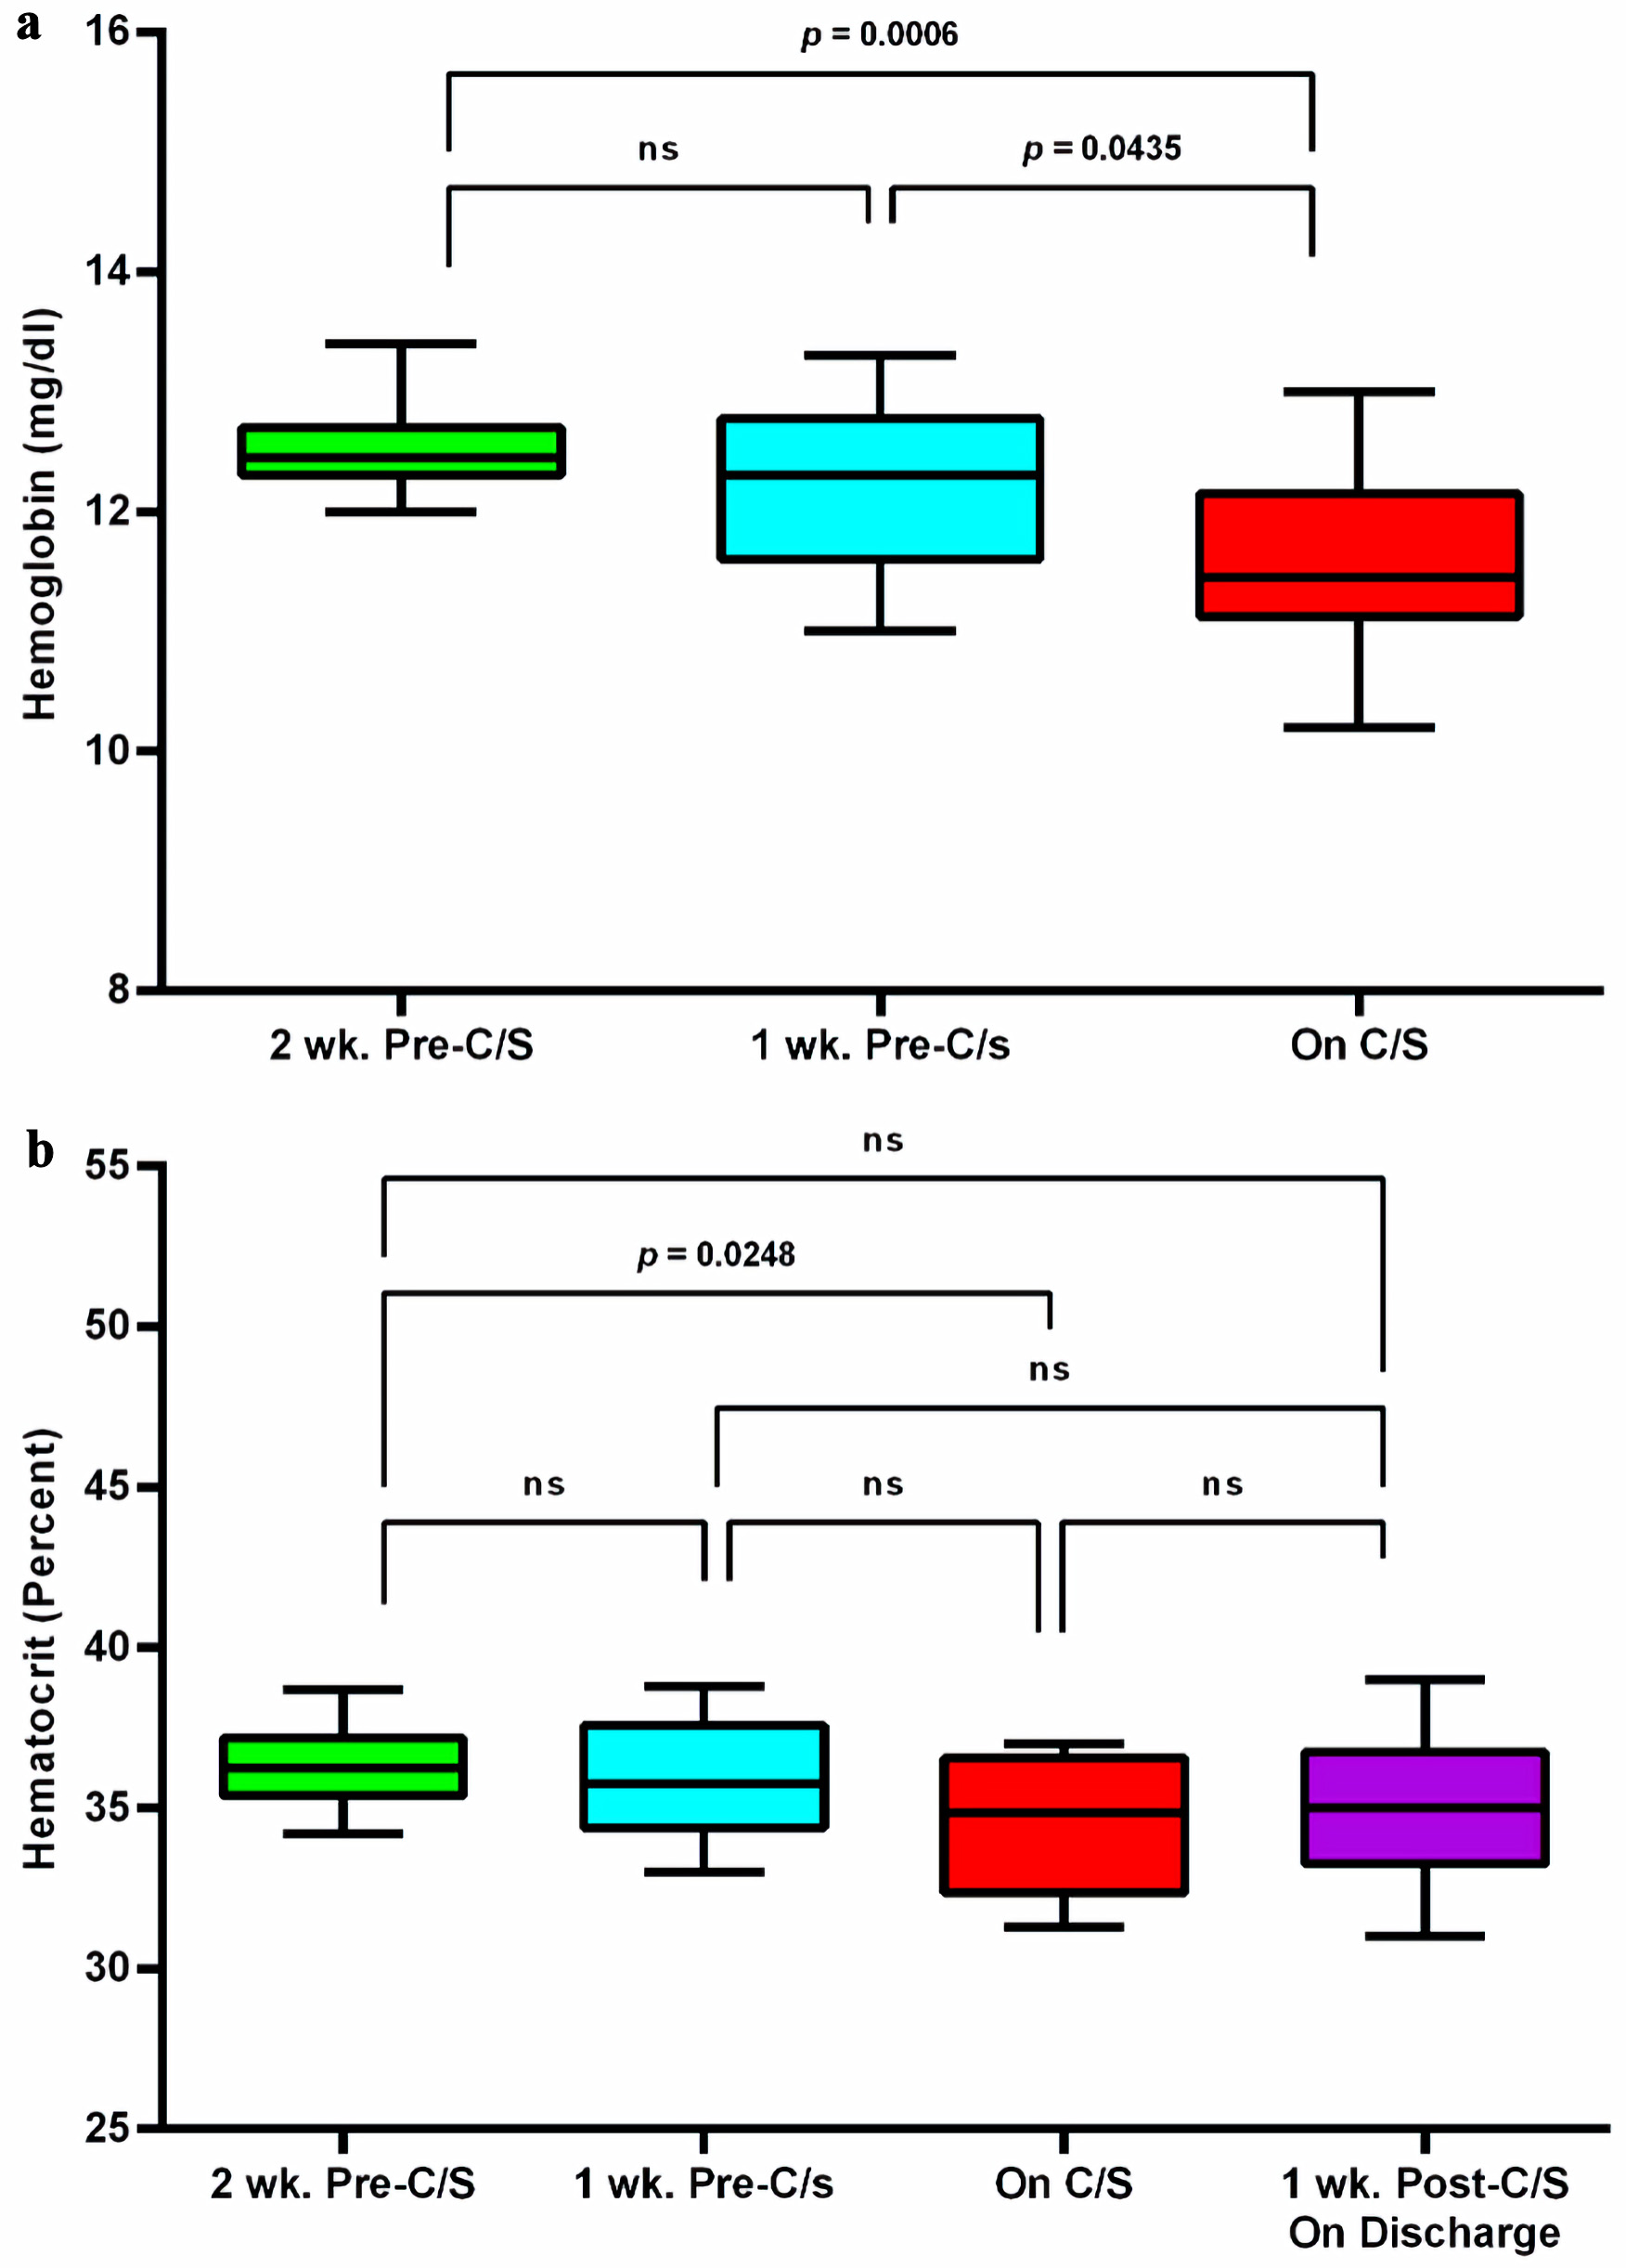
| Pregnant women | 2 weeks Pre-C/S | 1 week Pre-C/S | On C/S | 1 week Post-C/S, on discharge | |||
|---|---|---|---|---|---|---|---|
| Hb (g/dL) | Hct (%) | Hb (g/dL) | Hct (%) | Hb (g/dL) | Hct (%) | Hct (%) | |
| C/S: C-section; C-section: cesarean sections; Hb: hemoglobin; Hct: hematocrit; SD: standard deviation. | |||||||
| 1 | 12.7 | 35.6 | 12.3 | 35.3 | 12.2 | 34.7 | 34 |
| 2 | 12.1 | 36.9 | 11.6 | 34.9 | 11.9 | 36.2 | 35 |
| 3 | 12.4 | 36.5 | 11.6 | 34.2 | 11.1 | 33.4 | 38 |
| 4 | 12.7 | 37.0 | 12.8 | 36.9 | 11.2 | 35.0 | 31 |
| 5 | 13.4 | 37.2 | 13.0 | 36.2 | 13.1 | 36.7 | 36 |
| 6 | 12.5 | 38.7 | 12.1 | 37.8 | 12.2 | 37.0 | 39 |
| 7 | 12.3 | 34.2 | 11.3 | 33.0 | 11.3 | 32.2 | 33 |
| 8 | 12.3 | 35.3 | 11.0 | 33.0 | 10.2 | 31.8 | 32 |
| 9 | 12.6 | 37.1 | 12.5 | 38.0 | 12.0 | 37.0 | 37 |
| 10 | 12.0 | 34.5 | 12.3 | 35.0 | 11.0 | 32.8 | 35 |
| 11 | 12.4 | 36.5 | 12.7 | 38.8 | 11.6 | 35.0 | 33 |
| 12 | 13.0 | 37.5 | 13.3 | 36.5 | 11.2 | 31.3 | 35 |
| Mean | 12.53 | 36.42 | 12.21 | 35.80 | 11.58 | 34.43 | 34.83 |
| SD | 0.39 | 1.30 | 0.71 | 1.90 | 0.75 | 2.08 | 2.41 |