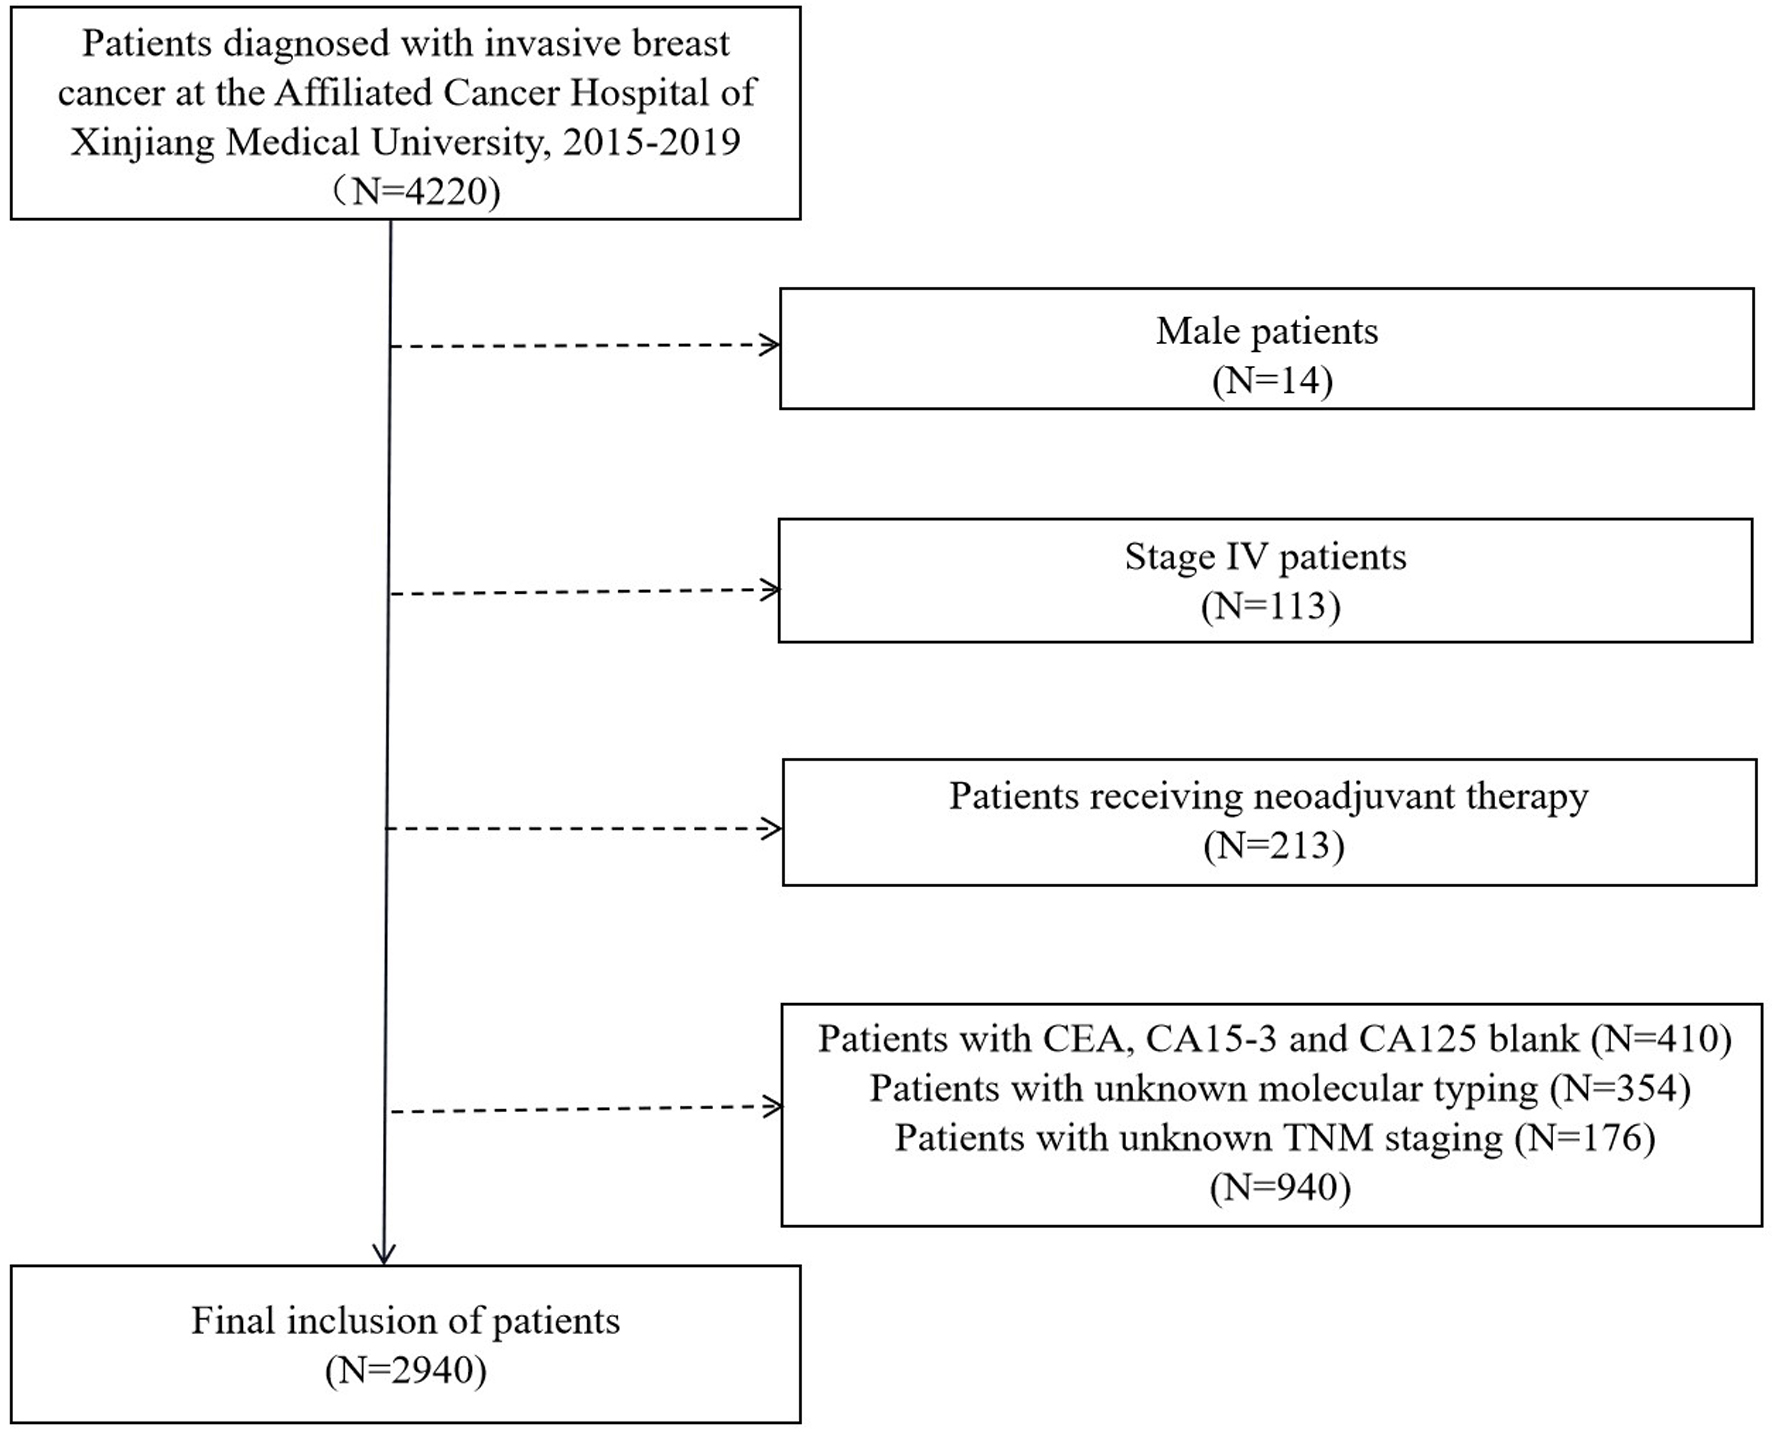
↓ Figure 1. Flow chart for determining the
research object. CEA: carcinoembryonic antigen; CA15-3: cancer antigen 15-3; CA125: cancer antigen
125.
| Journal of Clinical Medicine Research, ISSN 1918-3003 print, 1918-3011 online, Open Access |
| Article copyright, the authors; Journal compilation copyright, J Clin Med Res and Elmer Press Inc |
| Journal website https://jocmr.elmerjournals.com |
Original Article
Volume 16, Number 10, October 2024, pages 491-502
The Effects of Preoperative Serum Carcinoembryonic Antigen, Cancer Antigen 15-3 and Cancer Antigen 125 on the Prognosis of Breast Cancer Patients With Different Molecular Subtypes
Figures
Tables
| Factor | N | % |
|---|---|---|
| CEA: carcinoembryonic antigen; CA15-3: cancer antigen 15-3; CA125: cancer antigen 125; HER2+: human epidermal growth factor receptor-2-enriched; TNBC: triple-negative breast cancer. | ||
| Age (years) | ||
| ≤ 50 | 1,119 | 38.1 |
| > 50 | 1,821 | 61.9 |
| Median | 52.5 (27.0 - 97.1) | |
| Molecular subtype | ||
| Luminal A | 448 | 15.2 |
| Luminal B | 1,695 | 57.7 |
| HER2+ | 345 | 11.7 |
| TNBC | 452 | 15.4 |
| Treatment | ||
| Chemotherapy | 1,372 | 50.7 |
| Endocrine treatment | 881 | 32.6 |
| Radiation treatment | 453 | 16.7 |
| Event | ||
| Alive | 2,755 | 93.7 |
| Dead | 185 | 6.3 |
| Tumor marker | ||
| CEA (µg/L) | ||
| Normal | 2,642 | 89.9 |
| Elevated | 298 | 10.1 |
| Median | 1.68 (0.5 - 1,449.1) | |
| CA15-3 (U/mL) | ||
| Normal | 2,643 | 89.9 |
| Elevated | 297 | 10.1 |
| Median | 9.7 (2.3 - 800) | |
| CA125 (U/mL) | ||
| Normal | 2,600 | 88.4 |
| Elevated | 340 | 11.6 |
| Median | 13.8 (1.9 - 1,000) | |
| Clinicopathologic factors | CEA | CA15-3 | CA125 | ||||||
|---|---|---|---|---|---|---|---|---|---|
| Elevated (N = 298) | Normal (N = 2,642) | P value | Elevated (N = 297) | Normal (N = 2,643) | P value | Elevated (N = 340) | Normal (N = 2,600) | P value | |
| CEA: carcinoembryonic antigen; CA15-3: cancer antigen 15-3; CA125: cancer antigen 125; ER: estrogen receptor; HER2+: human epidermal growth factor receptor-2-enriched; PR: progesterone receptor; TNBC: triple-negative breast cancer. | |||||||||
| Age (years) | |||||||||
| ≤ 50 | 71 (23.8%) | 1,048 (39.7%) | < 0.001 | 118 (39.7%) | 1,001 (37.9%) | 0.574 | 175 (51.5%) | 944 (36.3%) | < 0.001 |
| > 50 | 227 (76.2%) | 1,594 (60.3%) | 179 (60.3%) | 1,642 (62.1%) | 165 (48.5%) | 1,656 (63.7%) | |||
| Tumor size | |||||||||
| T0-1 | 87 (29.2%) | 1,348 (51.0%) | < 0.001 | 42 (14.2%) | 1,393 (52.7%) | < 0.001 | 121 (35.6%) | 1,314 (50.5%) | < 0.001 |
| T2 | 128 (42.9%) | 1,103 (41.7%) | 148 (49.8%) | 1,083 (41.0%) | 149 (43.8%) | 1,082 (41.6%) | |||
| T3-4 | 83 (27.9%) | 191 (7.2%) | 107 (36.0%) | 167 (6.3%) | 70 (20.6%) | 204 (7.8%) | |||
| Lymph node status | |||||||||
| N0 | 89 (29.9%) | 1,488 (56.3%) | < 0.001 | 65 (21.9%) | 1,512 (57.2%) | < 0.001 | 144 (42.4%) | 1,433 (55.1%) | < 0.001 |
| N1 | 90 (30.2%) | 759 (28.7%) | 101 (34.0%) | 748 (28.3%) | 96 (28.2%) | 753 (29.0%) | |||
| N2-3 | 119 (39.9%) | 395 (15.0%) | 131 (44.1%) | 383 (14.5%) | 100 (29.4%) | 414 (15.9%) | |||
| TNM stage | |||||||||
| I | 49 (16.4%) | 1,003 (38.0%) | < 0.001 | 25 (8.4%) | 1,027 (38.9%) | < 0.001 | 90 (26.5%) | 962 (37.0%) | < 0.001 |
| II | 98 (32.9%) | 1,159 (43.9%) | 96 (32.3%) | 1,161 (43.9%) | 120 (35.3%) | 1,137 (43.7%) | |||
| III | 151 (50.7%) | 480 (18.2%) | 176 (59.3%) | 455 (17.2%) | 130 (38.2%) | 501 (19.3%) | |||
| ER | |||||||||
| Positive | 198 (66.4%) | 1,893 (71.7%) | 0.070 | 213 (71.7%) | 1,878 (71.1%) | 0.864 | 198 (58.2%) | 1,893 (72.8%) | < 0.001 |
| Negative | 100 (33.6%) | 749 (28.3%) | 84 (28.3%) | 765 (28.9%) | 142 (41.8%) | 707 (27.2%) | |||
| PR | |||||||||
| Positive | 164 (55.0%) | 1,720 (65.1%) | < 0.001 | 173 (58.2%) | 1,711 (64.7%) | 0.032 | 179 (52.6%) | 1,705 (65.6%) | < 0.001 |
| Negative | 134 (45.0%) | 922 (34.9%) | 124 (41.8%) | 932 (35.3%) | 161 (47.4%) | 895 (34.4%) | |||
| HER2 | |||||||||
| Positive | 104 (34.9%) | 567 (21.5%) | < 0.001 | 88 (29.6%) | 583 (22.1%) | 0.004 | 76 (22.4%) | 595 (22.9%) | 0.880 |
| Negative | 194 (65.1%) | 2,075 (78.5%) | 209 (70.4%) | 2,060 (77.9%) | 264 (77.6%) | 2,005 (77.1%) | |||
| Molecular subtype | |||||||||
| Luminal A | 39 (13.1%) | 409 (15.5%) | < 0.001 | 24 (8.1%) | 424 (16.0%) | 0.002 | 23 (6.8%) | 425 (16.3%) | < 0.001 |
| Luminal B | 167 (56.0%) | 1,528 (57.8%) | 193 (65.0%) | 1,502 (56.8%) | 184 (54.1%) | 1,511 (58.1%) | |||
| HER2+ | 58 (19.5%) | 287 (10.9%) | 32 (10.8%) | 313 (11.8%) | 40 (11.8%) | 305 (11.7%) | |||
| TNBC | 34 (11.4%) | 418 (15.8%) | 48 (16.2%) | 404 (15.3%) | 93 (27.4%) | 359 (13.8%) | |||
| Histological grade | |||||||||
| I | 20 (6.7%) | 415 (15.7%) | < 0.001 | 10 (3.4%) | 425 (16.1%) | < 0.001 | 32 (9.4%) | 403 (15.5%) | < 0.001 |
| II | 111 (37.2%) | 1,285 (48.6%) | 95 (32.0%) | 1,301 (49.2%) | 129 (37.9%) | 1,267 (48.7%) | |||
| III | 109 (36.6%) | 490 (18.5%) | 131 (44.1%) | 468 (17.7%) | 116 (34.1%) | 483 (18.6%) | |||
| Unknown | 58 (19.5%) | 452 (17.1%) | 61 (20.5%) | 449 (17.0%) | 63 (18.5%) | 447 (17.2%) | |||
| Chemotherapy | |||||||||
| Done | 82 (27.5%) | 1,290 (48.8%) | < 0.001 | 88 (29.6%) | 1,284 (48.6%) | < 0.001 | 138 (40.6%) | 1,234 (47.5%) | 0.020 |
| No | 216 (72.5%) | 1,352 (51.2%) | 209 (70.4%) | 1,359 (51.4%) | 202 (59.4%) | 1,366 (52.5%) | |||
| Radiotherapy | |||||||||
| Done | 28 (9.4%) | 425 (16.1%) | 0.003 | 29 (9.8%) | 424 (16.0%) | 0.005 | 48 (14.1%) | 405 (15.6%) | 0.535 |
| No | 270 (90.6%) | 2,217 (83.9%) | 268 (90.2%) | 2,219 (84.0%) | 292 (85.9%) | 2,195 (84.4%) | |||
| Endocrine treatment | |||||||||
| Done | 57 (19.1%) | 824 (31.2%) | < 0.001 | 62 (20.9%) | 819 (31.0%) | < 0.001 | 87 (25.6%) | 794 (30.5%) | 0.070 |
| No | 241 (80.9%) | 1,818 (68.8%) | 235 (79.1%) | 1,824 (69.0%) | 253 (74.4%) | 1,806 (69.5%) | |||
| Tumor marker | HR | 95.0% CI | P value | |
|---|---|---|---|---|
| Lower | Upper | |||
| CEA: carcinoembryonic antigen; CA15-3: cancer antigen 15-3; CA125: cancer antigen 125; CI: confidence interval; HER2+: human epidermal growth factor receptor-2-enriched; HR: hazard ratio; TNBC: triple-negative breast cancer. | ||||
| Total patients | ||||
| CEA | ||||
| Normal | 1.00 | |||
| Elevated | 5.943 | 4.407 | 8.015 | < 0.001 |
| CA15-3 | ||||
| Normal | 1.00 | |||
| Elevated | 6.845 | 5.099 | 9.190 | < 0.001 |
| CA125 | ||||
| Normal | 1.00 | |||
| Elevated | 3.466 | 2.524 | 4.759 | < 0.001 |
| Subtype | ||||
| Luminal A | ||||
| CEA | ||||
| Normal | 1.00 | |||
| Elevated | 17.32 | 6.158 | 48.69 | < 0.001 |
| CA15-3 | ||||
| Normal | 1.00 | |||
| Elevated | 24.45 | 8.669 | 68.93 | < 0.001 |
| CA125 | ||||
| Normal | 1.00 | |||
| Elevated | 3.673 | 0.828 | 16.29 | 0.087 |
| Luminal B | ||||
| CEA | ||||
| Normal | 1.00 | |||
| Elevated | 6.432 | 4.114 | 10.06 | < 0.001 |
| CA15-3 | ||||
| Normal | 1.00 | |||
| Elevated | 7.901 | 5.113 | 12.21 | < 0.001 |
| CA125 | ||||
| Normal | 1.00 | |||
| Elevated | 3.631 | 2.241 | 5.883 | < 0.001 |
| HER2+ | ||||
| CEA | ||||
| Normal | 1.00 | |||
| Elevated | 4.693 | 2.330 | 9.453 | |
| CA15-3 | ||||
| Normal | 1.00 | |||
| Elevated | 8.417 | 3.969 | 17.85 | |
| CA125 | ||||
| Normal | 1.00 | |||
| Elevated | 2.235 | 0.919 | 5.436 | 0.076 |
| CEA | ||||
| Normal | 1.00 | |||
| Elevated | 4.426 | 2.416 | 8.107 | < 0.001 |
| TNBC | ||||
| CA15-3 | ||||
| Normal | 1.00 | |||
| Elevated | 3.629 | 2.031 | 6.483 | < 0.001 |
| CA125 | ||||
| Normal | 1.00 | |||
| Elevated | 2.571 | 1.509 | 4.381 | < 0.001 |
| Breast cancer subtypes | HR | 95% CI | P value |
|---|---|---|---|
| CEA: carcinoembryonic antigen; CA15-3: cancer antigen 15-3; CA125: cancer antigen 125; CI: confidence interval; HER2+: human epidermal growth factor receptor-2-enriched; HR: hazard ratio; TNBC: triple-negative breast cancer. | |||
| Total patients | |||
| Tumor marker | |||
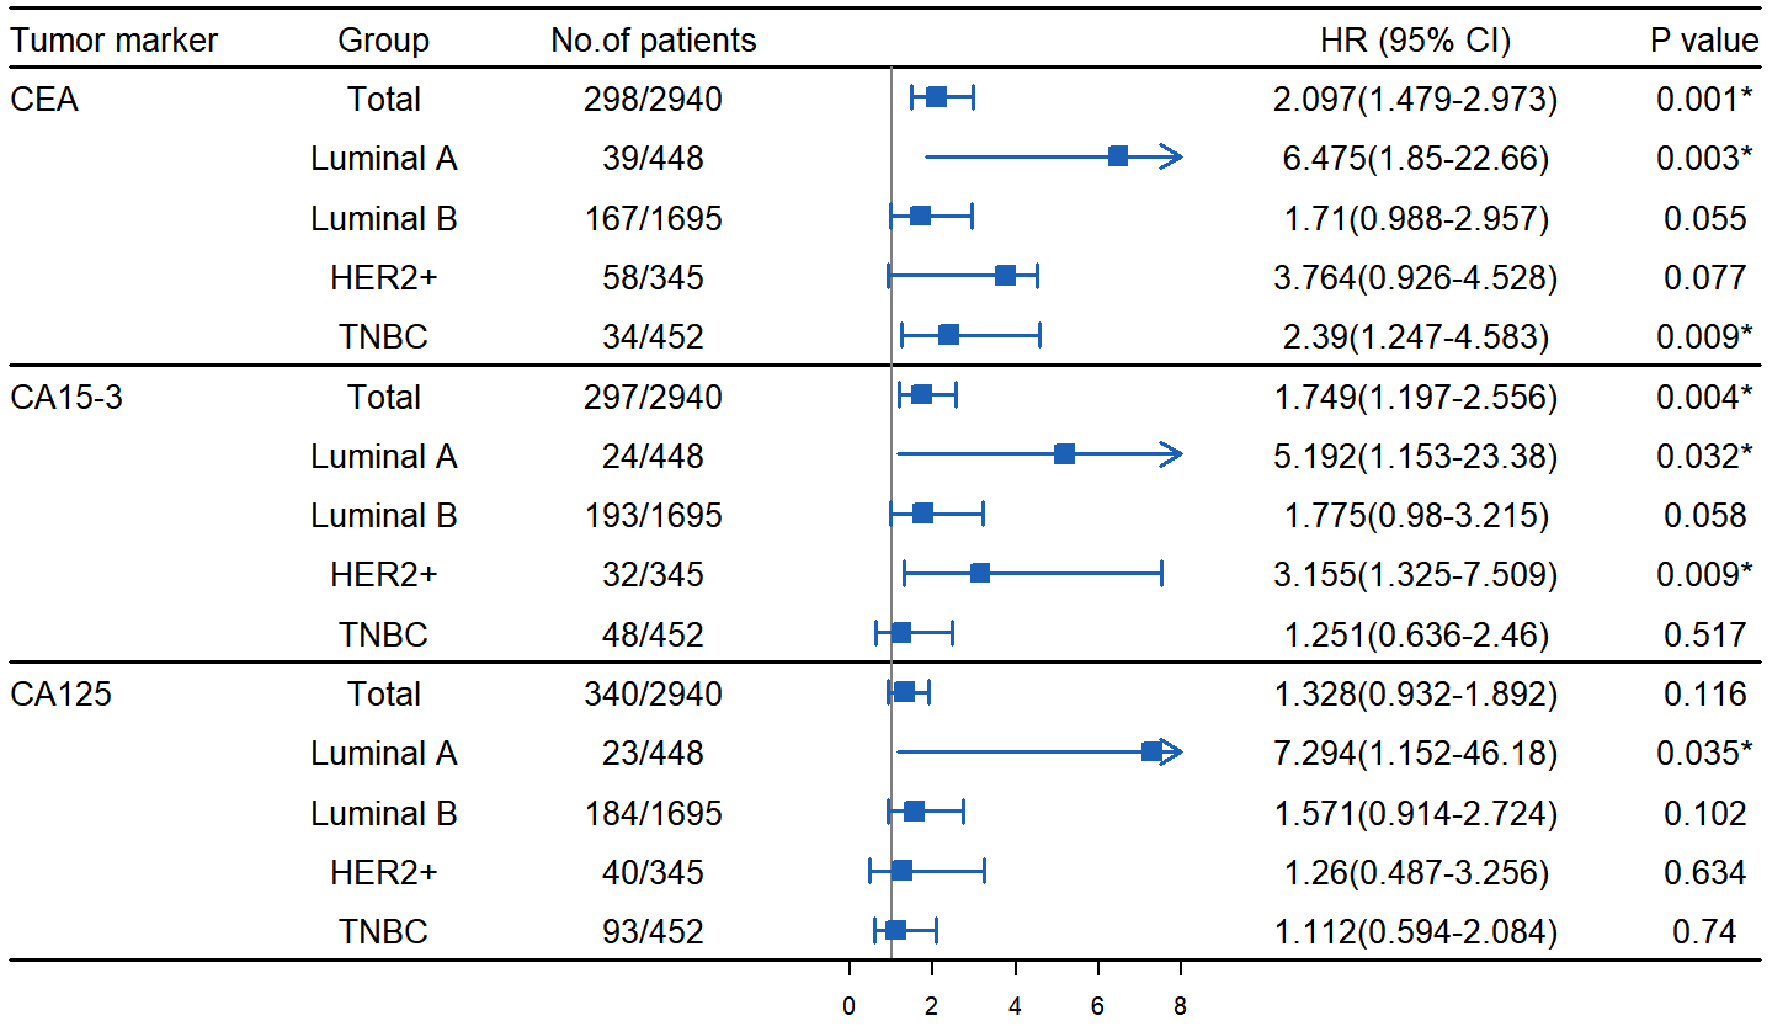
| CEA elevated vs. CEA normal | 2.097 | 1.479 - 2.973 | < 0.001 |
| CA15-3 elevated vs. CA15-3 normal | 1.749 | 1.197 - 2.556 | 0.004 |
| Tumor size | |||
| T2 vs. T0-1 | 2.070 | 1.179 - 3.635 | 0.011 |
| T3-4 vs. T0-1 | 2.889 | 1.558 - 5.357 | < 0.001 |
| Nodal status | |||
| N2 vs. N1 | 1.771 | 1.066 - 2.943 | 0.027 |
| Chemotherapy | |||
| Done vs. no | 0.421 | 0.277 - 0.641 | < 0.001 |
| Endocrine | |||
| Done vs. no | 0.456 | 0.237 - 0.875 | 0.018 |
| Luminal A | |||
| Tumor marker | |||
| CEA elevated vs. CEA normal | 6.475 | 1.850 - 22.66 | 0.003 |
| CA15-3 elevated vs. CA15-3 normal | 5.192 | 1.153 - 23.38 | 0.032 |
| CA125 elevated vs. CA125 normal | 7.294 | 1.152 - 46.18 | 0.035 |
| Luminal B | |||
| Tumor size | |||
| T3-4 vs. T0-1 | 3.103 | 1.235 - 7.797 | 0.016 |
| Chemotherapy | |||
| Done vs. no | 0.398 | 0.211 - 0.749 | 0.004 |
| HER2+ | |||
| Tumor marker | |||
| CA15-3 elevated vs. CA15-3 normal | 3.155 | 1.325 - 7.509 | 0.009 |
| TNBC | |||
| Tumor marker | |||
| CEA elevated vs. CEA normal | 2.390 | 1.247 - 4.583 | 0.009 |
| Chemotherapy | |||
| Done vs. no | 0.385 | 0.188 - 0.786 | 0.009 |