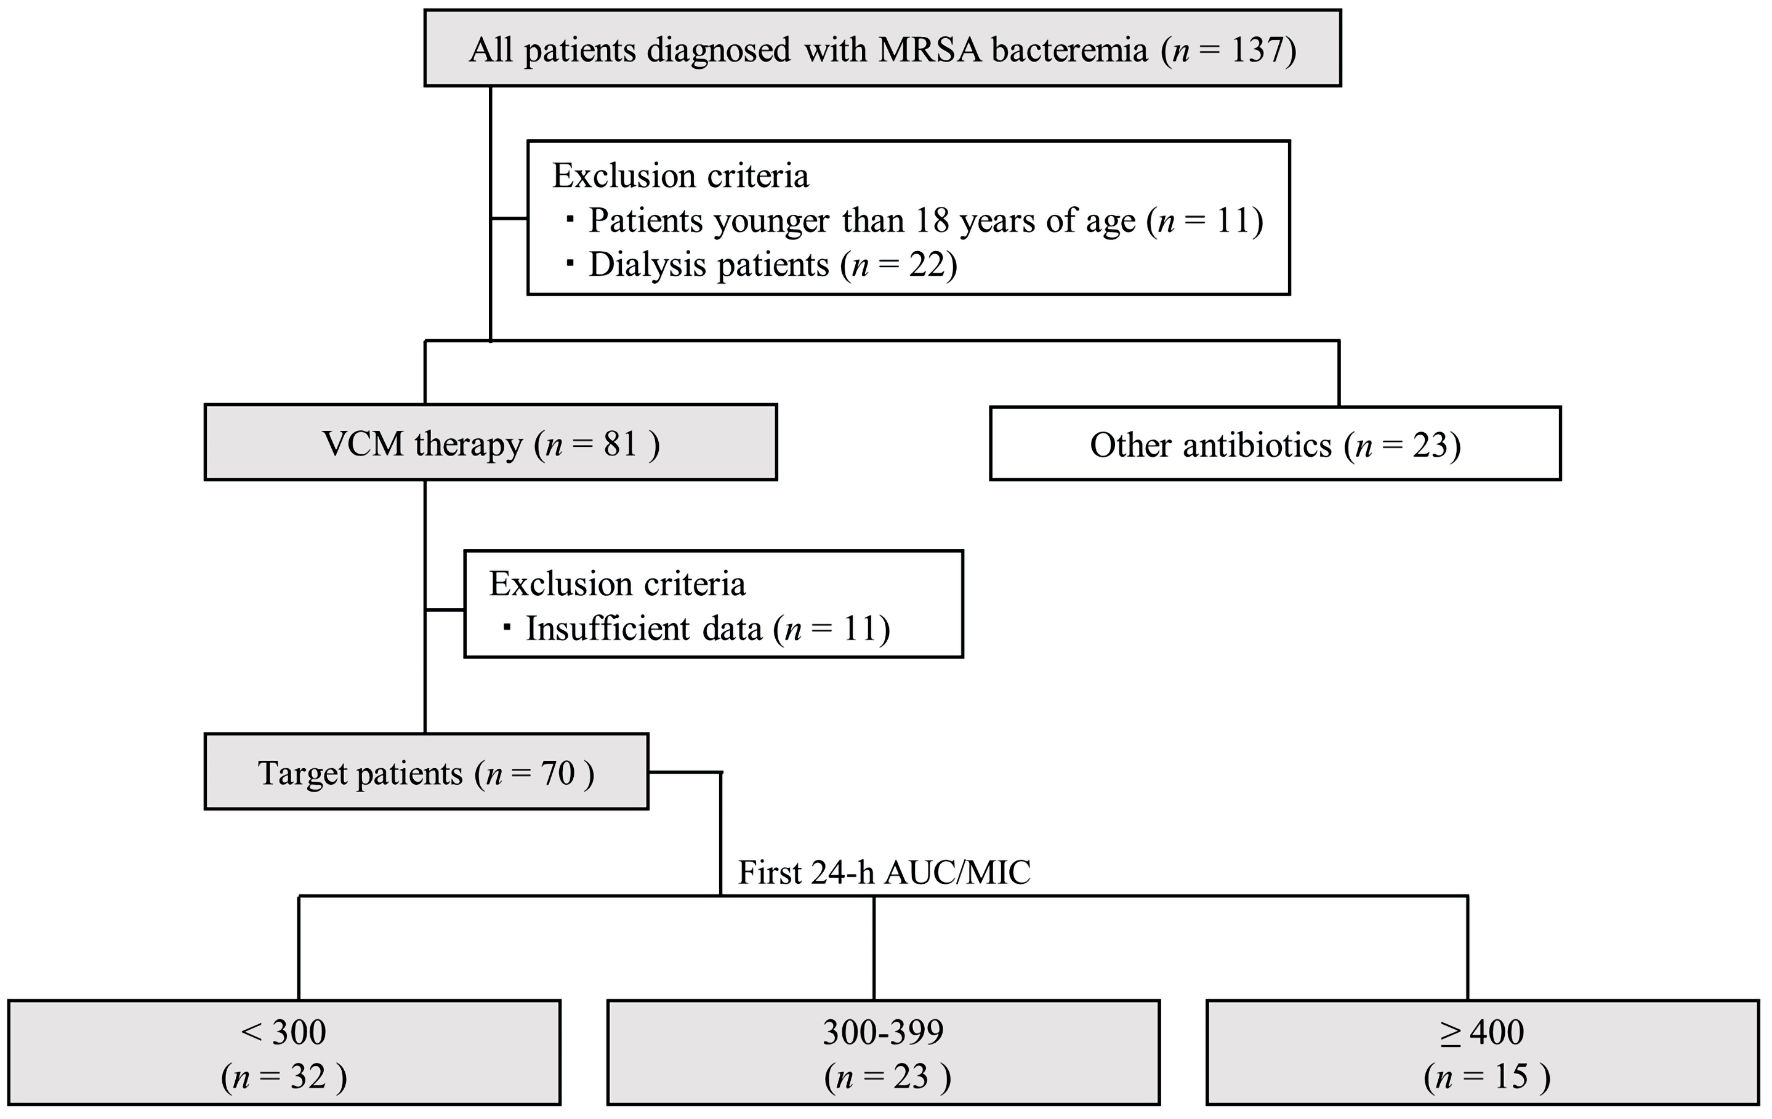
↓ Figure 1. Flowchart depicting patient selection
in this study. AUC/MIC: area under the concentration-time curve/minimum inhibitory concentration; VCM:
vancomycin; MRSA: methicillin-resistant Staphylococcus aureus.
| Journal of Clinical Medicine Research, ISSN 1918-3003 print, 1918-3011 online, Open Access |
| Article copyright, the authors; Journal compilation copyright, J Clin Med Res and Elmer Press Inc |
| Journal website https://jocmr.elmerjournals.com |
Original Article
Volume 16, Number 7-8, August 2024, pages 325-334
Impact of the First Twenty-Four-Hour Area Under the Concentration-Time Curve/Minimum Inhibitory Concentration of Vancomycin on Treatment Outcomes in Patients With Methicillin-Resistant Staphylococcus aureus Bacteremia
Figures

Tables
| First 24-h AUC/MIC (µg·h/mL) | N |
|---|---|
| AUC/MIC: area under the concentration-time curve/minimum inhibitory concentration. | |
| 100 - 199 | 2 (2.9%) |
| 200 - 299 | 30 (42.9%) |
| 300 - 399 | 23 (32.9%) |
| 400 - 499 | 15 (21.4%) |
| Total number of cases (n) | 70 |
| Median of AUC/MIC (µg·h/mL) | 312.9 |
| Clinical background | First 24-h AUC/MIC (µg·h/mL) | P value | |
|---|---|---|---|
| < 300 (n = 32) | ≥ 300 (n = 38) | ||
| Values are presented as number (%) or median (interquartile range). AUC: area under the concentration-time curve; AUC0 - 24 h: AUC on day 1; AUC24 - 48 h: AUC on day 2; AUCss: AUC at steady state; BT: body temperature; Ccr: creatinine clearance; CRP: C-reactive protein; MIC: minimum inhibitory concentration; SCr: serum creatinine; VCM: vancomycin; WBC: white blood cell. | |||
| Male sex (n (%)) | 21 (65.6) | 25 (65.8) | 0.988 |
| Age (years) | 69.5 (60.0 - 78.0) | 70.5 (67.8 - 80.5) | 0.285 |
| Body weight (kg) | 50.6 (38.5 - 56.1) | 53.0 (43.6 - 61.5) | 0.183 |
| Comorbidities (n (%)) | |||
| Heart failure | 11 (34.3%) | 15 (39.5%) | 0.660 |
| Malignancy | 9 (28.1%) | 8 (21.1%) | 0.492 |
| Diabetes | 5 (15.6%) | 7 (18.4%) | 0.757 |
| Aspiration pneumonia | 7 (21.9%) | 5 (13.2%) | 0.335 |
| Digestive disorders | 1 (3.1%) | 2 (5.3%) | 0.660 |
| Suspected origin of infection (n (%)) | 0.966 | ||
| Catheter-related bloodstream infections | 17 (53.1) | 18 (47.4) | |
| Skin and soft tissue infections | 6 (18.8) | 6 (15.8) | |
| Urinary tract infections | 2 (6.3) | 2 (5.3) | |
| Bacterial pneumonia | 2 (6.3) | 2 (5.3) | |
| Pyogenic spondylitis | 2 (6.3) | 3 (7.9) | |
| Unknown | 1 (3.1) | 3 (7.9) | |
| Others | 2 (6.3) | 4 (10.5) | |
| Laboratory data before VCM therapy | |||
| BT (°C) | 37.9 (37.7 - 38.3) | 37.9 (37.4 - 39.2) | 0.981 |
| WBC (× 103/µL) | 11.6 (9.1 - 15.1) | 14.5 (9.8 - 19.9) | 0.299 |
| CRP (mg/dL) | 14.6 (7.9 - 19.8) | 11.7 (10.0 - 15.8) | 0.396 |
| SCr (mg/dL) | 0.7 (0.6 - 0.9) | 0.8 (0.7 - 1.0) | 0.101 |
| Ccr (mL/min) | 65.0 (45.5 - 76.1) | 61.4 (40.4 - 73.8) | 0.465 |
| Concomitant antimicrobial agent | 0.511 | ||
| Carbapenem | 3 (9.4) | 5 (13.2) | |
| Penicillin/β-lactamase inhibitor | 0 (0) | 3 (7.9) | |
| Third and fourth generation cephalosporin | 3 (9.4) | 2 (6.3) | |
| Quinolone | 0 (0) | 0 (0) | |
| Nothing | 26 (81.3) | 28 (73.7) | |
| VCM therapy | |||
| MIC ≤ 1 µg/mL (n (%)) | 32 (100) | 38 (100) | 1.000 |
| Initial trough concentration (µg/mL) | 9.0 (6.7 - 10.0) | 14.1 (10.9 - 18.7) | < 0.001 |
| Dose of first day (mg/kg) | 22.4 (18.1 - 27.4) | 30.4 (22.8 - 35.4) | 0.001 |
| AUC0 - 24 h (µg·h/mL) | 268.2 (241.0 - 286.5) | 385.7 (346.9 - 418.3) | < 0.001 |
| AUC24 - 48 h (µg·h/mL) | 366.6 (315.1 - 406.5) | 509.0 (388.1 - 588.7) | < 0.001 |
| AUCss (µg·h/mL) | 449.4 (420.3 - 501.8) | 512.0 (422.6 - 541.0) | 0.085 |