Figures
↓ Figure 1. Age distribution of patients with
elevated CAVI. CAVI: cardio-ankle vascular index.

↓ Figure 2. Correlation matrix between vascular
stiffness markers, risk factors, clinical and biochemical measurements in patients < 50 years of age.
HTN: hypertension; IGT: impaired glucose tolerance; BMI: body mass index; WC: waist circumference; HC:
hip circumference; SBP: systolic blood pressure; DBP: diastolic blood pressure; TC: total cholesterol;
LDL: low-density lipoprotein; HDL: high-density lipoprotein; TG: triglycerides; GFR: glomerular
filtration rate; LAP: lipid accumulation product; VAI: visceral adiposity index; BFP: body fat
percentage.

↓ Figure 3. Correlation matrix between vascular
stiffness markers, risk factors, clinical and biochemical measurements in patients ≥ 50 years.
HTN: hypertension; IGT: impaired glucose tolerance; BMI: body mass index; WC: waist circumference; HC:
hip circumference; SBP: systolic blood pressure; DBP: diastolic blood pressure; TC: total cholesterol;
LDL: low-density lipoprotein; HDL: high-density lipoprotein; TG: triglycerides; GFR: glomerular
filtration rate; LAP: lipid accumulation product; VAI: visceral adiposity index; BFP: body fat
percentage.

↓ Figure 4. Significance of CAVIAge
model components for detecting high arterial stiffness (Random Forest estimation) in the < 50 years
group. DBP: diastolic blood pressure; LDL: low-density lipoprotein; GFR (EPI): glomerular filtration
rate (calculated by Chronic Kidney Disease Epidemiology Collaboration equation); LAP: lipid accumulation
product index; VAI: visceral adiposity index.

↓ Figure 5. Significance of the CAVI≥
9 model components for detecting high arterial stiffness (Random Forest estimation) in the
< 50 years group. DBP: diastolic blood pressure; LDL: low-density lipoprotein; GFR (EPI): glomerular
filtration rate (calculated by Chronic Kidney Disease Epidemiology Collaboration equation); LAP: lipid
accumulation product index; VAI: visceral adiposity index.

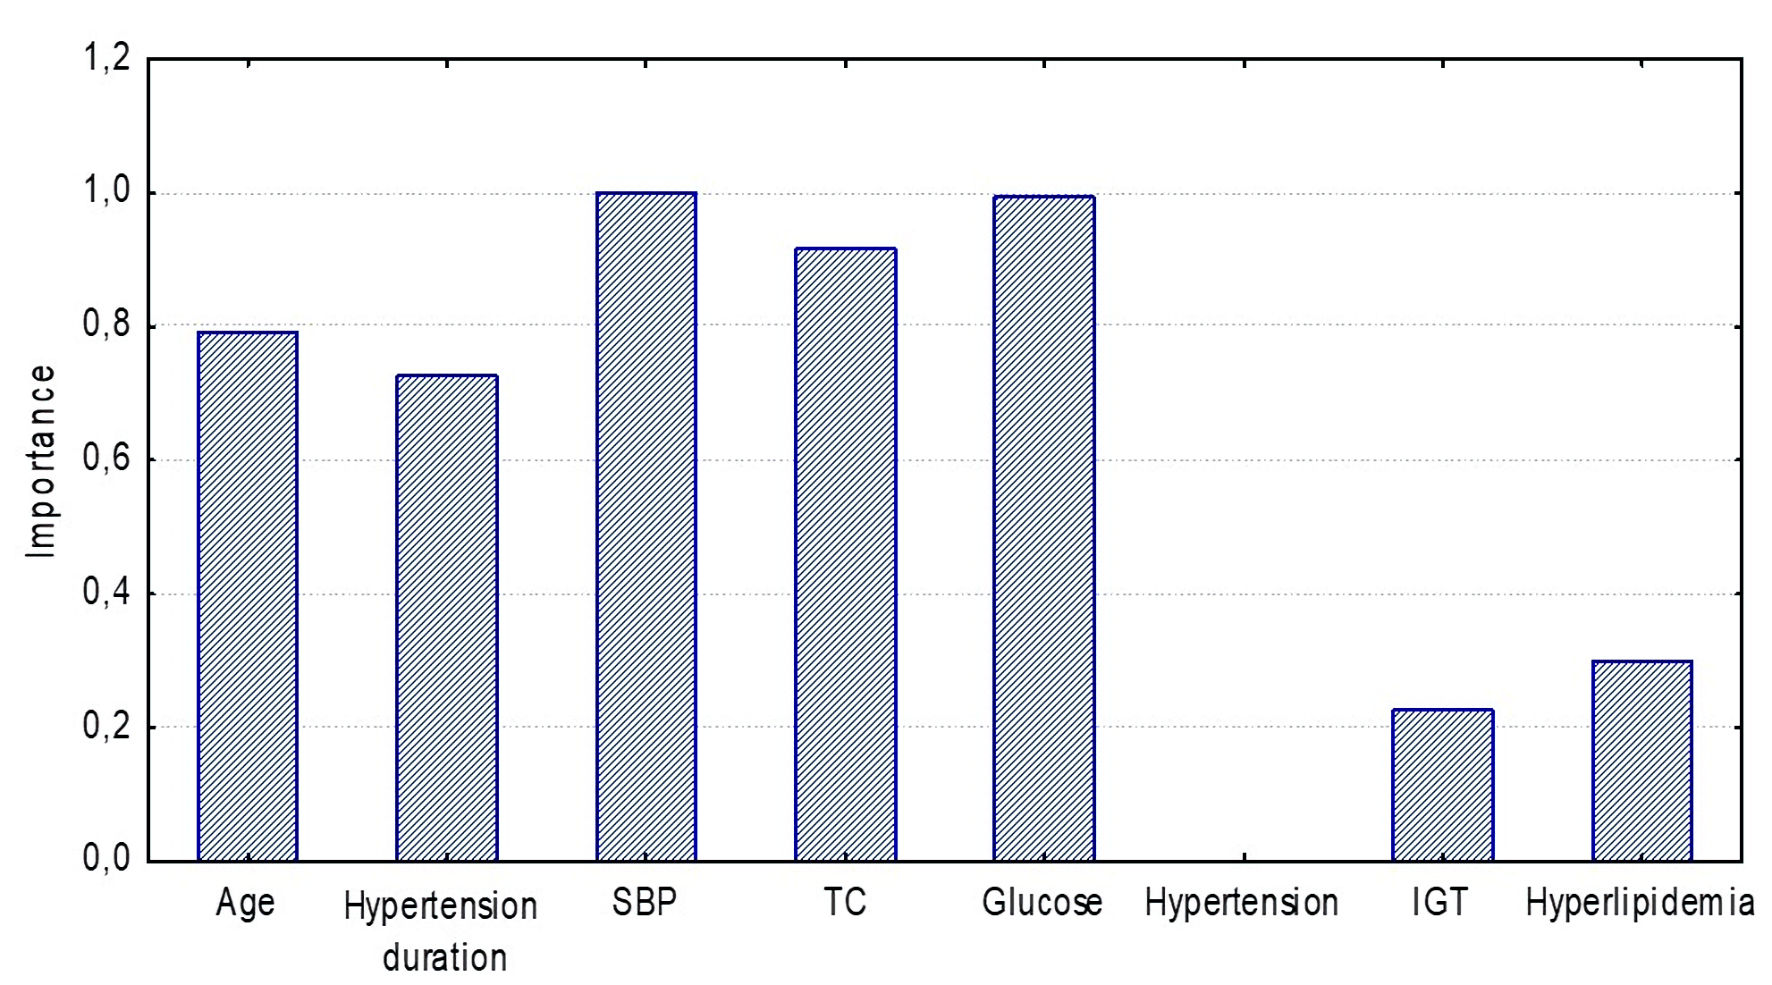
↓ Figure 6. Significance of CAVIAge
model components for detecting high arterial stiffness (Random Forest estimation) in the ≥ 50
years group. SBP: systolic blood pressure; TC: total cholesterol; IGT: impaired glucose tolerance.
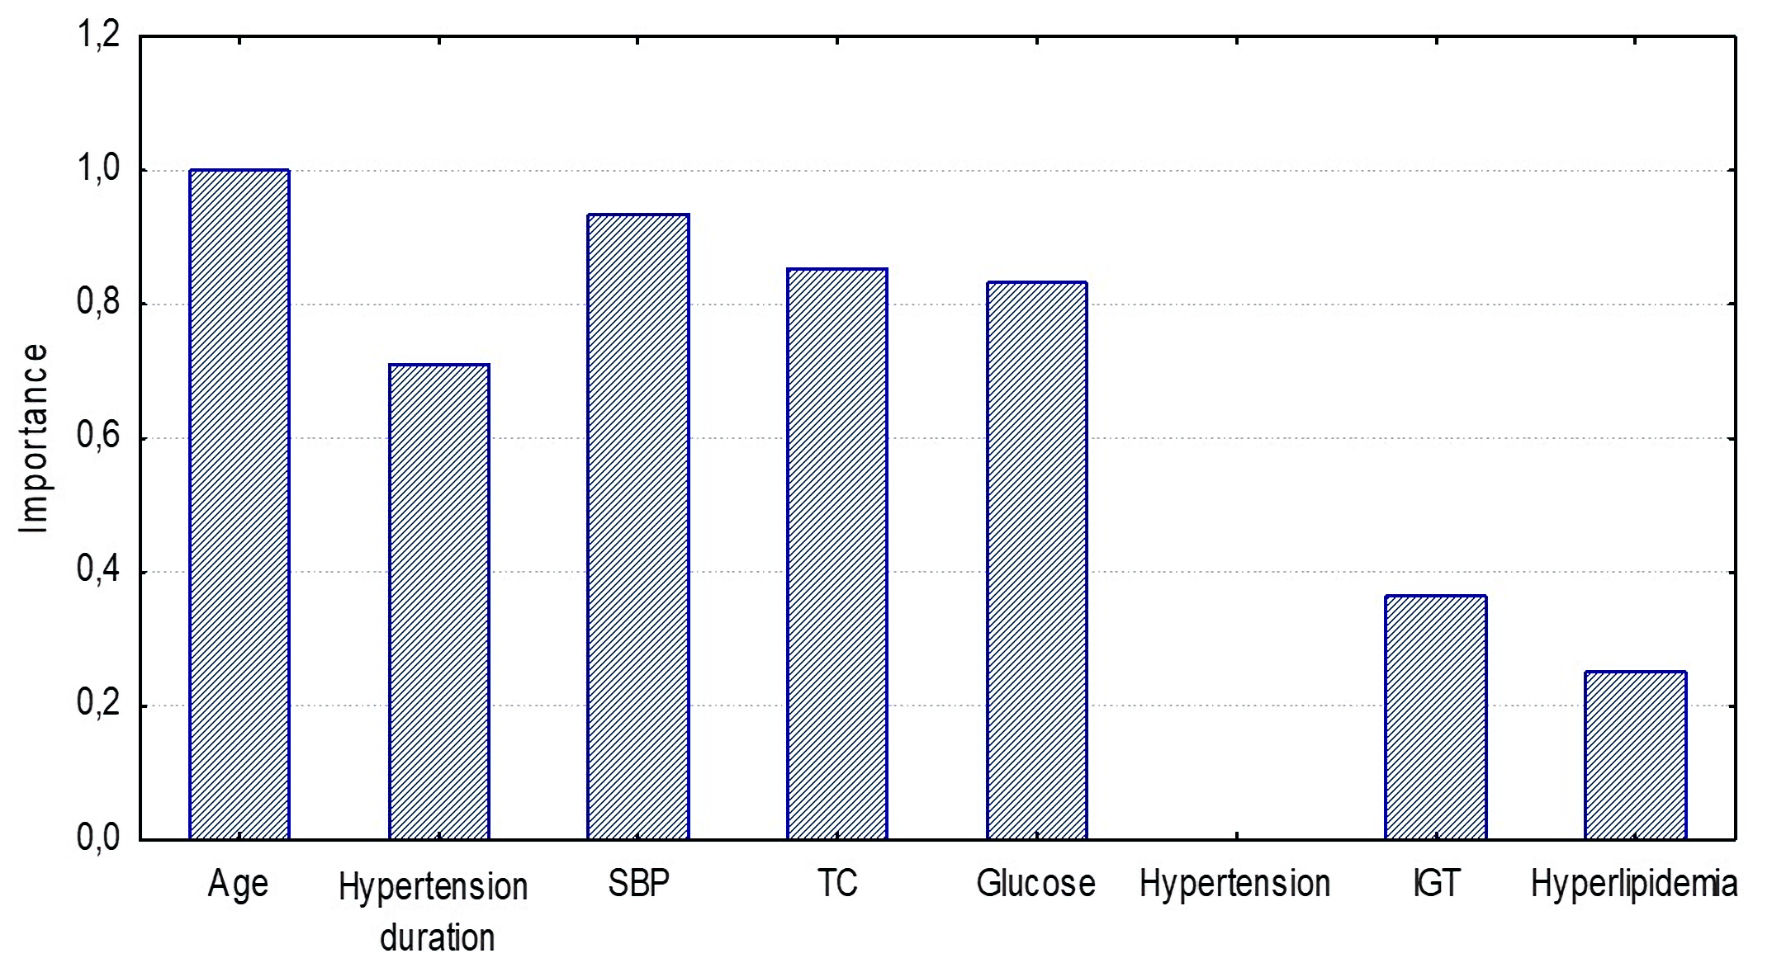
↓ Figure 7. Significance of CAVI≥
9 model components for detecting high arterial stiffness (Random Forest estimation) in the
≥ 50 years group. SBP: systolic blood pressure; TC: total cholesterol; IGT: impaired glucose
tolerance.
↓ Figure 8. ROC curves for the logistic
regression model determining arterial stiffness using CAVIAge in the < 50 years group.
ROC: receiver operating characteristic.

↓ Figure 9. ROC curves for the logistic
regression model determining arterial stiffness using CAVI≥ 9 in the < 50 years
group. ROC: receiver operating characteristic.

↓ Figure 10. ROC curves for the logistic
regression model determining arterial stiffness using CAVIAge in the ≥ 50 years group.
ROC: receiver operating characteristic.

↓ Figure 11. ROC curves for the logistic
regression model determining arterial stiffness using CAVI≥ 9 in the ≥ 50 years
group. ROC: receiver operating characteristic.

↓ Figure 12. Algorithm for choosing CAVI
reference values in apparently healthy adults. CAVIAge: age-specific cardio-ankle vascular
index reference values; CAVI: cardio-ankle vascular index.

Table
↓ Table 1. Clinical and Demographic Characteristics of
Participants
|
Parameter |
All
(n = 600) |
Age
< 50 (n = 378) |
Age
≥ 50 (n = 222) |
P
value for age, < 50 vs. ≥ 50 |
| BMI: body mass index; WC: waist circumference; HC: hip circumference; SBP: systolic
blood pressure; DBP: diastolic blood pressure; TC: total cholesterol; LDL: low-density lipoprotein;
HDL: high-density lipoprotein; TG: triglycerides; GFR: glomerular filtration rate; LAP: lipid
accumulation product; VAI: visceral adiposity index; BFP: body fat percentage; CAVIAge:
patients with high arterial stiffness formed according to age-specific cardio-ankle vascular index
reference values; CAVI≥ 9: patients with high arterial stiffness formed according
to universal cardio-ankle vascular index reference values. |
| Age, years |
39.8 ± 18.3 |
28.78 ± 10.4 |
60.9 ± 7.5 |
< 0.001 |
| Men, % |
43.17 |
42.28 |
40.09 |
0.88 |
| Weight, kg |
77.09 ± 19.14 |
72.9 ± 19.2 |
85.4 ± 16.4 |
0.02 |
| BMI, kg/m2 |
29.29 ± 7.3 |
28.87 ± 8.7 |
29.98 ± 5.2 |
0.85 |
| WC, cm |
80.79 ± 15.51 |
78.55 ± 14.01 |
91.9 ± 17.2 |
0.022 |
| Hypertension, % |
32.67 |
11.94 |
66.67 |
0.001 |
| SBP, mm Hg |
128.4 ± 15.33 |
125.8 ± 12.87 |
132.9 ± 17.6 |
< 0.001 |
| DBP, mm Hg |
79.19 ± 9.32 |
78.08 ± 8.58 |
81.5 ± 10.2 |
0.032 |
| TC, mmol/L |
4.8 ± 1.20 |
4.49 ± 0.89 |
5.47 ± 1.45 |
< 0.001 |
| LDL, mmol/L |
2.85 ± 1.26 |
2.46 ± 1.01 |
3.64 ± 1.28 |
<0.001 |
| HDL, mmol/L |
1.37 ± 0.4 |
1.4 ± 0.45 |
1.29 ± 0.42 |
0.08 |
| TG, mmol/L |
1.82 ± 1.18 |
1.8 ± 1.15 |
1.9 ± 1.16 |
0.28 |
| Glucose, mmol/L |
5.30 ± 1.89 |
4.85 ± 1.1 |
6.2 ± 2.78 |
< 0.001 |
| Creatinine, µmol/L |
84.13 ± 18.06 |
79.86 ± 14.95 |
92.03 ± 20.45 |
< 0.001 |
| GFR, mL/min/1.73 m2 |
97.5 ± 22.87 |
97.6 ± 18.56 |
68.1 ± 16.5 |
< 0.001 |
| LAP |
41.28 ± 34.2 |
34.87 ± 34.1 |
54.1 ± 31.2 |
< 0.001 |
| VAI |
1.99 ± 1.13 |
1.8 ± 1.05 |
2.3 ± 1.16 |
0.002 |
| BFP |
34.38 ± 8.6 |
31.3 ± 10.4 |
40.3 ± 8.3 |
< 0.001 |
| High CAVIAge, % |
29.7 |
19.04 |
47.7 |
< 0.001 |
| High CAVI≥ 9, % |
16.3 |
3.97 |
37.4 |
< 0.001 |