Figures
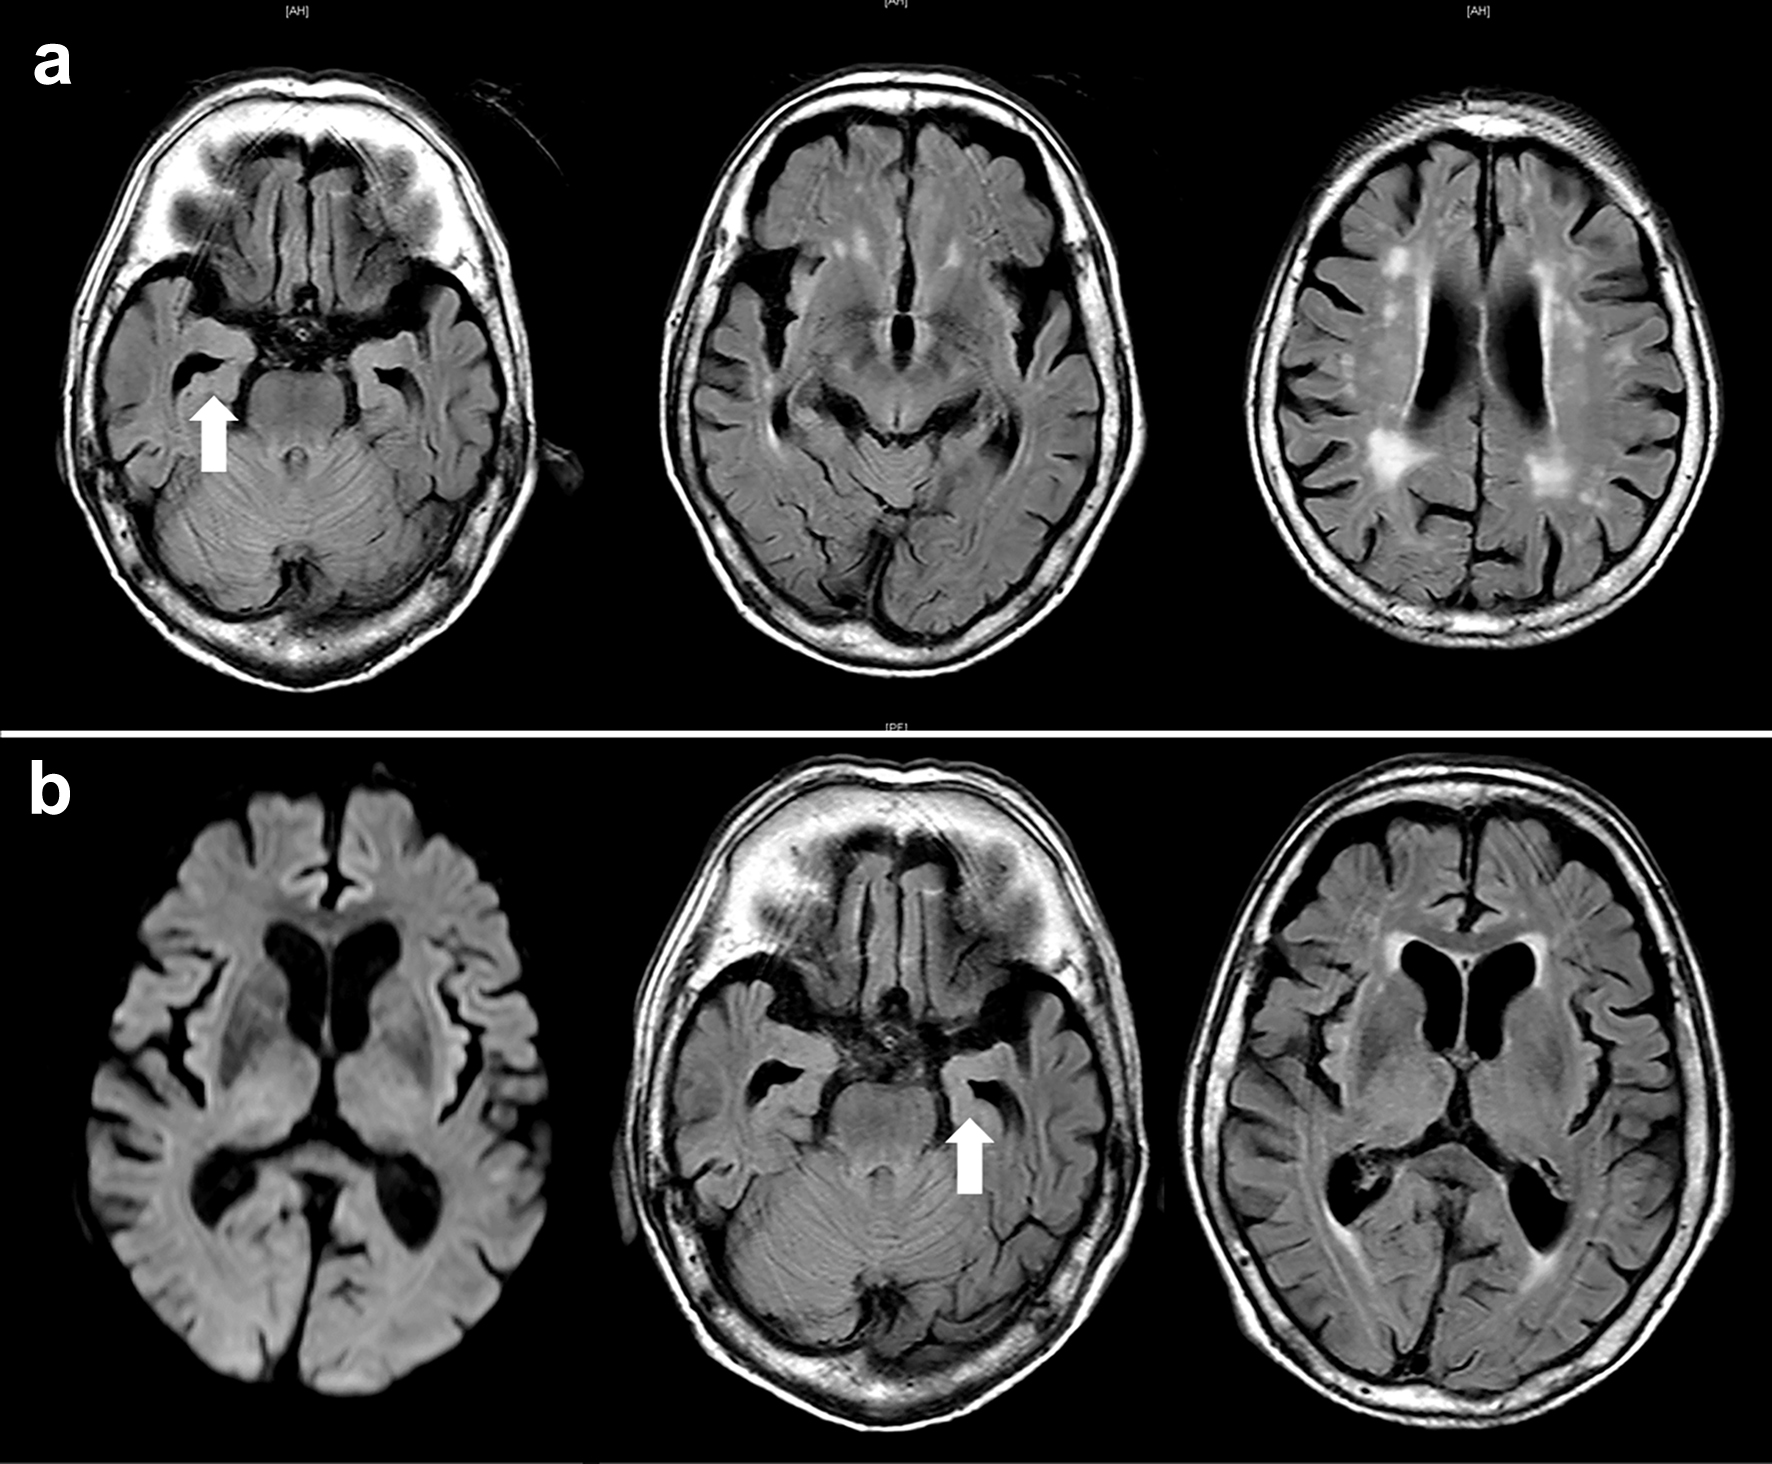
Figure 1. Axial view of brain magnetic resonance imaging (MRI). (a) Approximately 2 months before admission, fluid-attenuated inversion recovery images show atrophy of the brain cortex with significant hippocampal atrophy in the medial temporal lobe, indicating Alzheimer’s disease. Mild periventricular white matter lesions are observed. (b) MRI image of the brain on admission. Diffusion-weighted imaging shows no apparent abnormalities. FLAIR images also show findings similar to the previous ones. No lesions in the brain are observed that would cause impaired consciousness. The arrows indicate hippocampal atrophy.
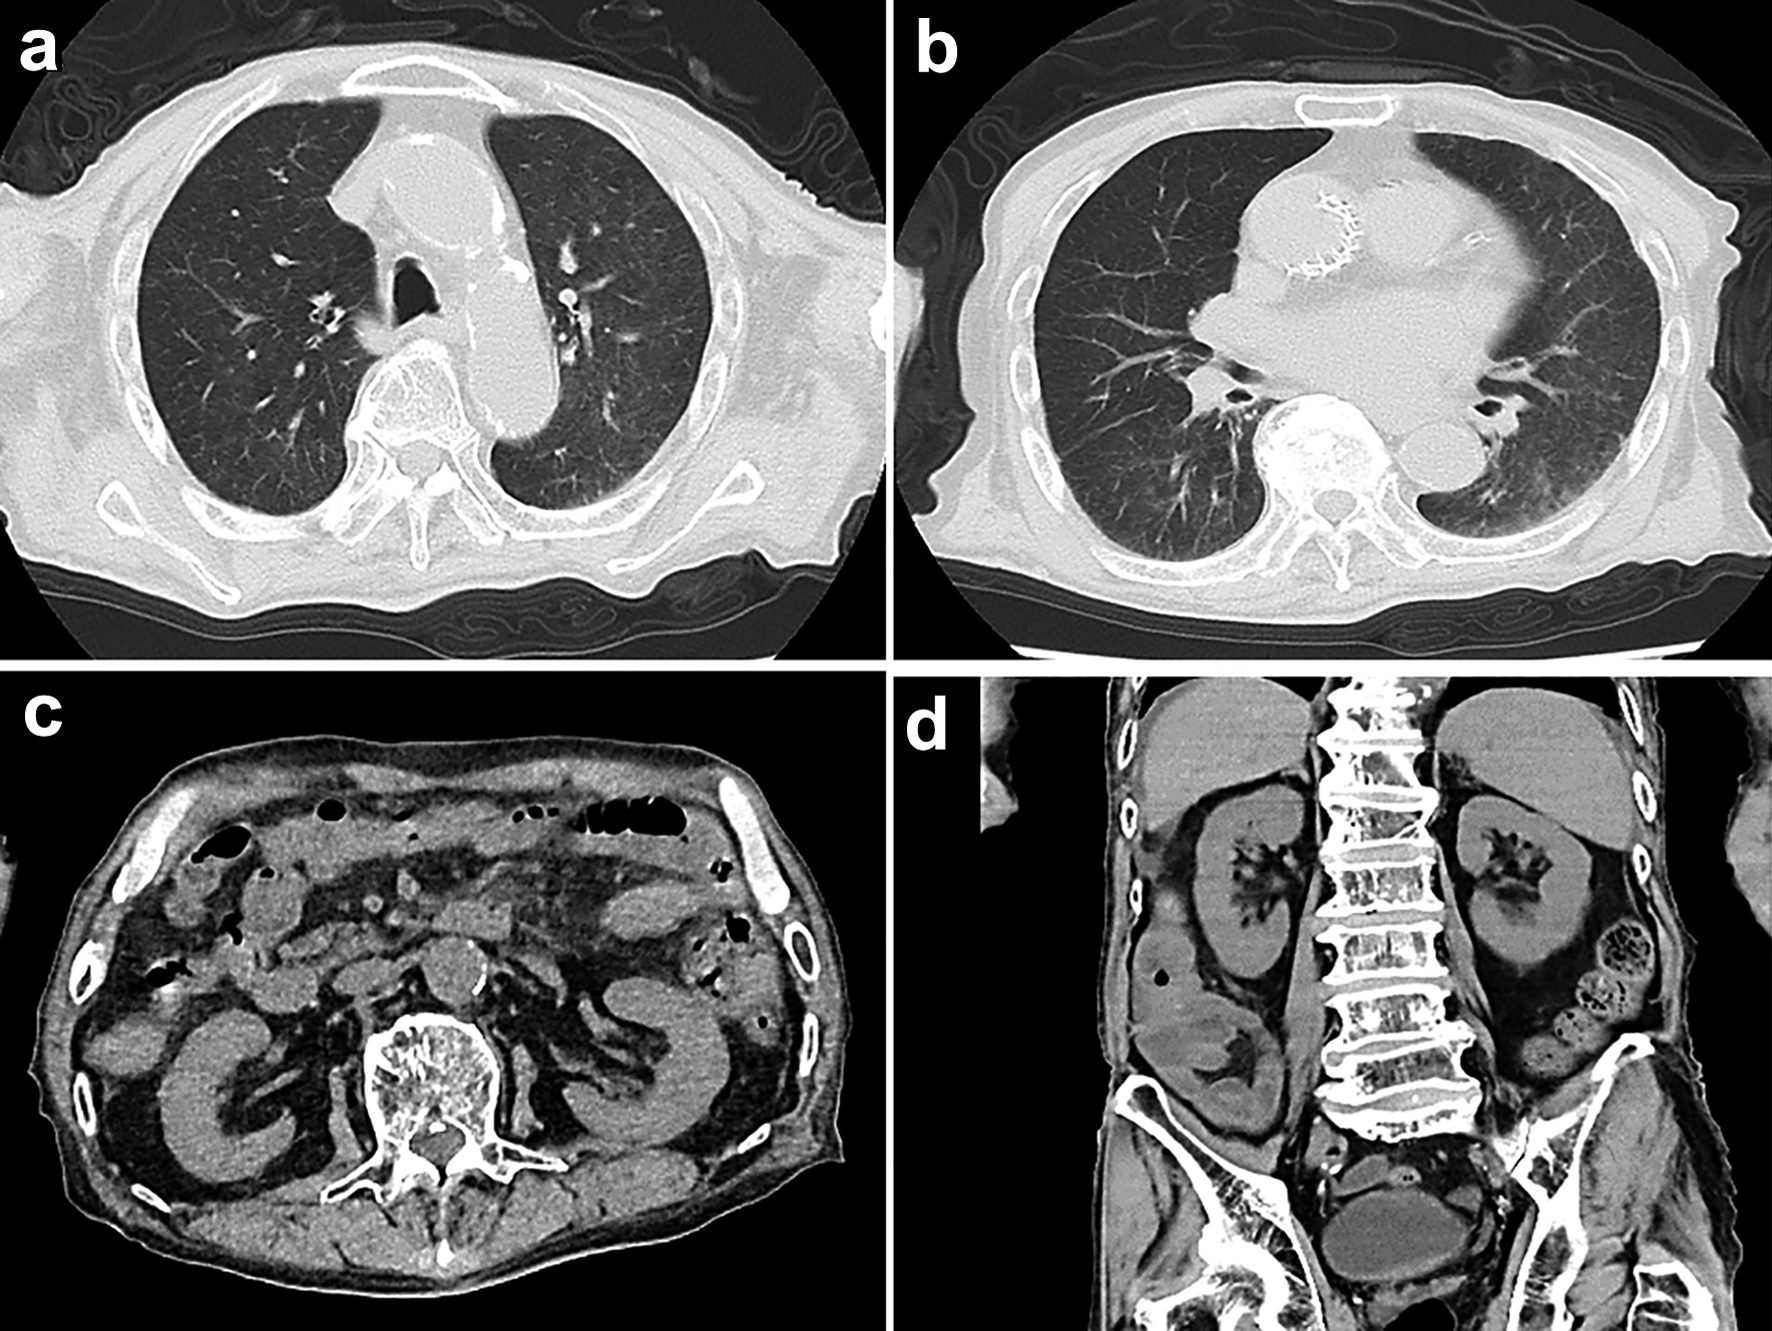
Figure 2. Computed tomography (CT) scan images of the thorax and abdomen on admission. (a, b) Chest CT scan shows no signs of lesion in both lungs, but an enlarged left atrium and congestion in the heart are observed. (c, d) CT scan of the abdomen shows no obvious abnormal findings such as mass lesions or ascites.
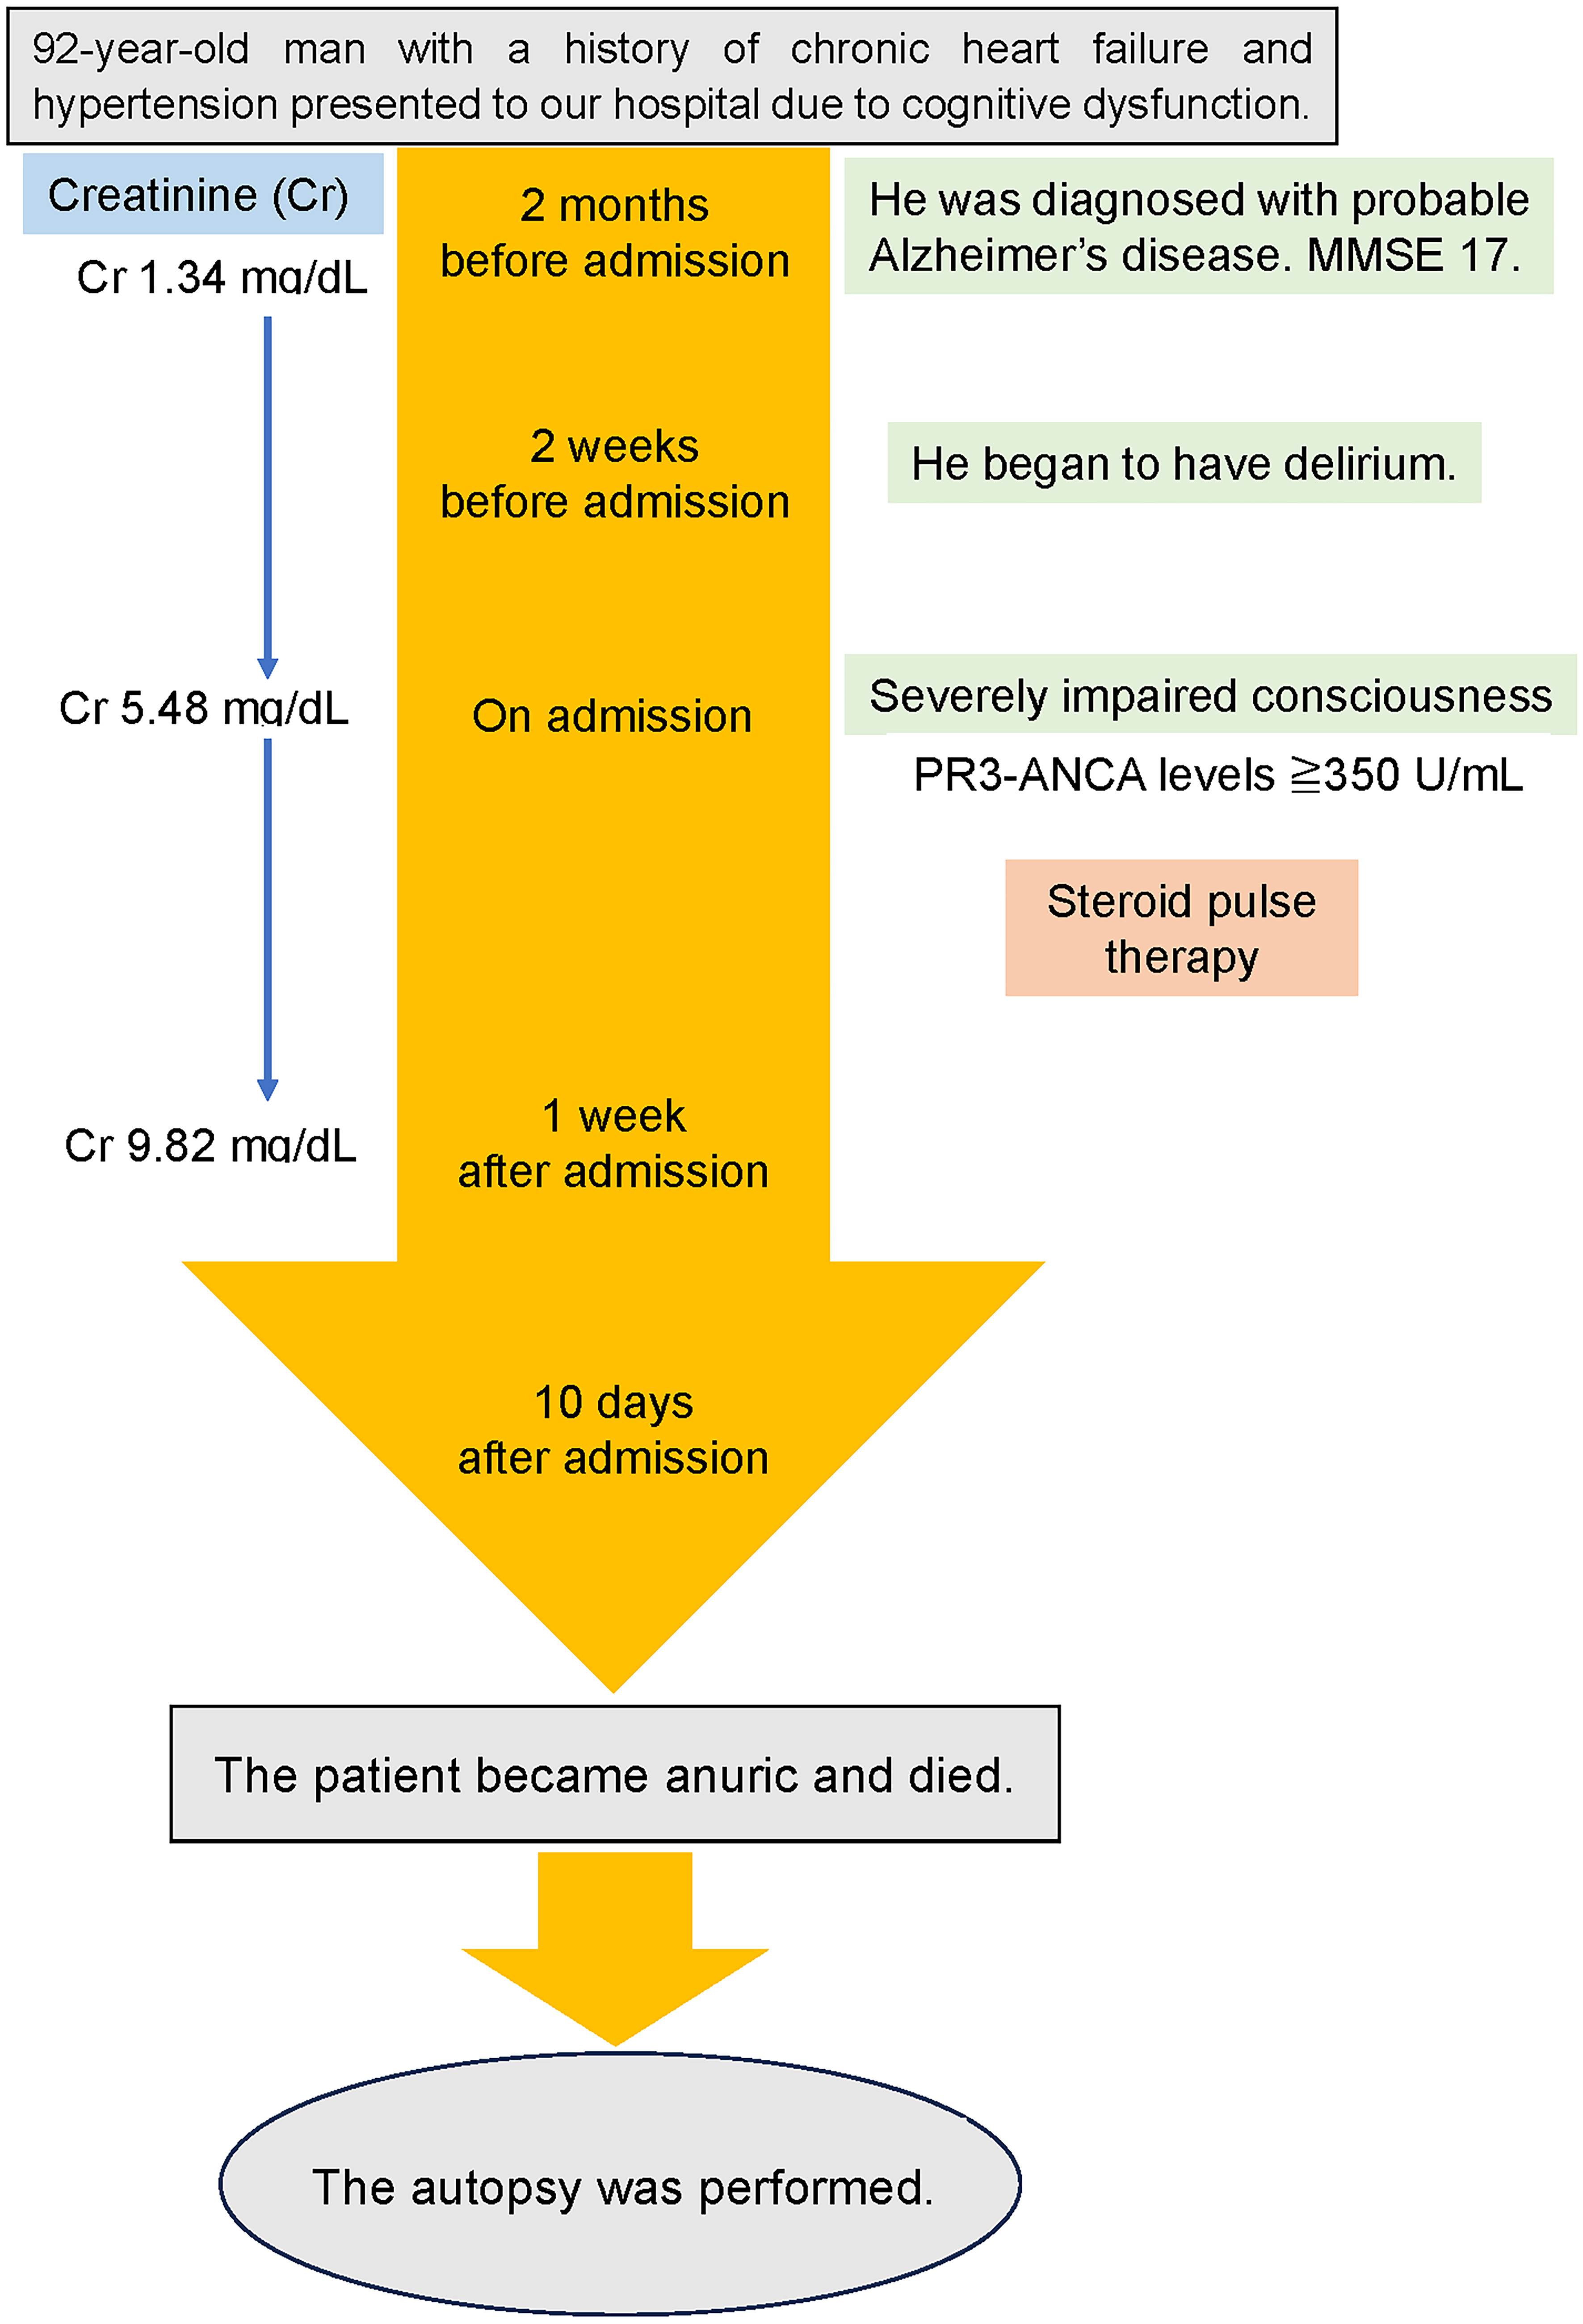
Figure 3. Timeline of this case report. MMSE: mini-mental state examination.
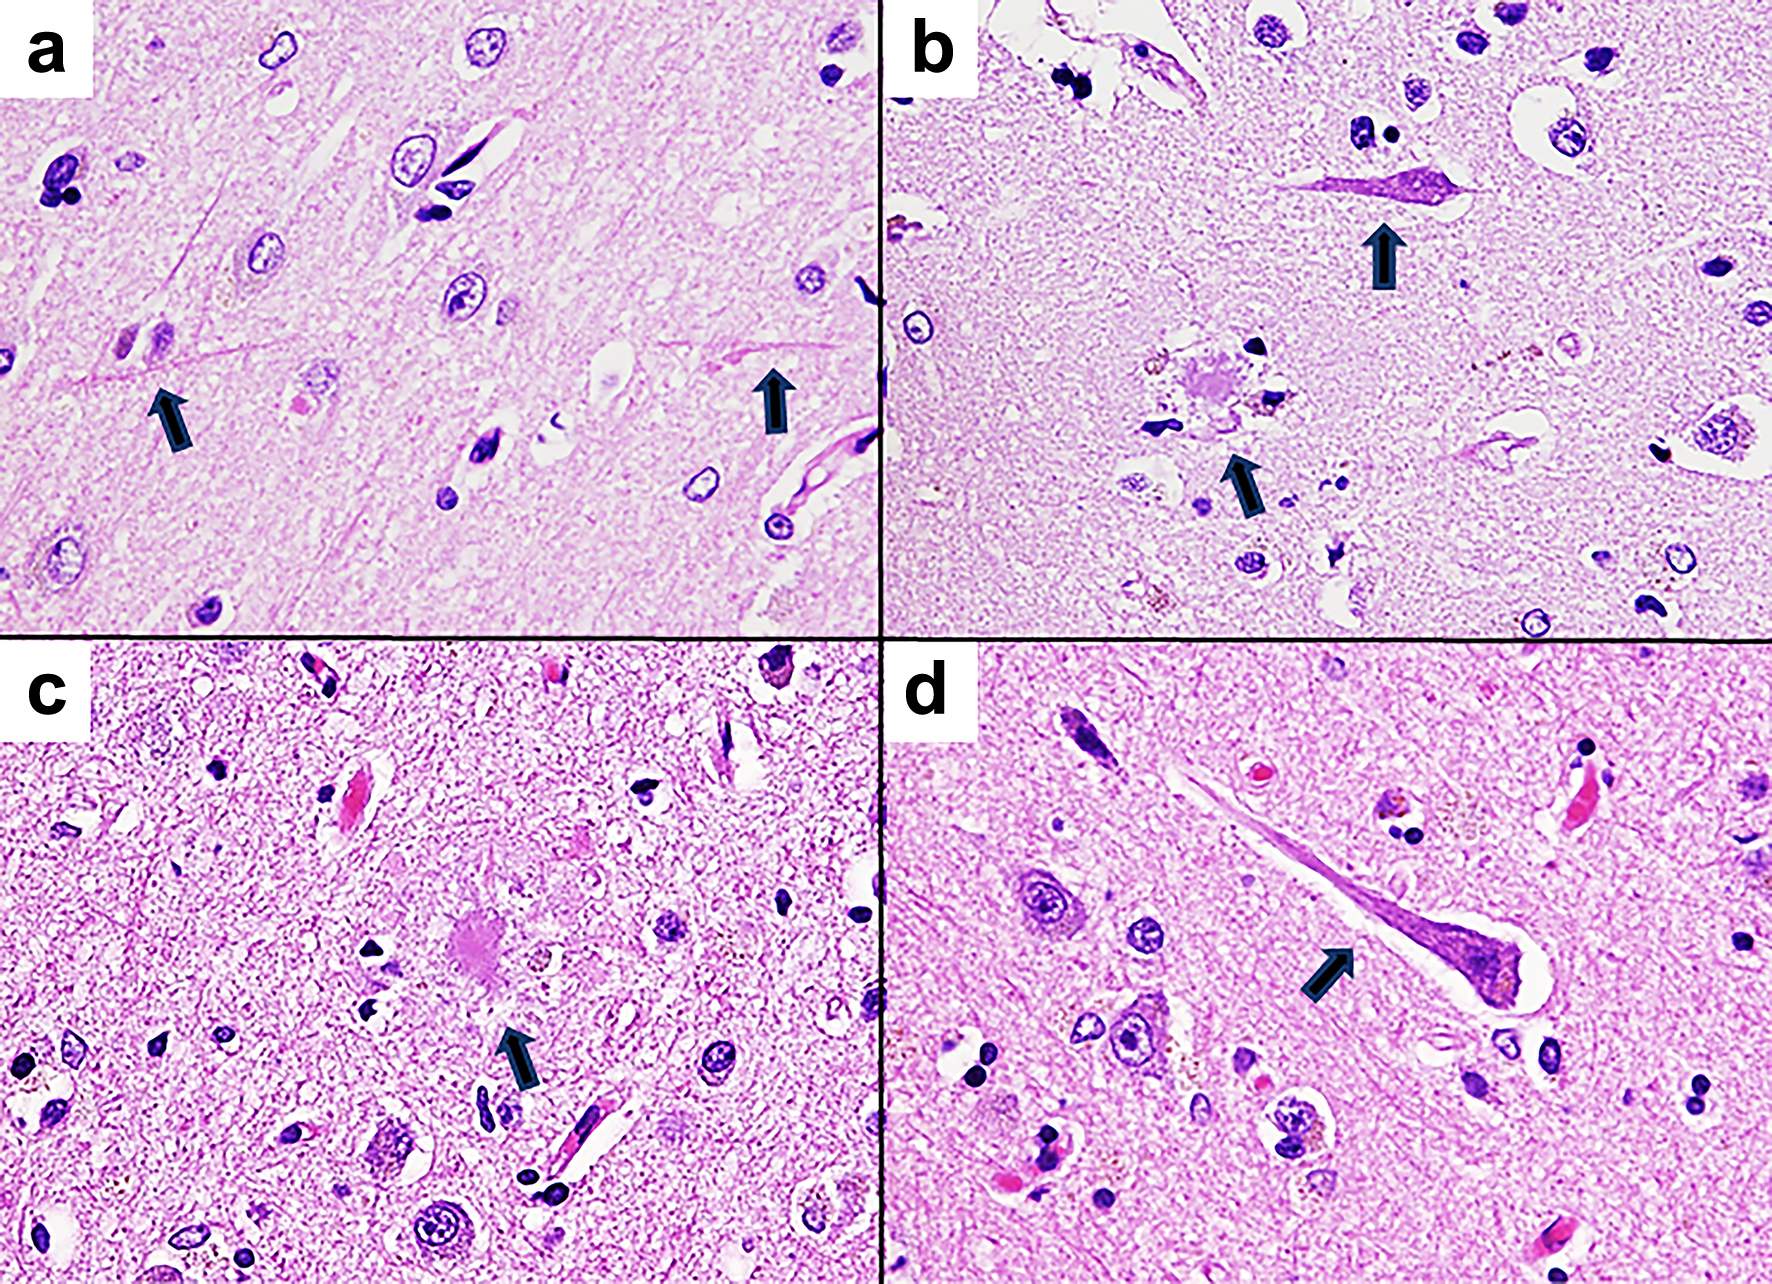
Figure 4. Pathological microscopic images of the brain tissue (hematoxylin and eosin staining, × 400). (a) Neuropil threads are observed in the cortical tissue of the frontal lobe. The arrows indicate neuropil threads. (b) In the cortical tissue of the hippocampus, senile plaques and neurofibrillary tangles are observed. The senile plaque appears to be a neuritic plaque with surrounding neurites. The arrows indicate senile plaque and neurofibrillary tangle. (c) Senile plaque of the cortical tissue of the parietal lobe. The arrow indicates senile plaque. (d) Neurofibrillary tangle of the cortical tissue in the parietal lobe. The arrow indicates neurofibrillary tangle.
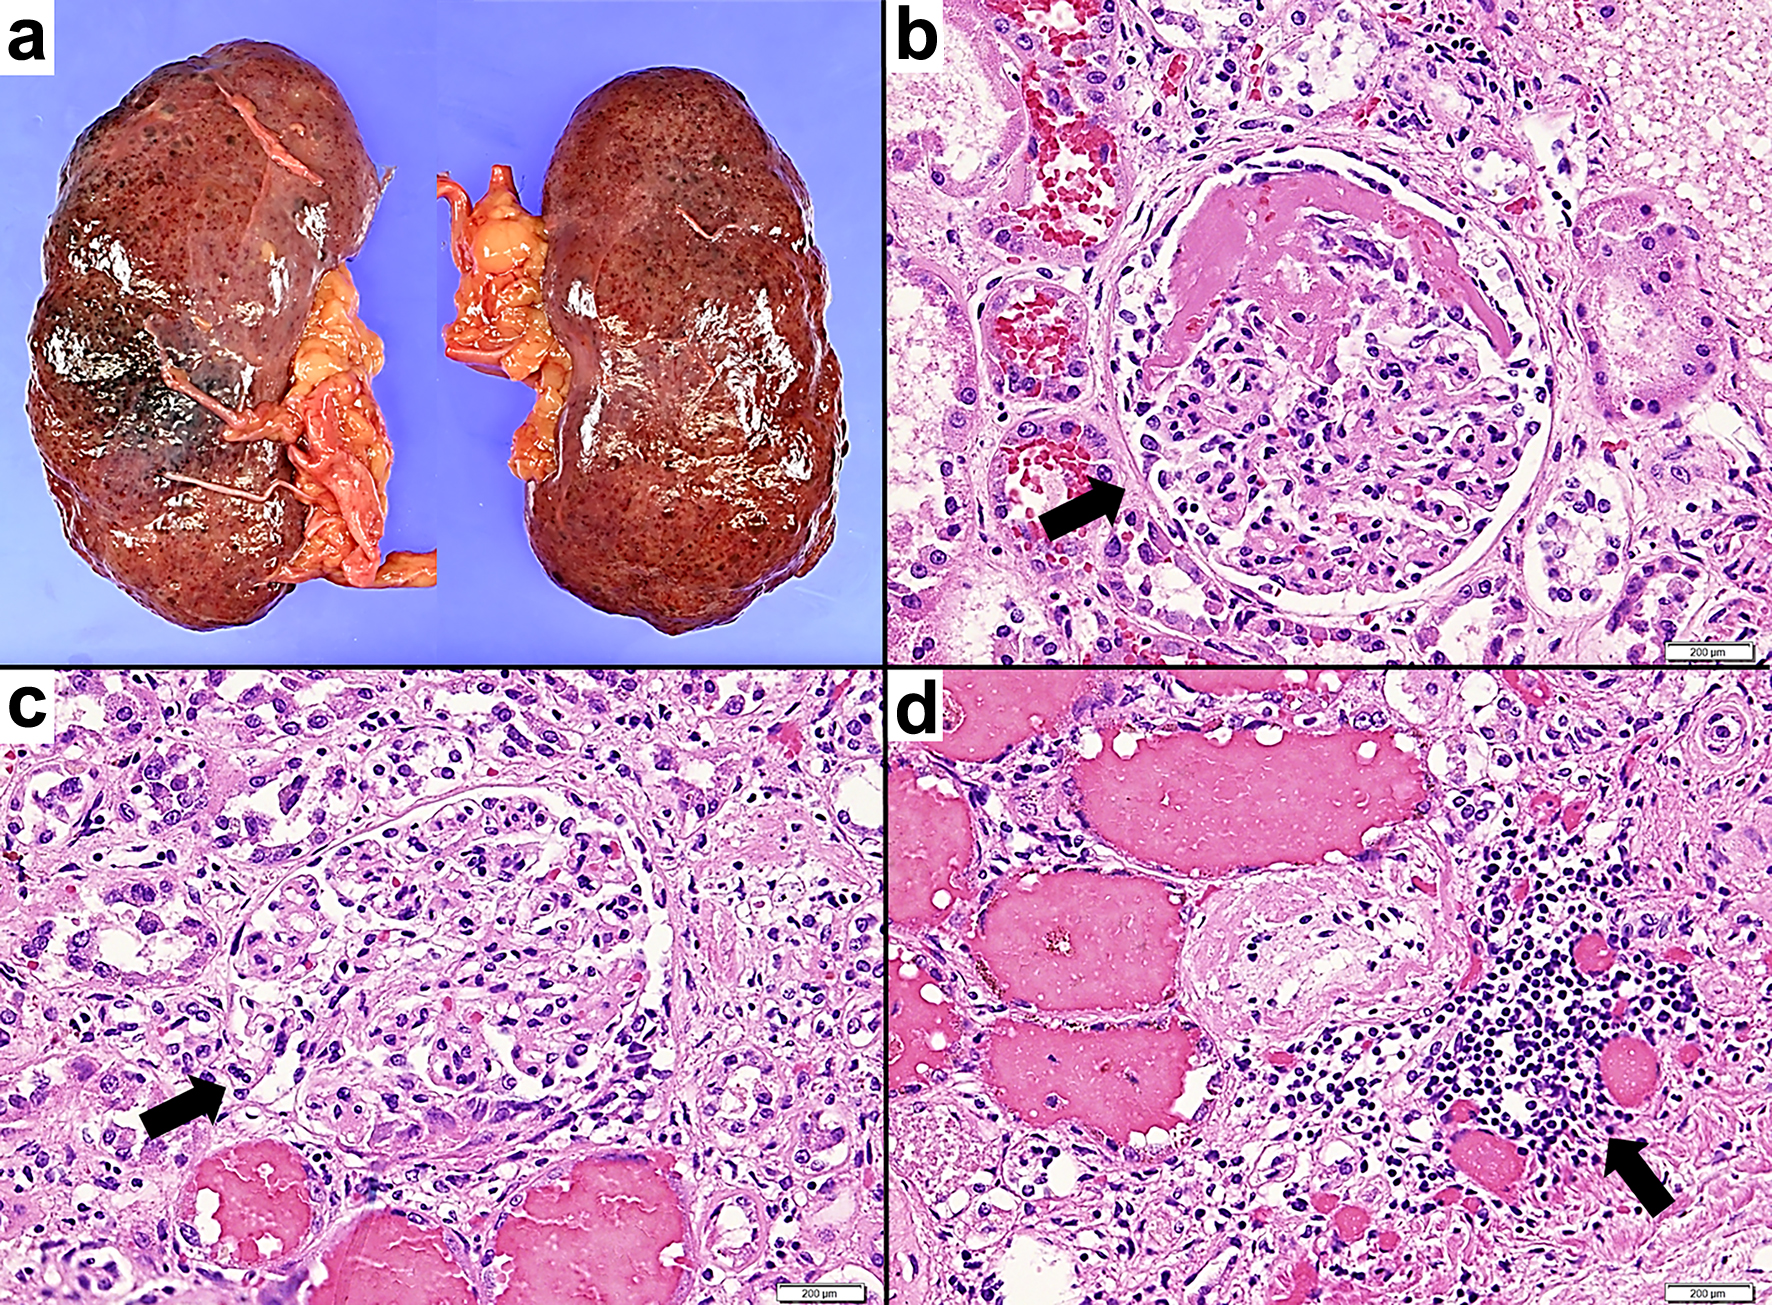
Figure 5. Pathological macroscopic and microscopic images of the kidney tissue. (a) The fresh both kidneys exhibit turbid coloration and swelling. (b, c) Hematoxylin and eosin staining, × 400. (b) Glomerular lesions exhibiting fibrous crescent formation are observed. The arrow indicates fibrous crescentic glomerulonephritis. (c) Glomerular lesions exhibiting cellular crescent formation are observed. Inflammatory cells including neutrophils accumulate in areas demonstrating fibrin precipitation and loop rupture. The arrow indicates cellular crescentic glomerulonephritis. (d) Hematoxylin and eosin staining, × 200. Inflammatory cells such as lymphocytes and neutrophils accumulate in the tubulointerstitium. The arrow indicates peritubular inflammatory cell infiltration.
Table
Table 1. Laboratory Data
| Variable (normal range) | Results |
|---|
| 2 months before admission | On admission | 1 week after admission |
|---|
| BUN: blood urea nitrogen; CMV: cytomegalovirus; CPK: creatine phosphokinase; Cr: creatinine; CRP: C-reactive protein; ELISA: enzyme-linked immunosorbent assay; HPF: high power field; MPO: myeloperoxidase; NT-proBNP: N-terminal pro-B-type natriuretic peptide; RBC: red blood cell; WBC: white blood cell; WF: whole field. |
| Blood examination | | | |
| WBC (3.3 - 8.6 × 10³/µL) | 7.3 × 10³/µL | 5.9 × 10³/µL | 3.5 × 10³/µL |
| Hemoglobin (11.2 - 15.2 g/dL) | 9.6 g/dL | 6.8 g/dL | 5.1 g/dL |
| Platelets (158 - 348 × 103/µL) | 100 × 103/µL | 52 × 103/µL | 23 × 103/µL |
| Albumin (4.1 - 5.1 g/dL) | 2.7 g/dL | 2.1 g/dL | 1.7 g/dL |
| CPK (59 - 248 U/L) | | 78 U/L | 284 U/L |
| BUN (8 - 20 mg/dL) | 24.2 mg/dL | 73.8 mg/dL | 126.0 mg/dL |
| Cr (0.65 - 1.70 mg/dL) | 1.34 mg/dL | 5.48 mg/dL | 9.82 mg/dL |
| Na (138 - 145 mmol/L) | 135 mmol/L | 137 mmol/L | 147 mmol/L |
| K (3.6 - 4.8 mmol/L) | 4.0 mmol/L | 5.5 mmol/L | 4.8 mmol/L |
| Cl (101 - 108 mmol/L) | 106 mmol/L | 103 mmol/L | 111 mmol/L |
| Ca (8.8 - 10.1 mg/dL) | | 7.8 mg/dL | 7.9 mg/dL |
| Glucose (73 - 109 mg/dL) | 138 mg/dL | 103 mg/dL | 161 mg/dL |
| CRP (< 0.14 mg/dL) | 0.39 mg/dL | 5.89 mg/dL | 7.55 mg/dL |
| Troponin T (< 14.0 pg/dL) | | 5.89 pg/dL | 161.0 pg/mL |
| NT-proBNP (< 125.0 pg/dL) | 1,329 pg/mL | 1,052 pg/mL | 46,835 pg/mL |
| Hepatitis B surface antigen | | Negative | |
| Hepatitis C virus antibody | | Negative | |
| Blood CMV pp65 antigenemia | | Negative | |
| Antinuclear antibody titers (< 1:40) | | 1:40 (cytoplasmic) | |
| Anti-PR3 antibody (ELISA) (< 3.5 U/mL) | | | ≥ 350 U/mL |
| Anti-MPO antibody (ELISA) (< 3.5 U/mL) | | | < 0.1 U/mL |
| Urine examination | | | |
| Clarity | Straw | Red | |
| pH (4.8 - 7.5) | 6.0 | 8.0 | |
| Urine specific gravity (1.008 - 1.034) | 1.020 | 1.009 | |
| Protein (-) | - | 2+ | |
| WBC (1 - 4/HPF) | 1 - 4/HPF | 1 - 4/HPF | |
| RBC (5 - 9/HPF) | 5 - 9/HPF | ≥ 100/HPF | |
| Squamous epithelium (< 1/HPF) | 1 - 4/HPF | 1 - 4/HPF | |
| Hyaline casts (< 1/WF) | | 1/WF | |


