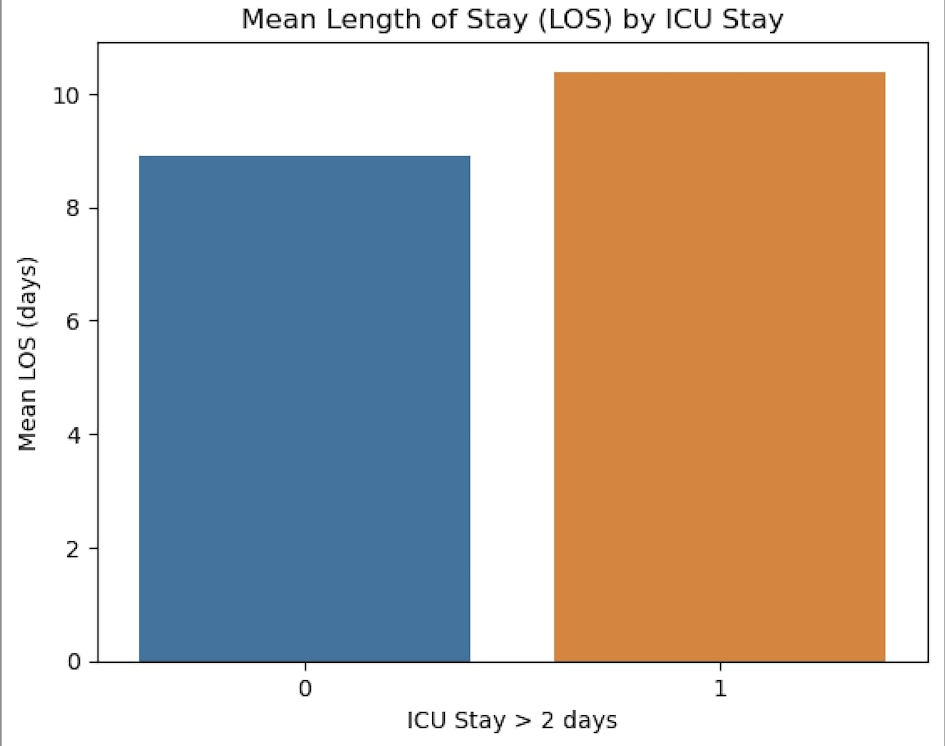
↓ Figure 1. The mean length of hospital stays in
the two groups. ICU: intensive care unit.
| Journal of Clinical Medicine Research, ISSN 1918-3003 print, 1918-3011 online, Open Access |
| Article copyright, the authors; Journal compilation copyright, J Clin Med Res and Elmer Press Inc |
| Journal website https://jocmr.elmerjournals.com |
Original Article
Volume 17, Number 1, January 2025, pages 14-21
Predicting Extended Intensive Care Unit Stay Following Coronary Artery Bypass Grafting and Its Impact on Hospitalization and Mortality
Figure
Tables
| Total (1,395) | ICU > 2 days (313) | ICU < 2 days (1,082) | P value | |
|---|---|---|---|---|
| aStudent’s t-test. ICU: intensive care unit; BMI: body mass index. | ||||
| Age, years | 59.3 (9.98) | 61.5 (10.4) | 58.7 (9.77) | < 0.001a |
| ≥ 70 years, n | 222 (15.9%) | 71 (22.7%) | 151 (14.0%) | < 0.001 |
| Sex | ||||
| Male, n | 1,081 (77.5%) | 249 (79.6%) | 832 (76.9%) | 0.321 |
| BMI, kg/m2 | 26.4 (4.90) | 26.7 (4.34) | 26.3 (5.05) | 0.158a |
| Underweight, n | 46 | 5 (31.6%) | 41 (3.8%) | 0.056 |
| Healthy weight, n | 495 | 99 (31.6%) | 396 (36.6%) | 0.106 |
| Overweight but not obese, n | 581 | 144 (46.0%) | 437 (40.4%) | 0.076 |
| Obese class I, n | 186 | 46 (14.7%) | 140 (12.9%) | 0.421 |
| Obese class II, n | 52 | 12 (3.8%) | 40 (3.7%) | 0.910 |
| Obese class III, n | 9 | 1 (0.3%) | 8 (0.7%) | 0.414 |
| Total (1,395) | ICU > 2 days (313) | ICU < 2 days (1,082) | P value | |
|---|---|---|---|---|
| ICU: intensive care unit; MI: myocardial infarction; COPD: chronic obstructive pulmonary disease; CAD: coronary artery disease; TIA: transient ischemic attack; NYHA: New York Heart Association; ACE: angiotensin-converting enzyme; PVD: peripheral vascular disease. | ||||
| Recent MI (< 30 days) | 284 (20.4%) | 94 (30.0%) | 190 (17.6%) | < 0.001 |
| Smoking | 796 (57.1%) | 199 (63.6%) | 597 (55.2%) | 0.008 |
| COPD/asthma | 176 (12.6%) | 55 (17.6%) | 121 (11.2%) | 0.003 |
| Hypertension | 930 (66.7%) | 212 (67.7%) | 718 (66.4%) | 0.650 |
| Hyperlipidemia | 766 (54.9%) | 171 (54.6%) | 595 (55.0%) | 0.911 |
| Diabetes mellitus | 744 (53.3%) | 167 (53.4%) | 577 (53.3%) | 0.993 |
| Family history of CAD | 564 (40.4%) | 138 (44.1%) | 426 (39.4%) | 0.134 |
| Previous (stroke/TIA) | 120 (8.6%) | 29 (9.3%) | 91 (8.4%) | 0.635 |
| NYHA III, IV | 289 (20.7%) | 70 (22.4%) | 219 (20.2%) | 0.414 |
| PVD | 213 (15.3%) | 57 (18.2%) | 156 (14.4%) | 0.100 |
| Preoperative atrial fibrillation | 67 (4.8%) | 27 (8.6%) | 40 (3.7%) | < 0.001 |
| Preoperative renal impairment | 101 (7.2%) | 35 (11.2%) | 66 (6.1%) | 0.002 |
| Clopidogrel | 121 (8.7%) | 33 (10.5%) | 88 (8.1%) | 0.182 |
| B-blockers | 645 (46.2%) | 144 (46.0%) | 501 (46.3%) | 0.926 |
| ACE inhibitors | 626 (44.9%) | 142 (45.4%) | 484 (44.7%) | 0.842 |
| Statins | 654 (46.9%) | 146 (46.6%) | 508 (47.0%) | 0.924 |
| Predictor | Odds ratio | Lower | Upper | P |
|---|---|---|---|---|
| CPB: cardiopulmonary bypass; EF: ejection fraction; IABP: intra-aortic balloon pump; MR: mitral regurgitation; ICU: intensive care unit; BMI: body mass index; LM: left main (coronary artery). | ||||
| MR grade 1-2 | 1.10 | 0.831 | 1.468 | 0.492 |
| LM > 70% | 0.71 | 0.479 | 1.077 | 0.11 |
| EF > 50% | References | - | - | - |
| EF 40-49% | 0.93 | 0.751 | 1.366 | 0.934 |
| EF 30-39% | 0.22 | 0.521 | 1.162 | 0.220 |
| EF < 30% | 0.07 | 0.945 | 4.049 | 0.071 |
| Preoperative coronary stents | 1.69 | 1.108 | 2.579 | 0.015 |
| Preoperative IABP | 2.49 | 0.786 | 7.91 | 0.121 |
| Emergency/urgent | 2.19 | 1.602 | 3.003 | < 0.001 |
| CPB time (> 120 min) | 0.98 | 0.723 | 1.34 | 0.92 |
| Aorta cross clamp (> 90 min) | 0.91 | 0.573 | 1.463 | 0.712 |
| Exploration for postoperative bleeding | 1.73 | 1.084 | 2.775 | 0.022 |
| Prolonged vasopressor support | 5.92 | 3.797 | 9.239 | < 0.001 |
| Postoperative renal impairment | 6.78 | 4.486 | 10.261 | < 0.001 |
| Pneumonia/sepsis | 8.91 | 4.486 | 16.004 | < 0.001 |
| BMI | 1.01 | 0.993 | 1.043 | 0.161 |
| Age | 1.03 | 1.017 | 1.045 | < 0.001 |
| Intraoperative blood transfusion | 1.57 | 1.22 | 2.038 | < 0.001 |
| Odds ratio | Lower | Upper | P | |
|---|---|---|---|---|
| ICU: intensive care unit; TIA: transient ischemic attack. | ||||
| Postoperative stroke/TIA | 3.27 | 1.48047 | 7.2594 | 0.003 |
| Sternal infection | 1.003 | 0.682 | 1.475 | 0.987 |
| Pneumonia/sepsis | 8.91 | 4.96822 | 16.0040 | < 0.001 |
| Mortality | 3.08 | 1.9605 | 4.8681 | < 0.001 |