| Age (year) |
67.5 ± 13.0 |
|
|
|
|
| Male (%) |
43.8 |
|
|
|
|
| Height (cm) |
159.1 ± 10.1 |
|
|
|
|
| Weight (kg) |
64.4 ± 11.0 |
|
|
|
|
| BMI (kg/m2) |
25.4 ± 3.2 |
|
|
|
|
| Duration of diabetes (year) |
11.3 ± 13.1 |
|
|
|
|
| Concomitant anti-diabetic medications |
|
|
|
|
|
| Metformin (%) |
56.3 |
|
|
|
|
| DPP-4i (%) |
37.5 |
|
|
|
|
| SGLT2i (%) |
25 |
|
|
|
|
| GLP-1RA (%) |
12.5 |
|
|
|
|
| Sulfonylurea (%) |
12.5 |
|
|
|
|
| Glinide (%) |
6.3 |
|
|
|
|
| α-glucosidase inhibitor (%) |
0 |
|
|
|
|
| Complications |
|
|
|
|
|
| Retinopathy (NDR/NPDR/PPDR/PDR) (%) |
87.5/12.5/0/0 |
|
|
|
|
| Nephropathy (stage 1/2/3/4/5) (%) |
68.5/26.3/5.2/0/0 |
|
|
|
|
| Coronary artery disease (%) |
12.5 |
|
|
|
|
| Body weight (kg) |
64.4 ± 11.0 |
63.4 ± 10.1 |
|
0.80 |
|
| BMI (kg/m2) |
25.4 ± 3.2 |
25.0 ± 3.0 |
|
0.74 |
|
| Waist-hip ratio |
0.97 ± 0.04 |
0.96 ± 0.04 |
|
< 0.05 |
|
| HbA1c (%) |
7.3 ± 0.7 |
7.0 ± 0.6 |
6.7 ± 0.4 |
< 0.01 |
< 0.001 |
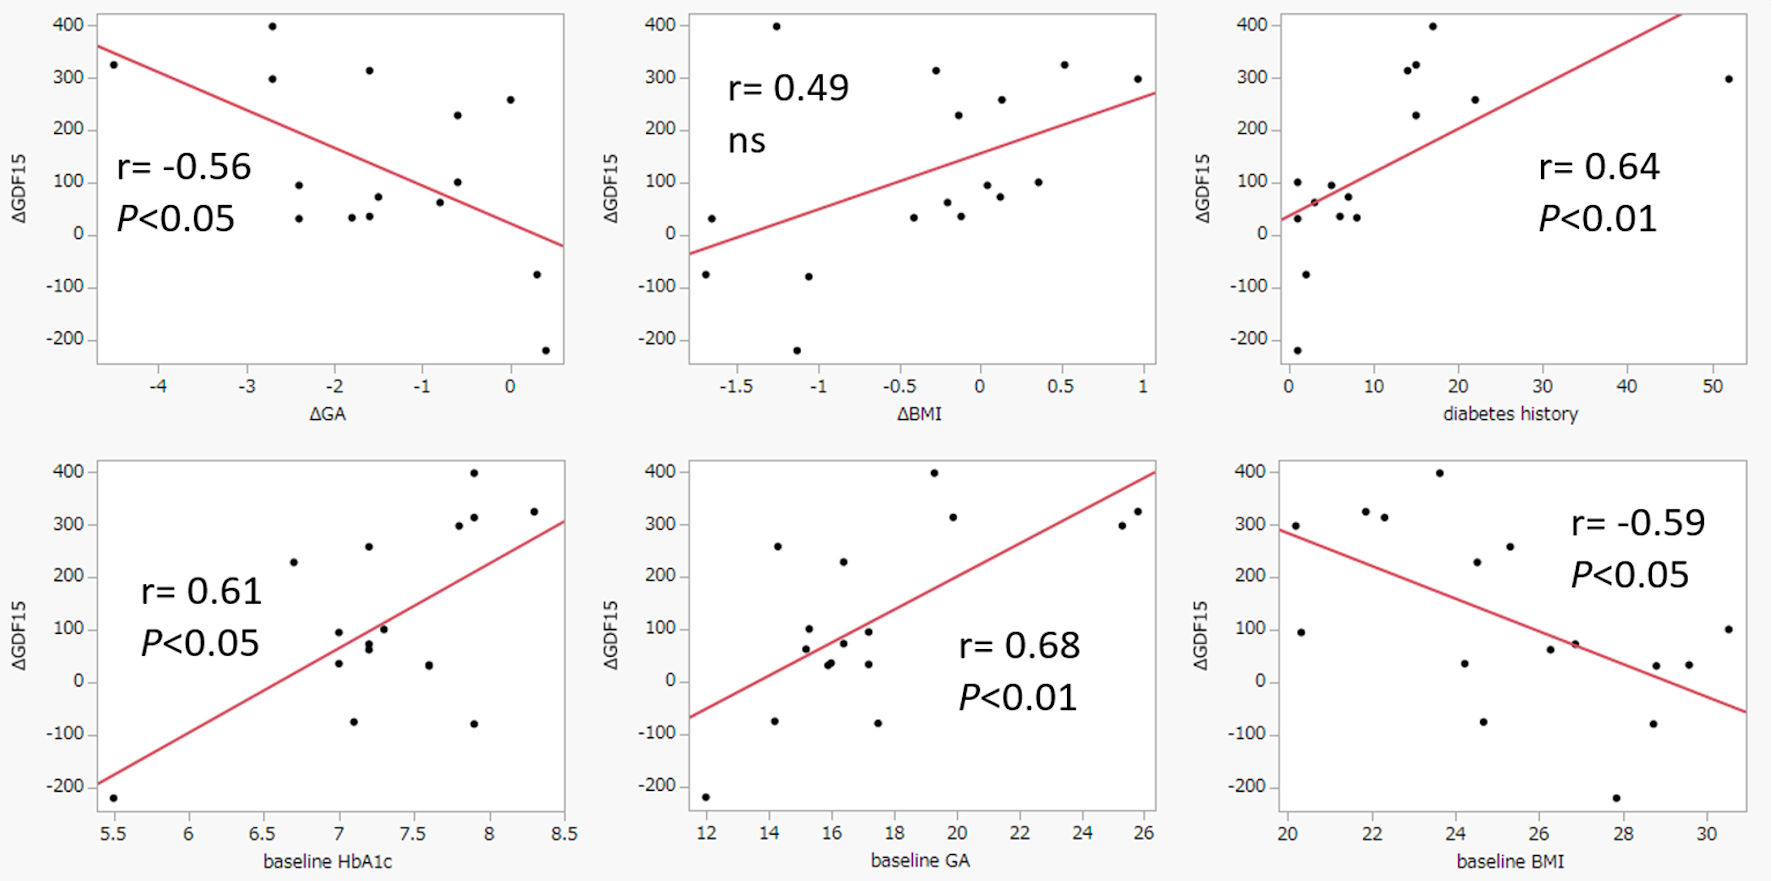
| GA (%) |
17.4 ± 3.7 |
15.9 ± 2.8 |
15.1 ± 1.9 |
< 0.001 |
< 0.05 |
| Fasting CPI |
1.6 ± 0.6 |
2.3 ± 1.5 |
|
< 0.01 |
|
| HOMA-β |
44.0 ± 35.6 |
66.9 ± 50.6 |
|
< 0.05 |
|
| HOMA-IR |
2.4 ± 1.4 |
3.2 ± 4.2 |
|
0.63 |
|
| QUICKI |
0.35 ± 0.04 |
0.34 ± 0.04 |
|
0.56 |
|
| AST (U/L) |
24.3 ± 9.4 |
24.8 ± 14.3 |
|
0.30 |
|
| ALT (U/L) |
30.6 ± 19.9 |
27.0 ± 16.1 |
|
0.16 |
|
| γGTP (U/L) |
28.4 ± 15.6 |
25.3 ± 14.0 |
|
0.23 |
|
| TG (mg/dL) |
143.8 ± 54.5 |
150.4 ± 66.2 |
|
0.62 |
|
| LDL-CHO (mg/dL) |
98.1 ± 27.1 |
101.2 ± 30.9 |
|
0.49 |
|
| HDL-CHO (mg/dL) |
57.7 ± 13.3 |
55.7 ± 12.6 |
|
0.41 |
|
| Cre (mg/dL) |
0.75 ± 0.13 |
0.79 ± 0.18 |
|
0.17 |
|
| Serum FGF21 (pg/mL) |
794.0 ± 1,236.2 |
483.1 ± 382.9 |
|
0.11 |
|
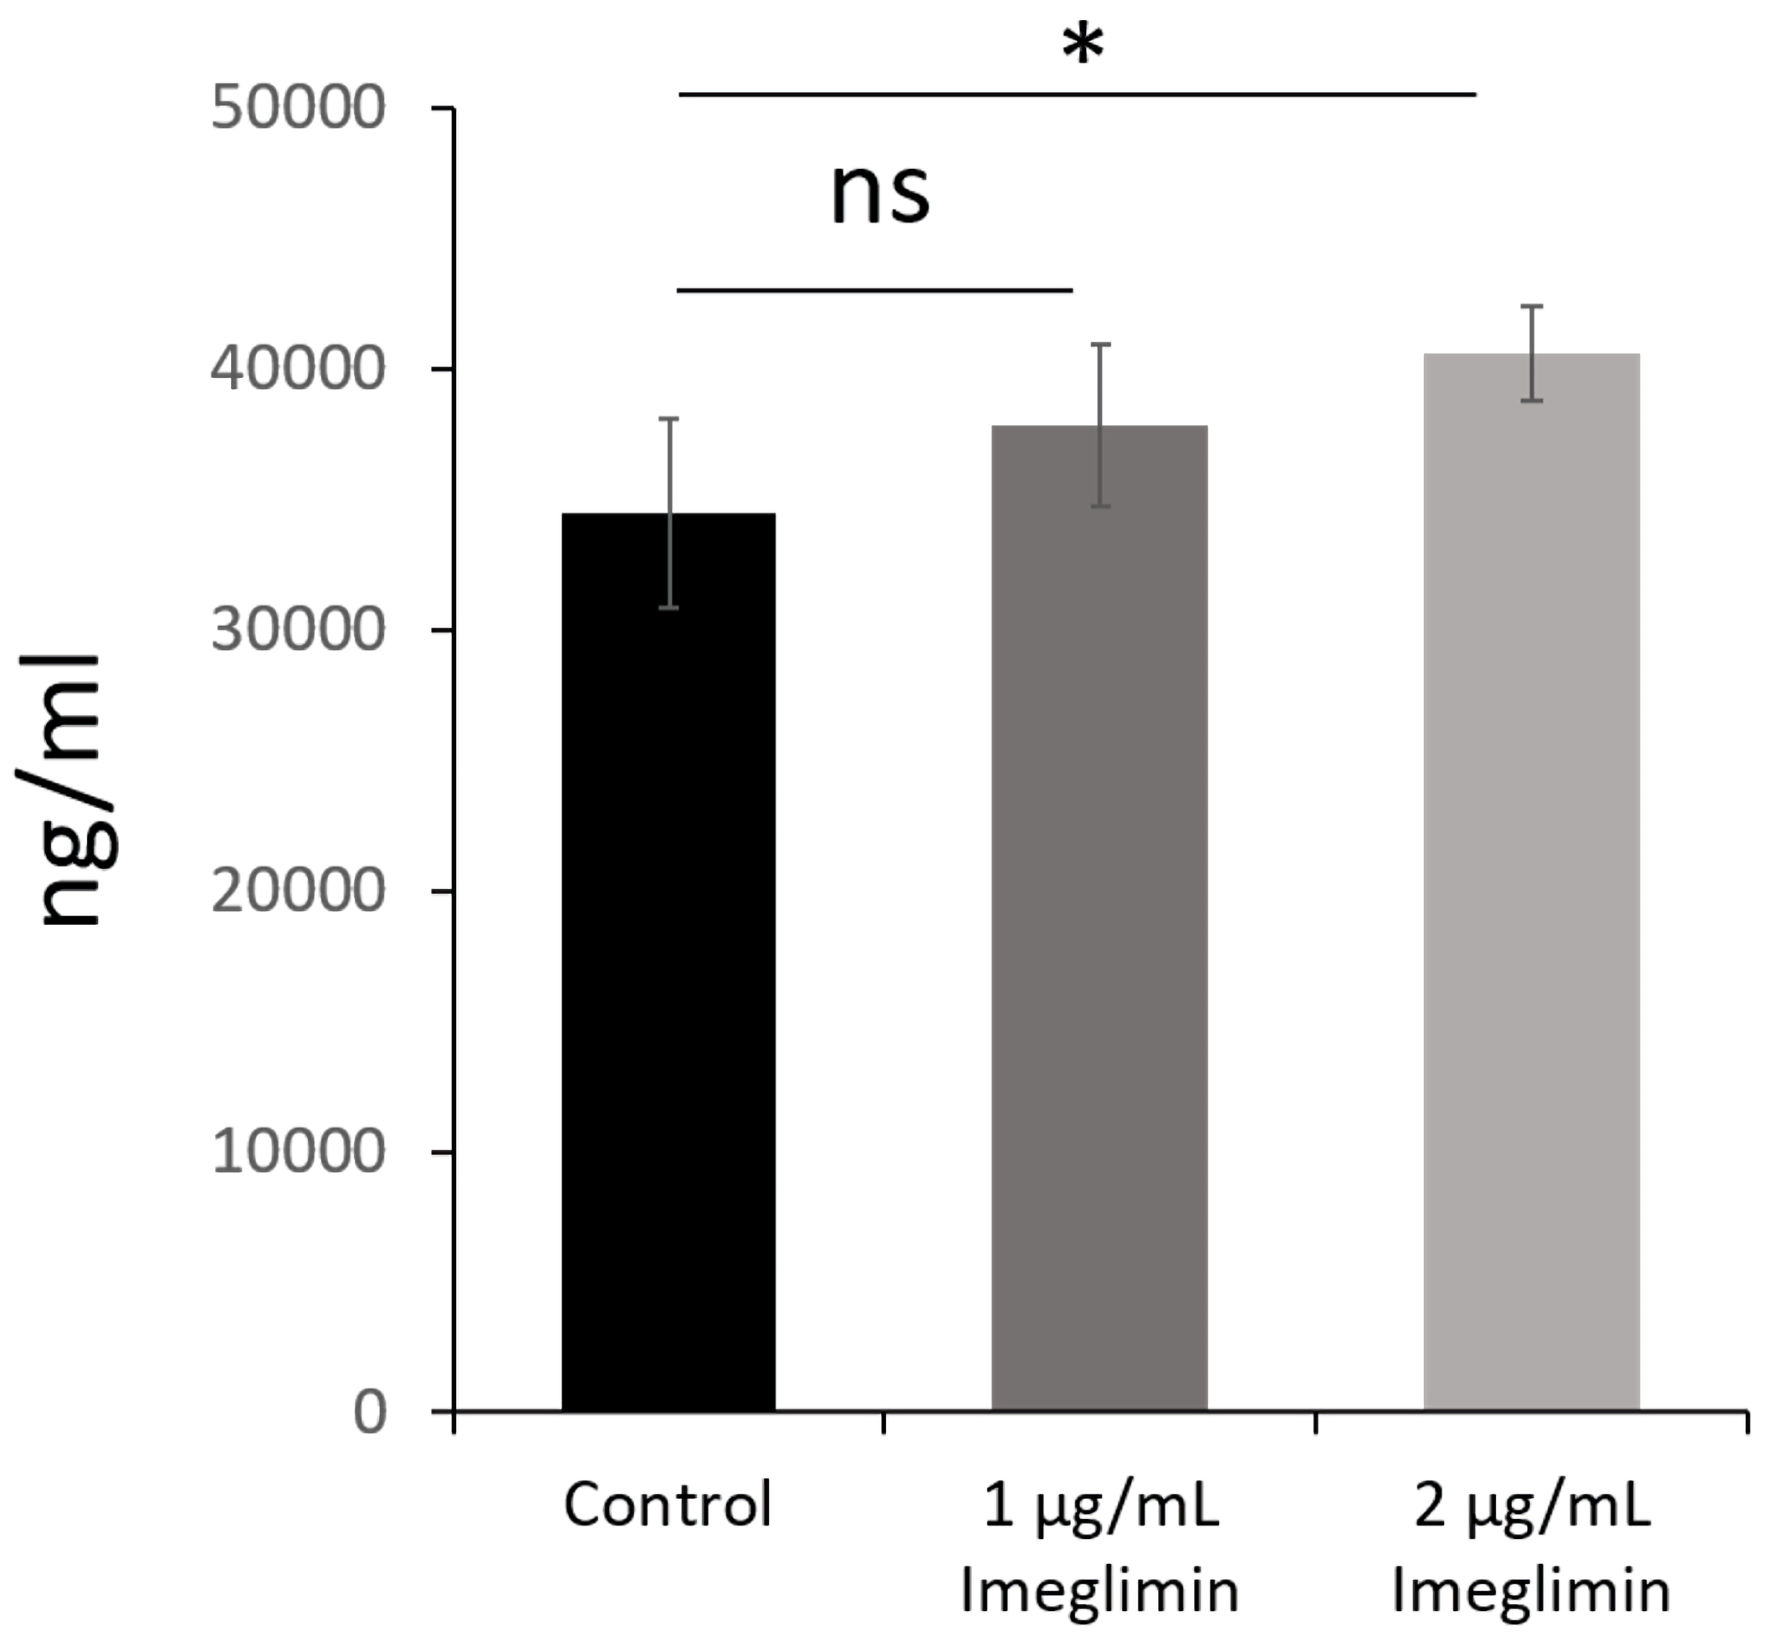
| Serum GDF15 (ng/mL) |
308.5 ± 134.0 |
425.7 ± 171.3 |
|
< 0.05 |
|
| Urine 8-OHdG (ng/mL) |
7.2 ± 3.5 |
7.0 ± 2.5 |
|
0.81 |
|
| Type IV collagen (ng/mL) |
3.4 ± 0.8 |
3.3 ± 0.8 |
|
0.33 |
|
| Ferritin (ng/mL) |
93.1 ± 57.7 |
89.5 ± 58.3 |
|
0.32 |
|
| CRP (mg/dL) |
0.17 ± 0.24 |
0.17 ± 0.25 |
|
0.77 |
|
| Skeletal muscle mass (kg) |
22.7 ± 5.4 |
22.7 ± 5.2 |
|
0.99 |
|
| Body fat percentage (%) |
31.5 ± 8.1 |
31.7 ± 9.6 |
|
0.97 |
|
| Resting metabolic rate (kcal) |
1,284.0 ± 319.9 |
1,198.0 ± 216.5 |
|
0.45 |
|
| Total energy expenditure (kcal) |
1,491.0 ± 371.4 |
1,391.3 ± 251.4 |
|
0.44 |
|
| Adverse effects of imeglimin during the study |
|
| Metabolic and nutritional disorders |
|
Loss of appetite (6.3%, n = 1/16) |
| Gastrointestinal disorders |
|
Diarrhea (18.8%, n = 3/16), nausea (6.3%, n = 1/16), constipation (6.3%, n = 1/16), soft
stool (6.3%, n = 1/16), abdominal bloating (6.3%, n = 1/16) |
| Laboratory abnormalities |
|
AST elevation (6.3%, n = 1/16) |