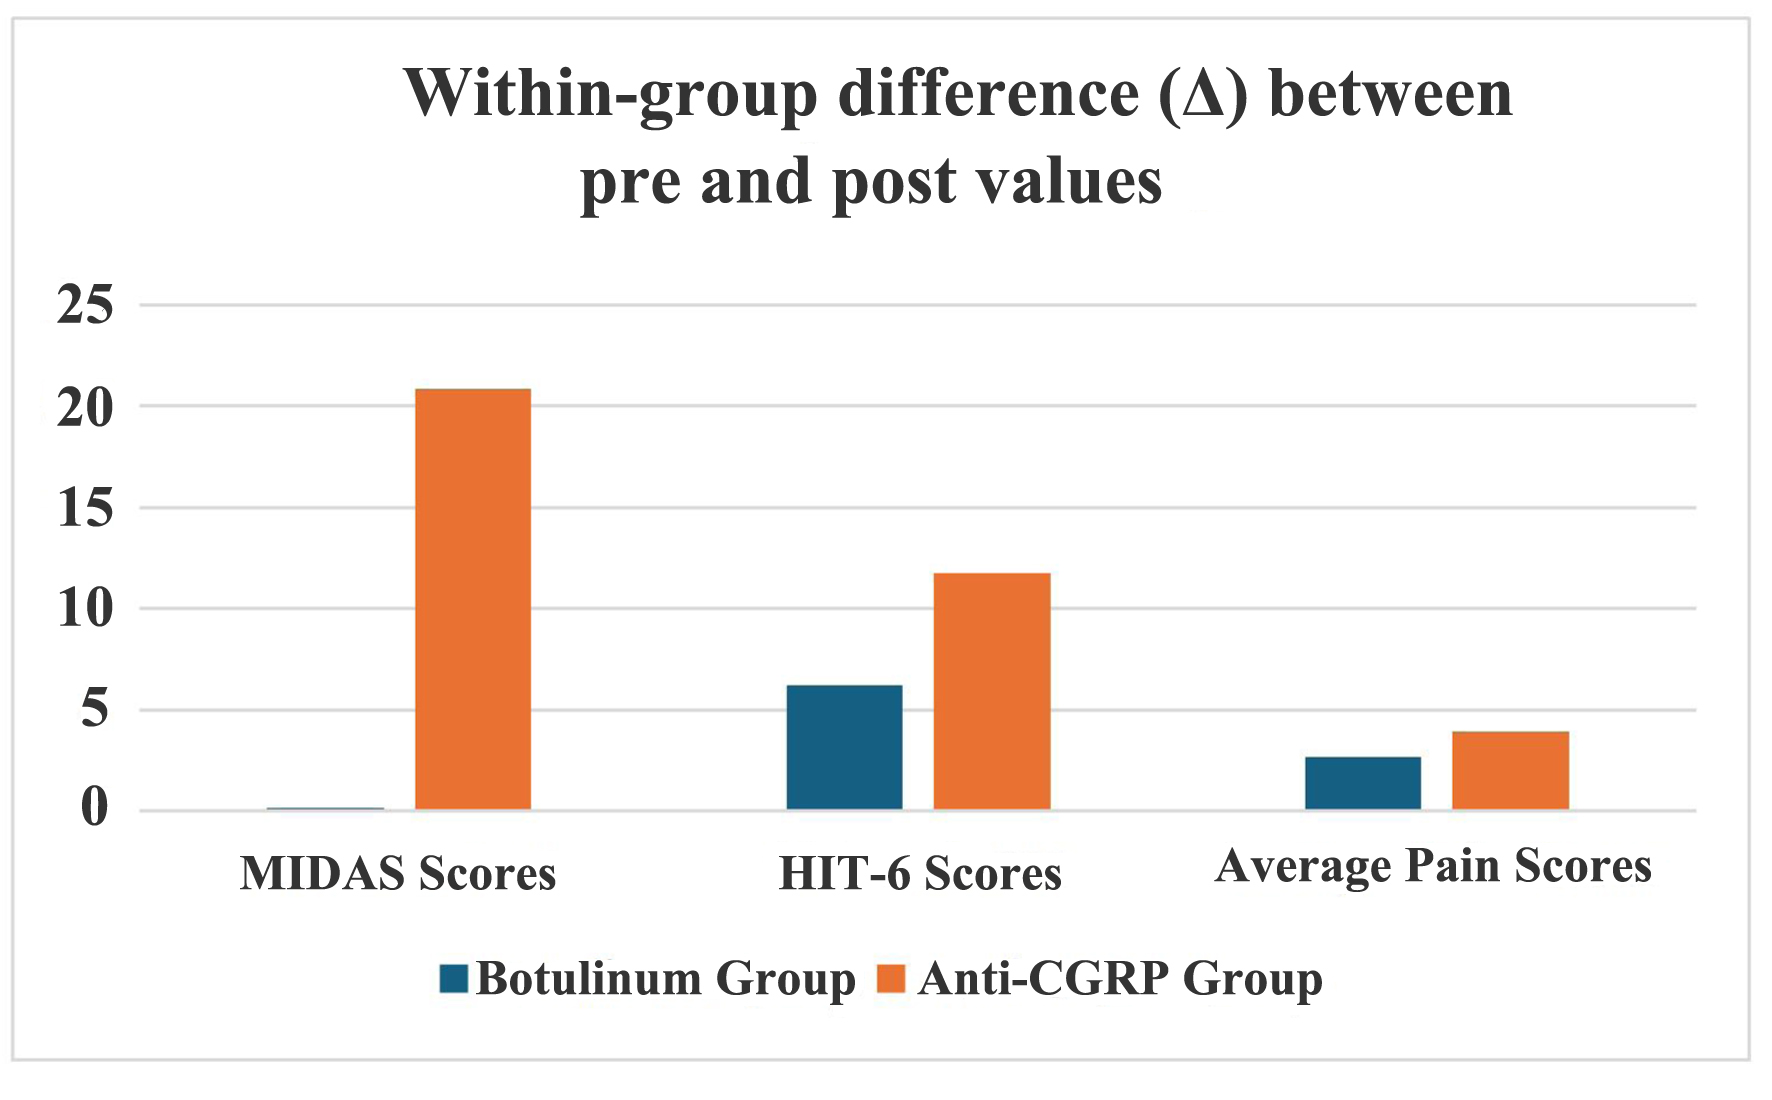
↓ Figure 1. Comparison between two groups for the
effectiveness of the intervention. CGRP: calcitonin gene-related peptide; HIT-6: headache impact test;
MIDAS: migraine disability assessment.
| Journal of Clinical Medicine Research, ISSN 1918-3003 print, 1918-3011 online, Open Access |
| Article copyright, the authors; Journal compilation copyright, J Clin Med Res and Elmer Press Inc |
| Journal website https://jocmr.elmerjournals.com |
Original Article
Volume 16, Number 11, November 2024, pages 527-535
Direct Comparison of Treatment Outcome Between the Botulinum Toxin and Calcitonin Gene-Related Peptide Monoclonal Antibody in Migraine Patients
Figures
Tables
| Demographic characteristics | N (%) or mean ± SD |
|---|---|
| BoNT: botulinum neurotoxin; CGRP: calcitonin gene-related peptide; HIT-6: headache impact test; MIDAS: migraine disability assessment; MPSQ: migraine pain scale questionnaire; SD: standard deviation. | |
| Total duration for which the patient has been suffering from migraine | |
| Less than 6 months | 3 (3.8%) |
| 6 - 12 months | 10 (12.5%) |
| 12 - 24 months | 14 (17.5%) |
| More than 24 months | 53 (66.3%) |
| Intensity of pain (average pain score by MPSQ scale) | 8.72 ± 1.387 |
| MIDAS total scores | 45.3 ± 46.641 |
| HIT-6 total scores | 65.30 ± 6.846 |
| Number of days in the last 3 months when the patient missed work or school because of the headache | 6.89 ± 10.87 |
| Number of days in the last 3 months when patients missed family, social or leisure activities because of headaches | 9.24 ± 13.002 |
| Number of days in the last 3 months when patients had headaches (PRE-MIDAS A) | 14.63 ± 19.546 |
| Previously used medication for migraine (other than anti-CGRP and botulinum) | |
| Yes | 68 (85%) |
| No | 12 (15%) |
| Average duration of previously used medications for migraine in years (other than anti-CGRP and botulinum) | 2.26 ± 2.014 |
| Currently using any medication for migraine (other than anti-CGRP and BoNT) | |
| Yes | 24 (30%) |
| No | 58 (70%) |
| Demographic characteristics | Botulinum group (N = 40) | Anti-CGRP group (N = 40) | P value |
|---|---|---|---|
| *A P-value of < 0.05 is considered statistically significant. CGRP: calcitonin gene-related peptide; HIT-6: headache impact test; MIDAS: migraine disability assessment; MPSQ: migraine pain scale questionnaire. | |||
| Gender | |||
| Male | 10 (25%) | 9 (22.5%) | |
| Female | 30 (75%) | 31 (77.5%) | 0.793 |
| Average age | 39.43 ± 9.642 | 38.73 ± 10.476 | 0.757 |
| Total duration for which the patient has been suffering from migraine | |||
| Less than 6 months | 1 (2.5%) | 2 (5%) | |
| 6 - 12 months | 8 (20%) | 2 (5%) | |
| 12 - 24 months | 8 (20%) | 6 (15%) | |
| More than 24 months | 23 (57.5%) | 30 (75%) | 0.162 |
| Intensity of pain (average pain score by MPSQ scale) | 8.63 ± 1.102 | 8.83 ± 1.631 | 0.523 |
| MIDAS total scores | 26.68 ± 26.436 | 63.93 ± 54.737 | 0.000* |
| HIT-6 total scores | 63.98 ± 7.298 | 66.63 ± 6.171 | 0.083 |
| Number of days (in last 3 months) where the productivity of the patient was affected due to migraine headache | 5.63 ± 12.994 | 13.2 ± 14.342 | 0.015* |
| How often do the headaches limit daily activities | |||
| Always | 7 (17.5%) | 13 (32.5%) | |
| Very often | 10 (25%) | 18 (45%) | |
| Sometimes | 21 (52.5%) | 9 (22.5%) | |
| Rarely | 2 (5%) | 0 (0%) | 0.012* |
| Previously used medication for migraine (other than anti-CGRP and botulinum) | |||
| Yes | 32 (80%) | 36 (90%) | 0.210 |
| No | 8 (20%) | 4 (10%) | |
| Average duration of previously used medications for migraine (other than anti-CGRP and botulinum) | 2.59 ± 2.089 | 1.92 ± 1.902 | 0.137 |
| Currently using any medication for migraine (other than anti-CGRP and botulinum) | |||
| Yes | 12 (30%) | 12 (30%) | 1.0 |
| No | 28 (70%) | 28 (70%) | |
| Questionnaire used for | Before treatment (mean ± SD) | After treatment (mean ± SD) | P-valuea |
|---|---|---|---|
| aPaired sample t-test. *A P-value of < 0.05 is considered statistically significant. CGRP: calcitonin gene-related peptide; HIT-6: headache impact test; MIDAS: migraine disability assessment; SD: standard deviation. | |||
| Botulinum group | |||
| Average MIDAS scores | 26.68 ± 26.436 | 26.5 ± 28.068 | 0.970 |
| Average HIT-6 scores | 63.98 ± 7.298 | 57.75 ± 12.251 | 0.005 |
| Average pain scale scores | 8.63 ± 1.102 | 5.95 ± 2.669 | 0.000* |
| Anti-CGRP group | |||
| Average MIDAS scores | 63.93 ± 54.737 | 43.08 ± 64.547 | 0.097 |
| Average HIT-6 scores | 66.63 ± 6.171 | 54.90 ± 12.266 | 0.00* |
| Average pain scale scores | 8.83 ± 1.631 | 4.90 ± 2.489 | 0.00* |
| Groups | Within-group difference (Δ) between pre- and post-intervention values | ||
|---|---|---|---|
| MIDAS scores | HIT-6 scores | Average pain scores | |
| aIndependent sample t-test. CGRP: calcitonin gene-related peptide; HIT-6: headache impact test; MIDAS: migraine disability assessment. | |||
| Botulinum group | 0.18 ± 29.321 | 6.23 ± 13.086 | 2.68 ± 2.973 |
| Anti-CGRP group | 20.85 ± 77.557 | 11.73 ± 14.146 | 3.93 ± 3.133 |
| P-valuea | 0.121 | 0.075 | 0.07 |
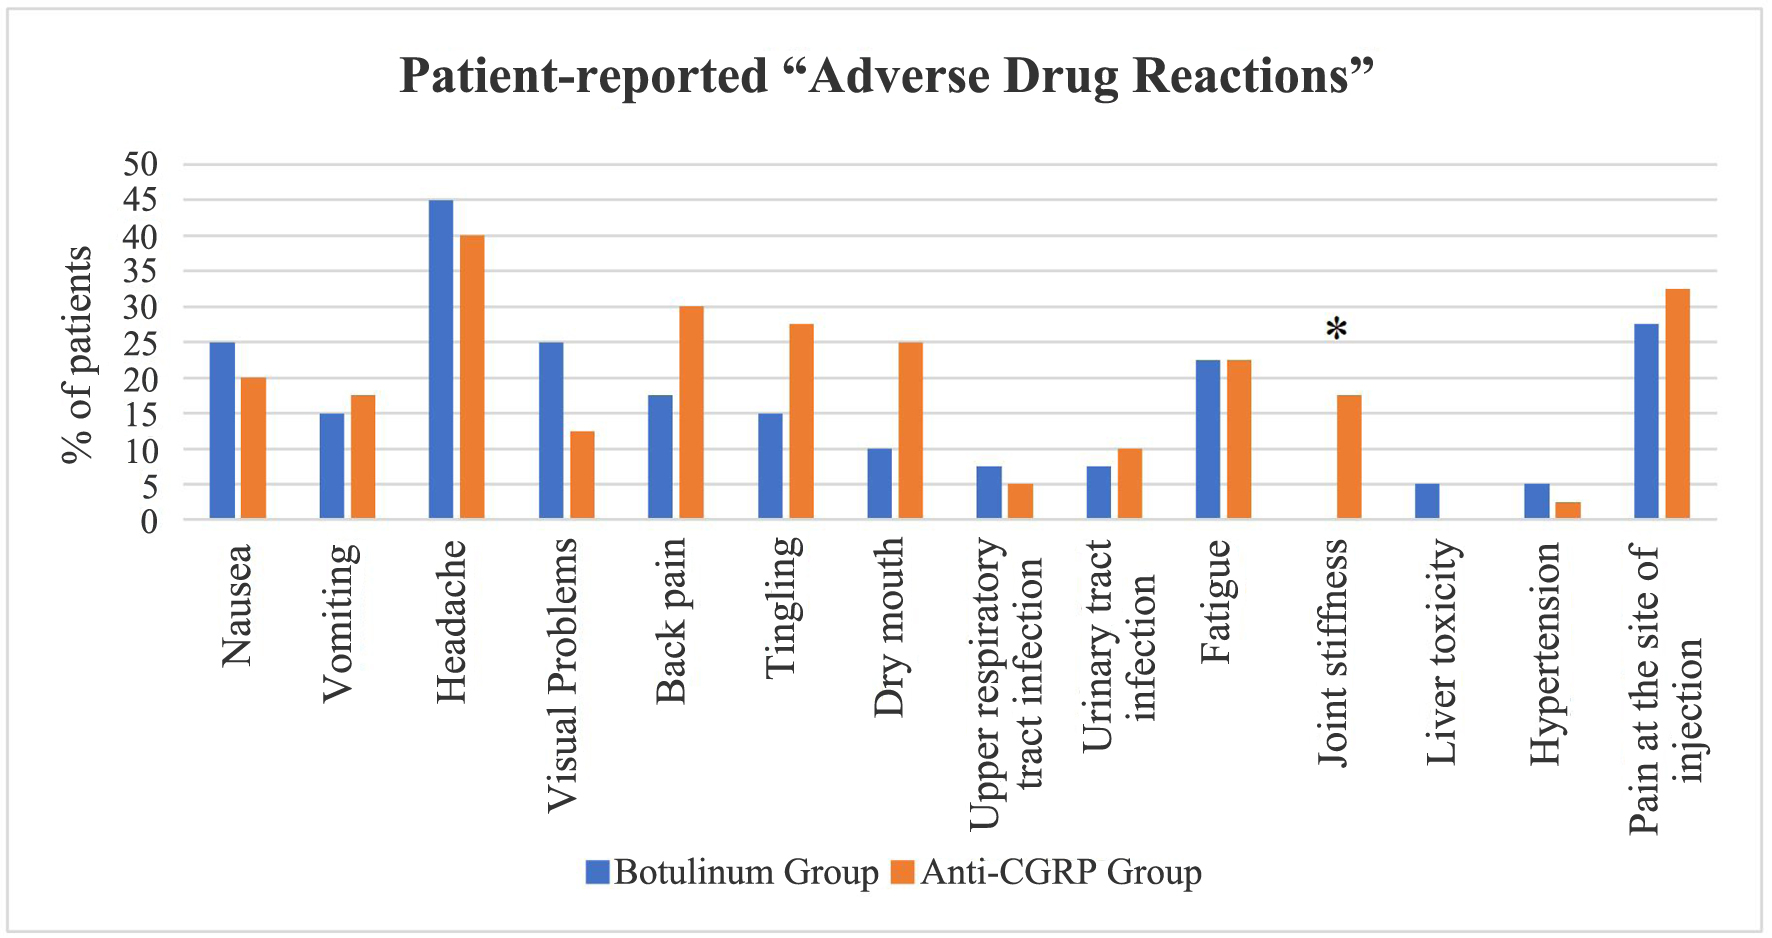
| Patient-reported adverse drug reactions | Botulinum group, N (%) | Anti-CGRP group, N (%) | P value |
|---|---|---|---|
| *A P-value of < 0.05 is considered statistically significant. CGRP: calcitonin gene-related peptide. | |||
| Nausea | |||
| Yes | 10 (25%) | 8 (20%) | 0.592 |
| No | 30 (75%) | 32 (80%) | |
| Vomiting | |||
| Yes | 6 (15%) | 7 (17.5%) | 0.762 |
| No | 34 (85%) | 33 (82.5%) | |
| Headache (different from migraine headache) | |||
| Yes | 18 (45%) | 16 (40%) | 0.651 |
| No | 22 (55%) | 24 (60%) | |
| Visual problems | |||
| Yes | 10 (25%) | 5 (12.5%) | 0.152 |
| No | 30 (75%) | 35 (87.5%) | |
| Backpain | |||
| Yes | 7 (17.5%) | 12 (30%) | 0.189 |
| No | 33 (82.5%) | 28 (70%) | |
| Tingling | |||
| Yes | 6 (15%) | 11 (27.5%) | 0.172 |
| No | 34 (85%) | 29 (72.5%) | |
| Dry mouth | |||
| Yes | 4 (10%) | 10 (25%) | 0.077 |
| No | 36 (90%) | 30 (75%) | |
| Upper respiratory tract infection | |||
| Yes | 3 (7.5%) | 2 (5%) | 0.644 |
| No | 37 (92.5%) | 38 (95%) | |
| Urinary tract infection | |||
| Yes | 3 (7.5%) | 4 (10%) | 0.692 |
| No | 37 (92.5%) | 36 (90%) | |
| Fatigue | |||
| Yes | 9 (22.5%) | 9 (22.5%) | 1.000 |
| No | 31 (77.5%) | 31 (77.5%) | |
| Joint stiffness | |||
| Yes | 0 (0%) | 7 (17.5%) | 0.006* |
| No | 40 (100%) | 33 (82.5%) | |
| Liver toxicity | |||
| Yes | 2 (5%) | 0 (0%) | 0.152 |
| No | 38 (95%) | 40 (100%) | |
| Hypertension | |||
| Yes | 2 (5%) | 1 (2.5%) | 0.556 |
| No | 38 (95%) | 39 (97.5%) | |
| Pain at the site of injection | |||
| Yes | 11 (27.5%) | 13 (32.5%) | 0.626 |
| No | 29 (72.5%) | 27 (67.5%) | |