Journal of Clinical Medicine Research, ISSN 1918-3003 print, 1918-3011 online, Open Access
Article copyright, the authors; Journal compilation copyright, J Clin Med Res and Elmer Press Inc
Journal website https://jocmr.elmerjournals.com

Original Article

Volume 16, Number 10, October 2024, pages 465-471


High Blood Glucose After Starch Loading in Young Women With Small Increase in Salivary Amylase: Another Crucial Role of Postprandial Salivary Amylase

Figures

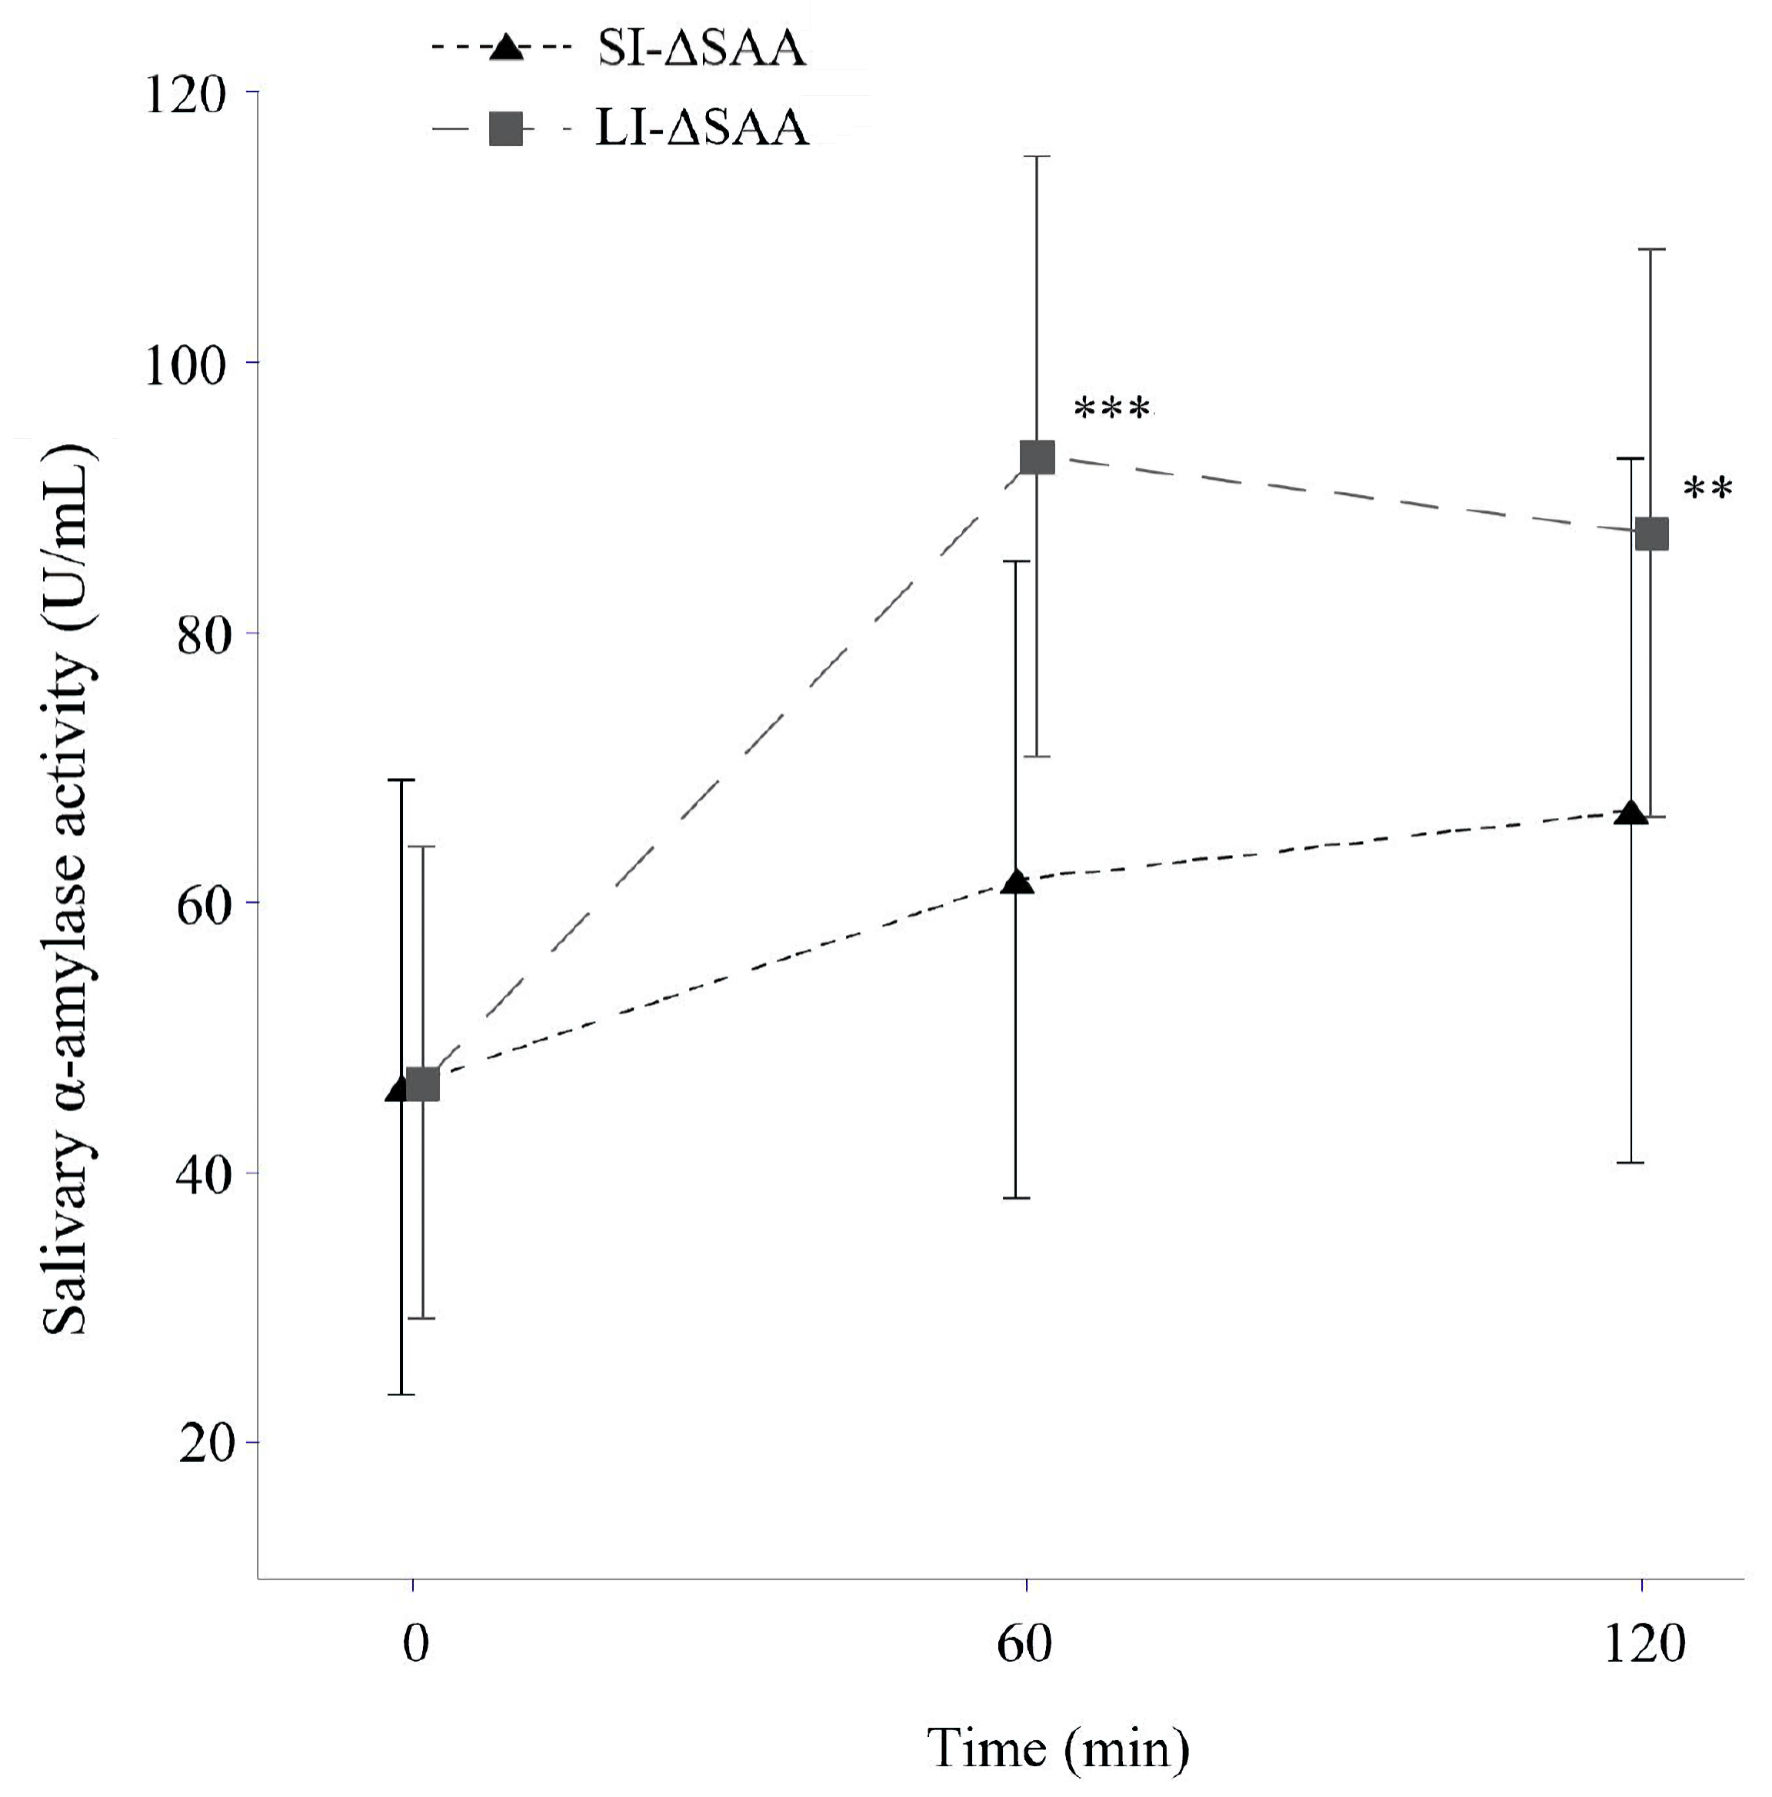
↓  Figure 1. Salivary amylase levels after starch loading according to SI- and LI-ΔSAA (means ± standard deviation). **P < 0.001, ***P < 0.0001 vs. SI-ΔSAA. LI-ΔSAA: ΔSAA at 60 min ≥ 28 IU/L (n = 29); SI-ΔSAA: ΔSAA at 60 min < 28 IU/L (n = 31). SAA: salivary α-amylase activity; LI-ΔSAA: large-increase in ΔSAA; SI-ΔSAA: small-increase in ΔSAA.
Figure 1.
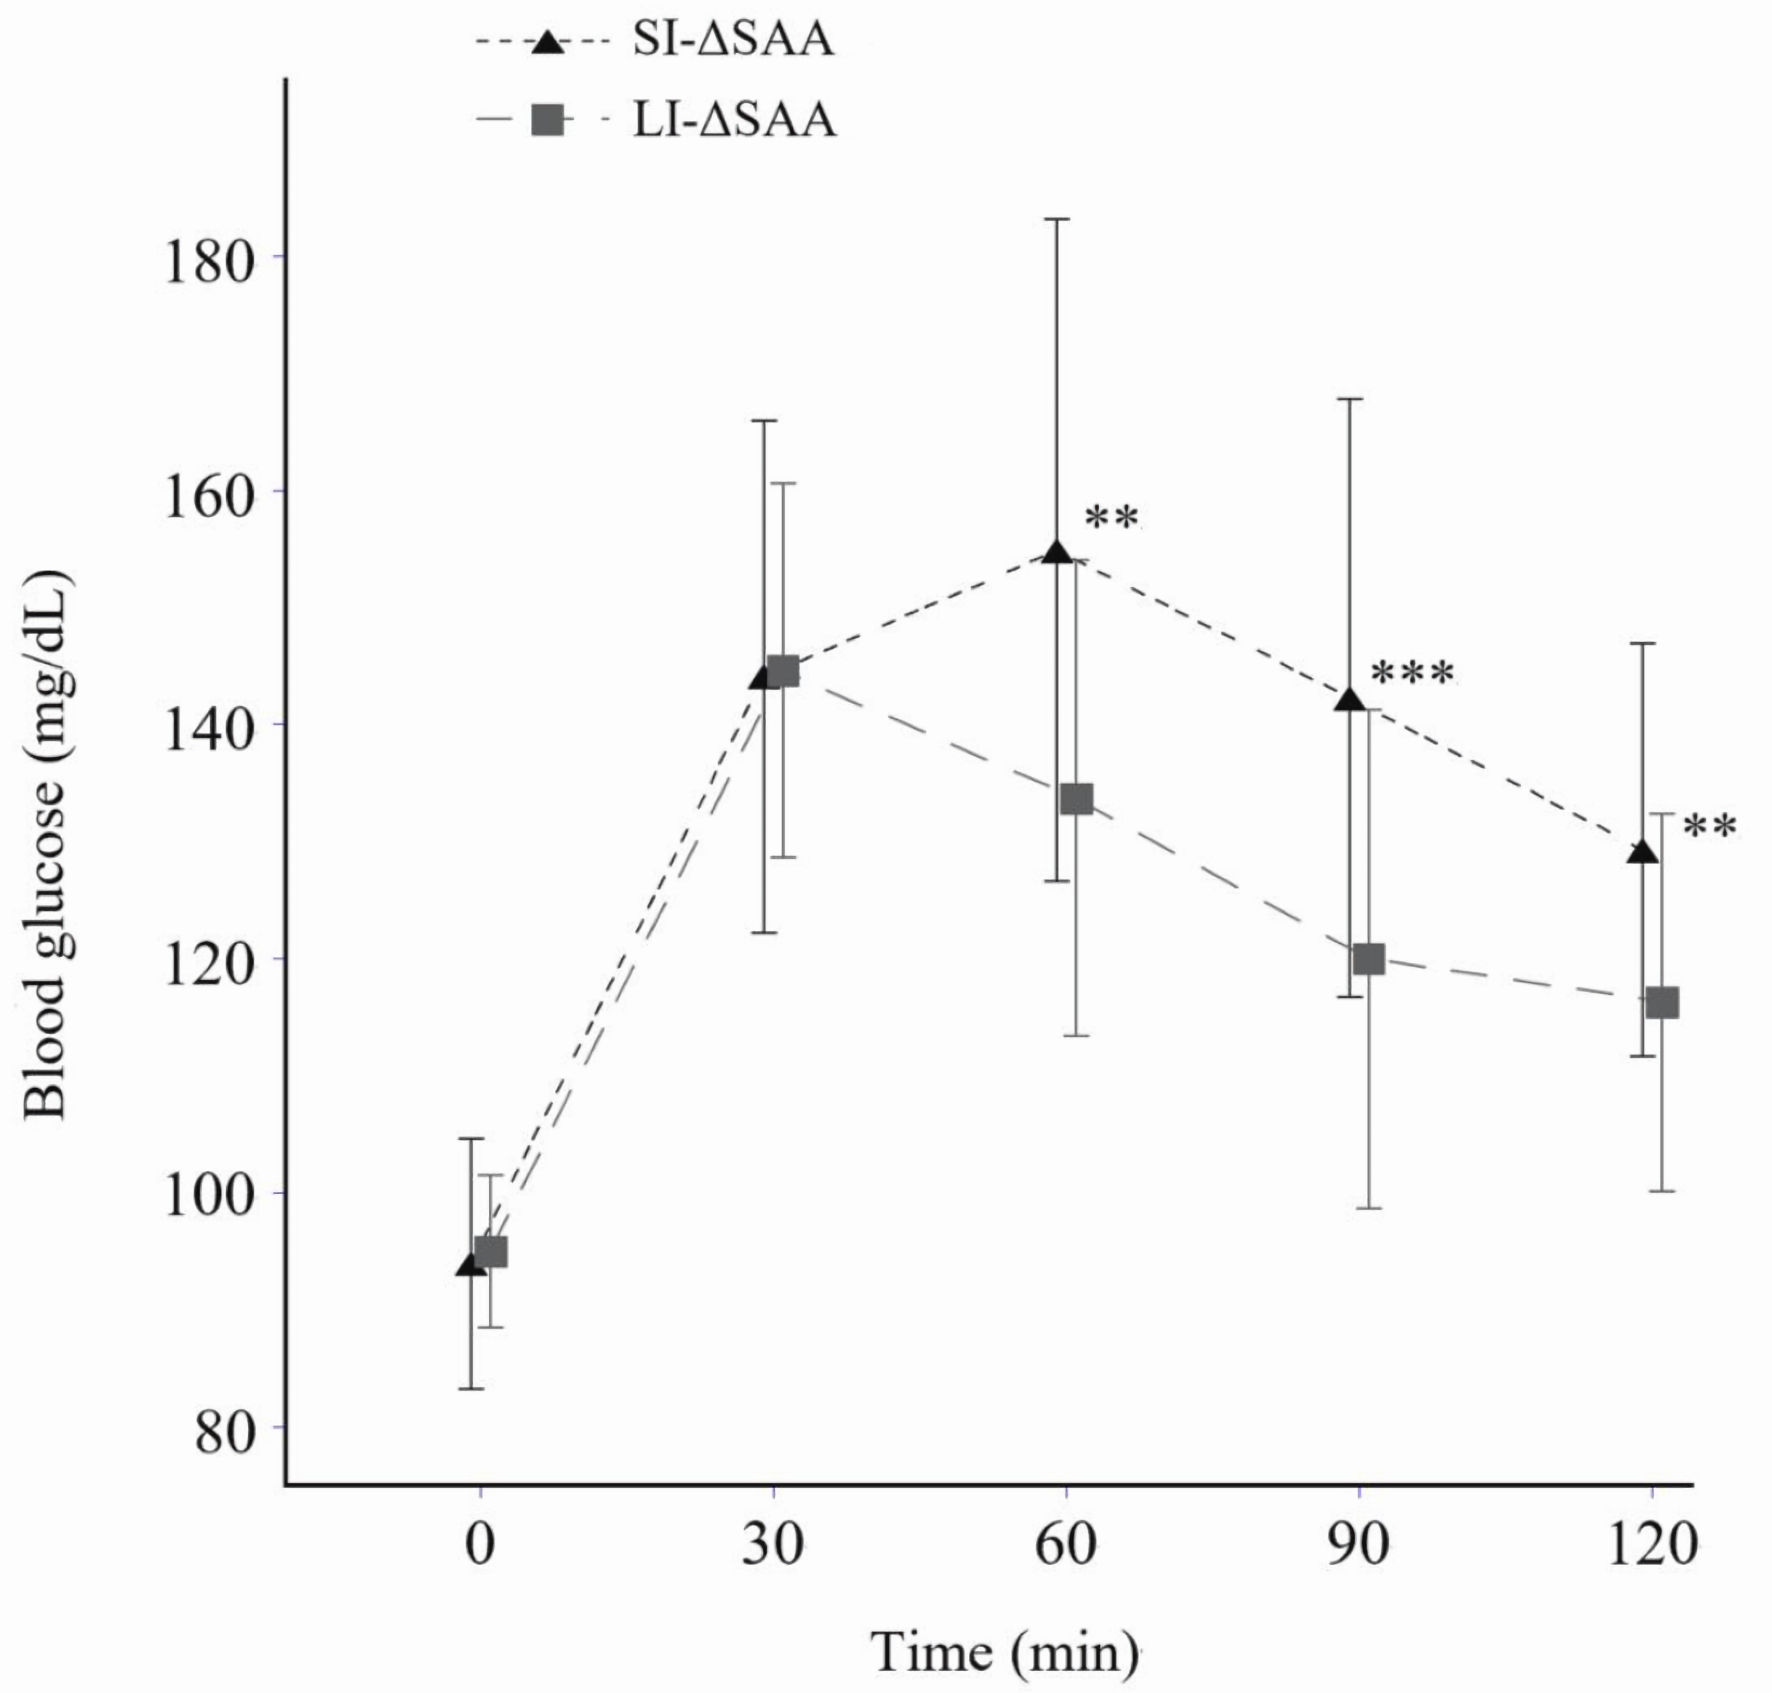
↓  Figure 2. Blood glucose levels after starch loading according to SI- and LI-ΔSAA (means ± standard deviation). **P < 0.01, ***P < 0.001 vs. LI-ΔSAA. No significant difference in areas under the curve was observed between SI-ΔSAA (mean ± standard deviation: 53.1 ± 23.3 mg·min/dL) and LI-ΔSAA (43.5 ± 11.6 mg·min/dL) (P = 0.051). LI-ΔSAA: ΔSAA at 60 min ≥ 28 IU/L (n = 29); SI-ΔSAA: ΔSAA at 60 min < 28 IU/L (n = 31). SAA: salivary α-amylase activity; LI-ΔSAA: large-increase in ΔSAA; SI-ΔSAA: small-increase in ΔSAA.
Figure 2.

Tables

↓  Table 1. Characteristics of Participants
 
Total (n = 60) SI-ΔSAA (n = 31) LI-ΔSAA (n = 29) P values
Data are shown as mean ± SD or median (IQR). P values were calculated by t-test or Wilcoxon signed-rank test. SD: standard deviation; IQR: interquartile range.
Age (years old) 21.1 ± 0.8 21.0 ± 0.8 21.1 ± 0.8 0.61
BMI (kg/m2) 19.8 ± 2.0 20.0 ± 2.2 19.7 ± 1.7 0.53
Waist circumference (cm) 68.5 ± 5.0 69.0 ± 5.7 67.9 ± 4.2 0.42
Lean body mass (kg) 34.1 ± 3.3 34.7 ± 3.4 33.6 ± 3.0 0.19
Body fat (%) 26.3 ± 5.1 26.2 ± 5.4 26.4 ± 4.9 0.90
Blood glucose (mg/dL)
  Baseline 94.4 ± 8.8 93.9 ± 10.6 95.0 ± 6.5 0.64
  30 min 144 ± 19 144.1 ± 21.9 144.6 ± 16.0 0.92
  60 min 145 ± 27 154.8 ± 28.3 133.7 ± 20.3 0.002
  90 min 132 ± 26 142.3 ± 25.5 120.0 ± 21.3 0.0005
  120 min 123 ± 18 129.2 ± 17.7 116.2 ± 16.1 0.004
  Area under the curve 48.4 ± 19 53.1 ± 23.3 43.5 ± 11.6 0.051
ΔBG
  30 - 0 min 49.9 ± 19.7 50.2 ± 24.0 49.6 ± 13.9 0.92
  60 - 0 min 50.2 ± 28.6 60.9 ± 31.5 38.7 ± 19.8 0.002
  90 - 0 min 37.1 ± 27.0 48.4 ± 27.7 25.0 ± 20.7 0.0005
  120 - 0 min 28.8 ± 18.8 35.8 ± 19.6 21.3 ± 14.8 0.002
Unadjusted salivary amylase activity (U/mL)
  Baseline 58.0 ± 30.3 54.9 ± 30.4 61.4 ± 30.3 0.41
  60 min 96.4 ± 54.1 70.9 ± 32.9 123.6 ± 59.5 < 0.0001
  120 min 99.9 ± 61.3 77.3 ± 46.1 124.1 ± 66.8 0.002
Unadjusted ΔSAA (U/mL)
  60 - 0 min 40.5 ± 38.0 20.3 ± 16.4 62.2 ± 42.7 < 0.0001
  120 - 0 min 41.9 ± 48.7 22.4 ± 41.0 62.7 ± 48.2 0.0009
Protein concentration in saliva (mg/mL)
  Baseline 1.23 ± 0.35 1.17 ± 0.33 1.29 ± 0.37 0.18
  60 min 1.22 ± 0.41 1.16 ± 0.37 1.29 ± 0.46 0.25
  120 min 1.24 ± 0.50 1.13 ± 0.45 1.36 ± 0.53 0.078
Salivary amylase activity (U/mL)
  Baseline 46.4 ± 20.2 46.3 ± 22.7 46.6 ± 17.4 0.95
  60 min 76.8 ± 27.7 61.7 ± 23.5 93.0 ± 22.2 < 0.0001
  120 min 76.7 ± 25.7 66.7 ± 26.0 87.3 ± 21.0 0.001
ΔSAA (U/mL)
  60 - 0 min 31.2 ± 19.6 17.0 ± 7.8 46.4 ± 16.8 < 0.0001
  120 - 0 min 30.3 ± 21.6 20.5 ± 20.9 40.7 ± 17.1 0.0001
Blood 3-hydroxybutyrate (mmol/dL)
  Baseline 0.1 (0.0 - 0.3) 0.2 (0.0 - 0.4) 0.0 (0.0 - 0.1) 0.0008
  120 min 0.0 (0.0 - 0.1) 0.0 (0.0 - 0.1) 0.0 (0.0 - 0.0) 0.86
Respiratory quotient 0.89 ± 0.04 0.88 ± 0.04 0.90 ± 0.04 0.19
Nutrition intake
  Energy (kcal/day) 1,666 ± 33 1,663 ± 33 1,669 ± 33 0.54
  Carbohydrate (g/day) 241.3 ± 5.6 240.8 ± 5.9 241.9 ± 5.3 0.43
  Carbohydrate energy, % in total energy 59.7 ± 0.7 59.7 ± 0.8 59.7 ± 0.7 0.97
  Lipid (g/day) 52.9 ± 2.0 52.9 ± 2.1 53.0 ± 2.1 0.84
  Lipid energy, % in total energy 26.4 ± 0.6 26.4 ± 0.7 26.4 ± 0.6 0.81
  Protein (g/day) 66.5 ± 1.8 66.4 ± 1.7 66.7 ± 1.9 0.43
  Protein energy, % in total energy 13.9 ± 0.2 13.9 ± 0.2 13.9 ± 0.1 0.43


↓  Table 2. Correlations Between SAA, BG Concentrations, Their Changes From Baseline, and Blood 3HB Levels Across Participants
 
SAA (U/mL) ΔSAA (U/mL) Blood 3HB (mmol/dL)
0 min 60 min 120 min 60 - 0 min 120 - 0 min 0 min 120 min
*P < 0.05, **P < 0.01, ***P < 0.001 according to Spearman’s correlation coefficient. Δ: change from baseline; BG: blood glucose; BMI: body mass index; 3HB: 3-hydroxybutyrate; SAA: salivary amylase activity.
BMI (kg/m2) 0.002 -0.04 -0.03 -0.06 -0.01 0.09 0.13
BG (mg/dL)
  0 min 0.23 0.20 0.13 0.09 -0.05 -0.19 0.21
  30 min 0.04 -0.01 -0.04 -0.06 0.00 -0.14 0.05
  60 min 0.04 -0.26* -0.32* -0.44** -0.42** 0.30* 0.21
  90 min 0.09 -0.30* -0.30* -0.53*** -0.46** 0.25 0.16
  120 min 0.09 -0.25 -0.20 -0.42** -0.31* 0.10 0.08
ΔBG
  30 - 0 min -0.02 -0.05 -0.06 -0.05 0.04 -0.06 0.01
  60 - 0 min -0.02 -0.28* -0.33* -0.42** -0.37* 0.33* 0.14
  90 - 0 min 0.06 -0.31* -0.31* -0.50*** -0.43** 0.27* 0.06
  120 - 0 min 0.04 -0.30* -0.24 -0.46** -0.31* 0.20 0.02
  Area under the curve -0.07 -0.23 -0.24 -0.29* -0.16 0.18 0.12
Blood 3HB (mmol/dL)
  0 min -0.07 -0.27* -0.26* -0.40** -0.26 - 0.02
  120 min -0.34** -0.16 -0.24 0.10 0.03 - -


↓  Table 3. Generalized Liner Model of Variables for ΔBGs
 
Model and enrolled variables ΔBG
Δ 30 - 0 min Δ 60 - 0 min Δ 90 - 0 min Δ 120 - 0 min
β Wald Chi-square value β Wald Chi-square value β Wald Chi-square value β Wald Chi-square value
*P < 0.05, **P < 0.01. Each model includes relevant variables listed. Hormones, such as insulin, and serum lipids, such as triglyceride and high-density lipoprotein cholesterol, and glycated hemoglobin (HbA1c) were unavailable in this study. All variables were standardized before analysis. β regression and Wald Chi-square values were calculated using a generalized liner model. β: regression coefficient; Δ: change from baseline; BG: blood glucose; BMI: body mass index; 3HB: 3-hydroxybutyrate; SAA: salivary amylase activity.
Model 1
  BMI -0.16 1.63 -0.13 1.31 -0.15 1.64 0.10 0.68
  ΔSAA 60 - 0 min -0.06 0.21 -0.38** 10.5 -0.43** 13.8 -0.42** 12.7
Model 2
  BMI -0.07 0.24 -0.01 0.01 -0.05 0.20 0.25* 4.83
  BG 0 min -0.27* 4.02 -0.34** 7.69 -0.26* 4.73 -0.42** 13.4
  SAA 0 min 0.05 0.14 0.04 0.14 0.09 0.62 0.05 0.21
  ΔSAA 60 - 0 min -0.04 0.12 -0.36** 10.6 -0.41** 13.3 -0.39** 13.7
Model 3
  BMI -0.03 0.07 -0.04 0.12 -0.08 0.46 0.25* 4.66
  BG 0 min -0.31* 5.23 -0.30* 6.10 -0.23 3.54 -0.42** 12.8
  SAA 0 min 0.05 0.16 0.04 0.13 0.09 0.62 0.05 0.21
  ΔSAA 60 - 0 min -0.11 0.69 -0.31** 6.78 -0.35** 8.98 -0.39** 11.9
  Blood 3HB 0 min -0.19 2.03 0.17 2.05 0.16 1.90 0.01 0.00