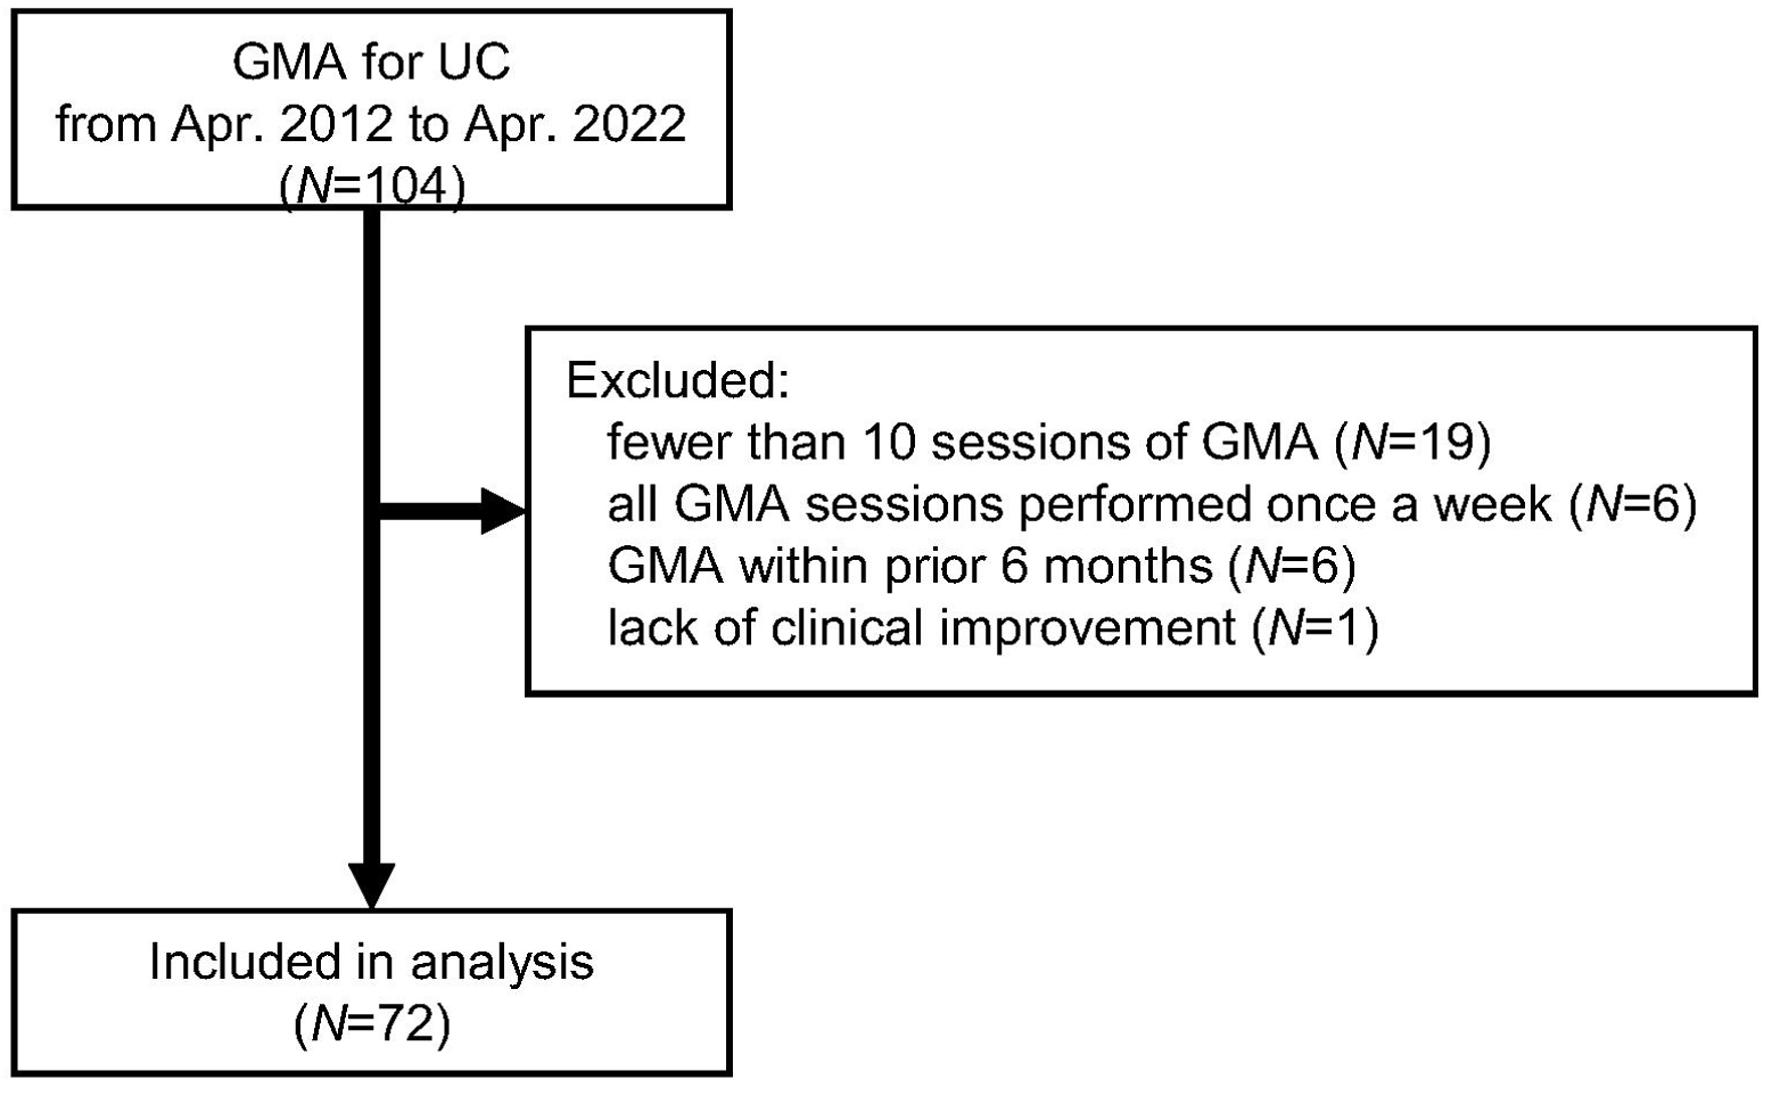
↓ Figure 1. Flow diagram of the present study.
GMA: granulocyte and monocyte adsorption apheresis; UC: ulcerative colitis.
| Journal of Clinical Medicine Research, ISSN 1918-3003 print, 1918-3011 online, Open Access |
| Article copyright, the authors; Journal compilation copyright, J Clin Med Res and Elmer Press Inc |
| Journal website https://jocmr.elmerjournals.com |
Original Article
Volume 16, Number 12, December 2024, pages 625-634
Higher Processed Blood Volume of Granulocyte and Monocyte Adsorption Apheresis Ameliorates Long-Term Disease Activity in Ulcerative Colitis Patients
Figures
Tables
| Variable | All (N = 72) | Lower GMA dose (N = 36) | Higher GMA dose (N = 36) | P |
|---|---|---|---|---|
| Continuous data are presented as median (IQR). *Analysis of administered cases only. Alb: serum albumin; 5-ASA: 5-aminosalicylic acid; AZA: azathioprine; CRP: C-reactive protein; ESR: erythrocyte sedimentation rate; GMA: granulocyte and monocyte apheresis; Hb: hemoglobin; IQR: interquartile range; 6-MP: 6-mercaptopurine; PSL: prednisolone; UC: ulcerative colitis; WBC: white blood cell count. | ||||
| Age, years | 44.4 (28.7 - 54.3) | 43.4 (34.1 - 56.5) | 44.4 (28.0 - 53.2) | 0.68 |
| Male gender, n (%) | 47 (65%) | 29 (81%) | 18 (50%) | 0.01 |
| Body weight, kg | 56.9 (51.1 - 63.9) | 63.0 (57.8 - 68.7) | 51.0 (47.8 - 54.0) | < 0.01 |
| Duration of UC, years | 5.3 (2.2 - 12.2) | 3.6 (1.6 - 17.4) | 6.5 (3.3 - 10.5) | 0.60 |
| Extend of UC lesion (total/hemi-sided) | 49/23 | 26/10 | 23/13 | 0.61 |
| Clinical severity (mild/moderate/severe), n | 6/57/9 | 3/28/5 | 3/29/4 | 0.94 |
| Seo index (mild/moderate/severe), n | 20/41/11 | 12/19/5 | 8/22/6 | 0.57 |
| Seo index score | 178 (147 - 205) | 168 (140 - 212) | 183 (154 - 202) | 0.38 |
| Comorbidities | ||||
| Diabetes, n (%) | 6 (8%) | 4 (11%) | 2 (6%) | 0.67 |
| Hypertension, n (%) | 12 (17%) | 6 (17%) | 6 (17%) | 1.0 |
| Dyslipidemia, n (%) | 4 (6%) | 3 (8%) | 1 (3%) | 0.61 |
| Chronic kidney disease, n (%) | 6 (8%) | 3 (8%) | 3 (8%) | 1.0 |
| Current smoking, n (%) | 14 (19%) | 6 (17%) | 8 (22%) | 0.77 |
| Alcohol drinking, n (%) | 11 (15%) | 8 (22%) | 3 (8%) | 0.19 |
| WBC, × 103/µL | 9.8 (7.5 - 13.0) | 9.7 (7.8 - 12.7) | 10.0 (7.3 - 13.5) | 0.91 |
| Hb, g/dL | 11.9 (10.9 - 12.8) | 12.7 (11.8 - 13.5) | 11.2 (10.6 - 12.1) | < 0.01 |
| Alb, g/dL | 3.3 (2.9 - 3.7) | 3.3 (2.9 - 3.7) | 3.4 (2.7 - 3.7) | 0.68 |
| CRP, mg/dL | 1.17 (0.29 - 3.26) | 1.46 (0.38 - 3.30) | 0.89 (0.27 - 3.24) | 0.50 |
| ESR, mm/h | 35 (19 - 48) | 32 (17 - 43) | 38 (22 - 49) | 0.28 |
| Medications at GMA initiation, n (%) | ||||
| 5-ASA | 65 (90%) | 32 (89%) | 33 (92%) | 1.0 |
| AZA or 6-MP | 8 (11%) | 4 (11%) | 4 (11%) | 1.0 |
| PSL | 57 (79%) | 30 (83%) | 27 (75%) | 0.56 |
| 5-ASA dose, mg/day* | 4,000 (3,600 - 4,800) | 3,800 (3,600 - 4,000) | 4,000 (3,600 - 4,800) | 0.07 |
| AZA or 6-MP dose, mg/kg/day* | 0.95 (0.66, 1.18) | 0.66 (0.60, 0.93) | 0.98 (0.96 - 1.23) | 0.15 |
| Biologics within 1-year after GMA, n (%) | 34 (47%) | 15 (42%) | 19 (53%) | 0.48 |
| GMA dose, mL/kg/session | 34.2 (28.6 - 39.2) | 28.6 (26.6 - 31.6) | 39.3 (36.4 - 47.5) | < 0.01 |
| GMA session treatment time (60 min/> 60 min), n | 54/18 | 35/1 | 19/17 | < 0.01 |
| UC exacerbation within 1-year after GMA, n (%) | 34 (47%) | 23 (64%) | 11 (31%) | < 0.01 |
| Variable | All (N = 72) | Lower GMA dose (N = 36) | Higher GMA dose (N = 36) | P |
|---|---|---|---|---|
| Continuous data are presented as median (IQR). Alb: serum albumin; 5-ASA: 5-aminosalicylic acid; AZA: azathioprine; CRP: C-reactive protein; ESR: erythrocyte sedimentation rate; GMA: granulocyte and monocyte adsorption; Hb: hemoglobin; IQR: interquartile range; 6-MP: 6-mercaptopurine; PSL: prednisolone; WBC: white blood cell count. | ||||
| Seo index (mild/moderate/severe), n | 67/4/1 | 33/2/1 | 34/2/0 | 0.60 |
| Seo index score | 114 (105, 122) | 114 (105, 121) | 111 (105, 123) | 0.89 |
| clinical improvement/remission | 60 (83%) | 28 (78%) | 32 (89%) | 0.34 |
| WBC, × 103/µL | 9.8 (7.1, 11.5) | 10.5 (9.0, 11.7) | 8.8 (6.6, 11.2) | 0.09 |
| Hb, g/dL | 12.7 (11.0, 13.4) | 12.7 (11.1, 13.7) | 12.3 (10.5, 13.3) | 0.27 |
| Alb, g/dL | 3.9 (3.7, 4.1) | 3.8 (3.6, 4.2) | 4.0 (3.7, 4.1) | 0.33 |
| CRP, mg/dL | 0.05 (0.02, 0.15) | 0.06 (0.03, 0.23) | 0.02 (0.02, 0.10) | 0.03 |
| ESR, mm/h | 13 (5, 23) | 15 (6, 27) | 12 (4, 19) | 0.28 |
| Medication after GMA, n (%) | ||||
| 5-ASA | 67 (93%) | 33 (92%) | 34 (94%)) | 1.0 |
| AZA or 6-MP | 12 (17%) | 6 (17%) | 6 (17%) | 1.0 |
| PSL | 61 (85%) | 32 (89%) | 29 (81%) | 0.51 |
| Variable | HR (95% CI) | P |
|---|---|---|
| Alb: serum albumin; 5-ASA: 5-aminosalicylic acid; AZA: azathioprine; CRP: C-reactive protein; ESR: erythrocyte sedimentation rate; GMA: granulocyte and monocyte adsorption; Hb: hemoglobin; 6-MP: 6-mercaptopurine; PSL: prednisolone; WBC: white blood cell count. | ||
| Age | 0.98 (0.96 - 1.00) | 0.08 |
| Male gender | 1.60 (0.75 - 3.44) | 0.22 |
| Body weight | 1.03 (0.99 - 1.06) | 0.07 |
| UC duration | 0.996 (0.96 - 1.03) | 0.84 |
| Total colitis (vs. hemi-sided colitis) | 2.05 (0.89 - 4.71) | 0.09 |
| Clinical severity | ||
| Mild | 1.88 (0.72 - 4.93) | 0.20 |
| Moderate | ref | |
| Severe | 1.08 (0.38 - 3.12) | 0.88 |
| Seo index | ||
| Mild | 0.68 (0.30 - 1.55) | 0.36 |
| Moderate | ref | |
| Severe | 1.72 (0.72 - 4.10) | 0.22 |
| Seo index score | 1.00 (0.99 - 1.01) | 0.41 |
| WBC | 1.00 (1.00 - 1.00) | 0.88 |
| Hb | 1.03 (0.84 - 1.27) | 0.77 |
| Alb | 1.21 (0.70 - 2.08) | 0.50 |
| CRP | 1.02 (0.94 - 1.10) | 0.66 |
| ESR | 1.00 (0.98 - 1.01) | 0.67 |
| Medications at GMA initiation | ||
| 5-ASA | 1.04 (0.32 - 3.40) | 0.95 |
| AZA or 6-MP | 0.17 (0.02 - 1.22) | 0.08 |
| PSL | 2.52 (0.89 - 7.17) | 0.08 |
| Biologics within 1 year after GMA | 1.13 (0.58 - 2.21) | 0.72 |
| High GMA dose (vs. low GMA dose) | 0.39 (0.19 - 0.80) | 0.01 |
| > 60 min of GMA session (vs. 60 min) | 0.47 (0.18 - 1.21) | 0.12 |
| Variable | HR (95% CI) | P |
|---|---|---|
| AZA: azathioprine; CI: confidence interval; GMA: granulocyte and monocyte apheresis; HR: hazard ratio; 6-MP: 6-mercaptopurine; PSL: prednisolone; UC: ulcerative colitis. | ||
| Model 1 | ||
| Higher GMA dose (vs. lower GMA dose) | 0.36 (0.17 - 0.78) | < 0.01 |
| Age | 0.98 (0.95 - 0.997) | 0.03 |
| Male gender | 1.19 (0.53 - 2.68) | 0.67 |
| Model 2 | ||
| Higher GMA dose (vs. lower GMA dose) | 0.37 (0.17 - 0.81) | 0.01 |
| Age | 0.97 (0.94 - 0.998) | 0.04 |
| Duration of UC | 1.02 (0.97 - 1.07) | 0.42 |
| Total colitis (vs. hemi-sided colitis) | 1.38 (0.56 - 3.38) | 0.48 |
| Model 3 | ||
| Higher GMA dose (vs. lower GMA dose) | 0.38 (0.18 - 0.78) | < 0.01 |
| Age | 0.98 (0.96 - 1.01) | 0.16 |
| AZA or 6-MP use | 0.21 (0.03 - 1.61) | 0.14 |
| PSL use | 1.61 (0.55 - 4.72) | 0.39 |
| Model 4 | ||
| Higher GMA dose (vs. lower GMA dose) | 0.30 (0.14 - 0.64) | < 0.01 |
| Age | 0.98 (0.96 - 1.00) | 0.07 |
| GMA prior to 2017 (vs. later) | 0.58 (0.28 - 1.21) | 0.15 |
| Model 5 | ||
| Higher GMA dose (vs. lower GMA dose) | 0.35 (0.17 - 0.74) | < 0.01 |
| Age | 0.98 (0.96 - 0.999) | 0.04 |
| GMA before May 2019 (vs. later) | 1.25 (0.58 - 2.67) | 0.57 |
| Sessions with standard treatment time (N = 540) | Sessions with extended treatment time (N = 180) | P | |
|---|---|---|---|
| Less than 1,800 mL of actual processed blood volume in the session, n (%) | 29 (5.4%) | 5 (2.8%) | 0.22 |
| Unexpected termination of the session, n (%) | 29 (5.4%) | 16 (8.9%) | 0.13 |
| Cause of unexpected termination, n (%) | |||
| Circuit coagulation | 19 (3.5%) | 11 (5.6%) | 0.32 |
| Defecation | 2 (0.4%) | 5 (2.8%) | 0.01 |
| Allergy (because of anticoagulant) | 3 (0.6%) | 0 (0%) | 0.58 |
| Impossible draining of blood from the body | 5 (0.9%) | 0 (0%) | 0.34 |