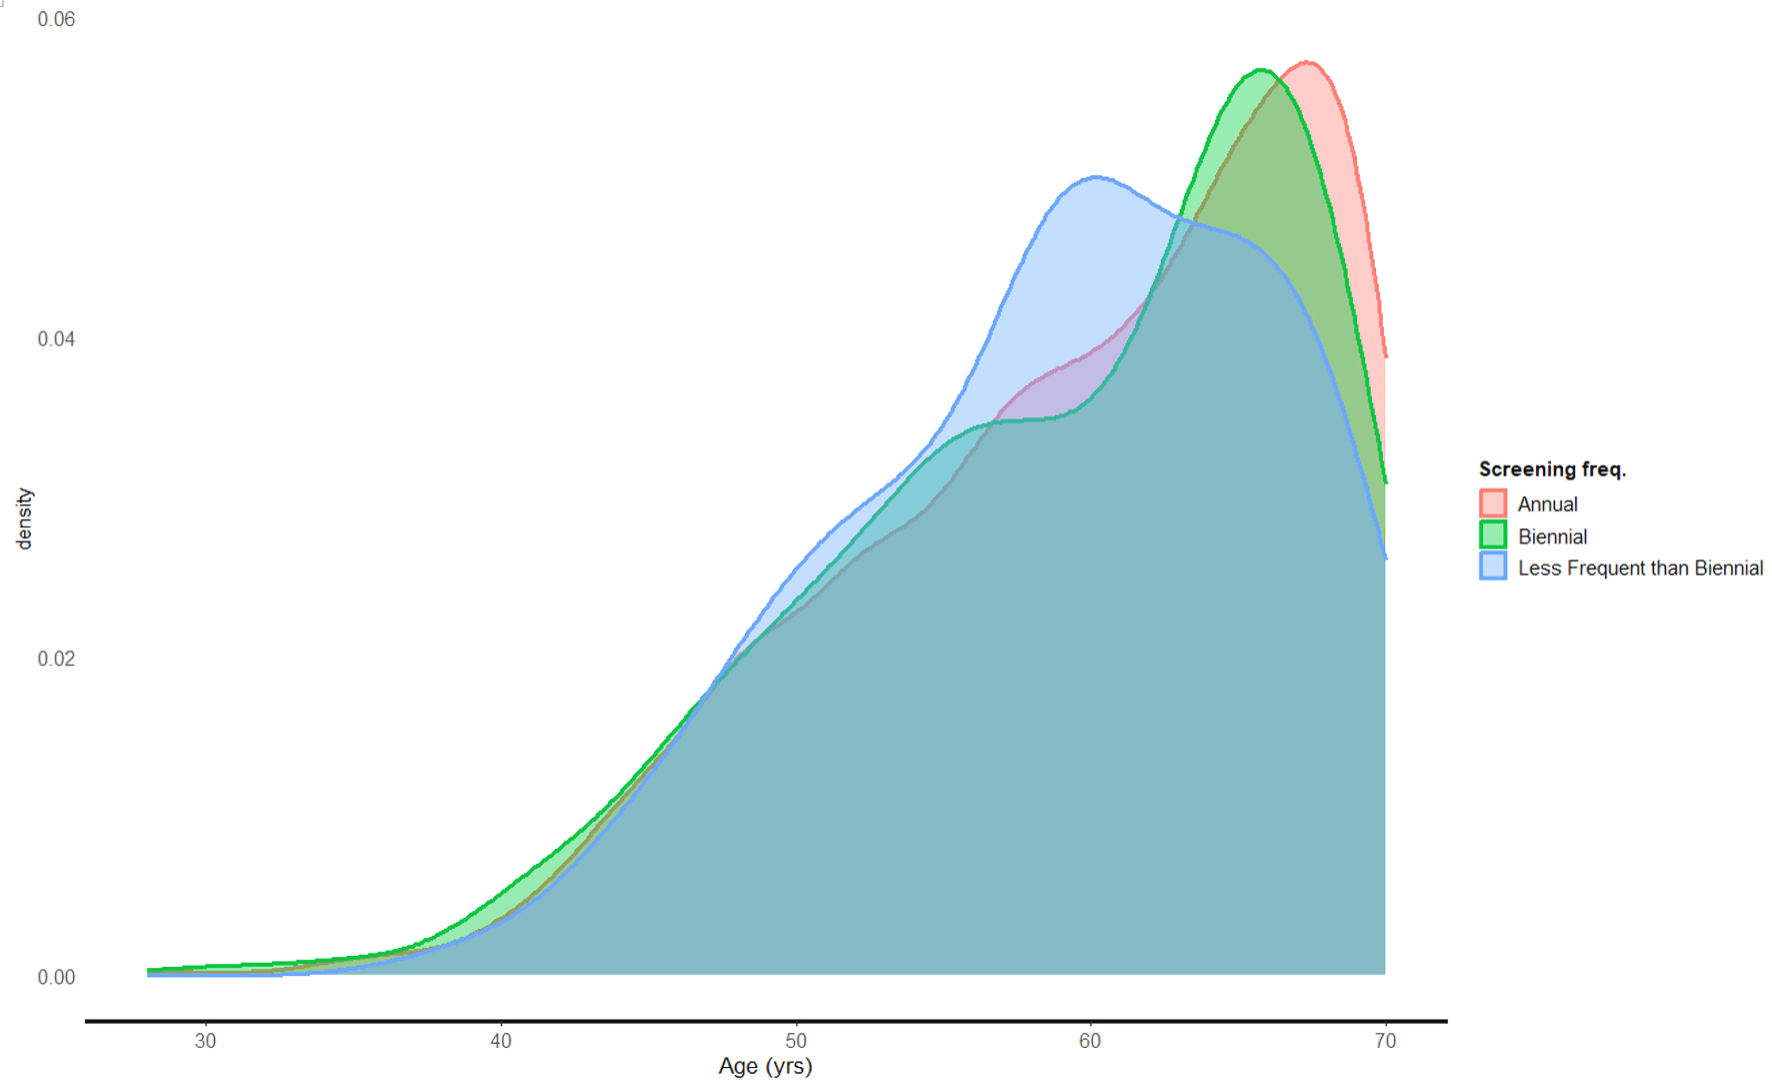
↓ Figure 1. Screening frequency according to
age.
| Journal of Clinical Medicine Research, ISSN 1918-3003 print, 1918-3011 online, Open Access |
| Article copyright, the authors; Journal compilation copyright, J Clin Med Res and Elmer Press Inc |
| Journal website https://jocmr.elmerjournals.com |
Original Article
Volume 16, Number 12, December 2024, pages 608-624
A Retrospective Chart Analysis Comparing Breast Cancer Detection Rates Between Annual Versus Biennial Mammograms
Figures
Tables
| BI-RADS category | Description |
|---|---|
| BI-RADS: Breast Imaging Reporting and Data System. | |
| 0 | Additional views or sonography required |
| 1 | No abnormalities identified |
| 2 | Not entirely normal, but definitely benign |
| 3 | Probably benign |
| 4A | Low suspicious for malignancy, but intervention required |
| 4B | Intermediate suspicion for malignancy, intervention required |
| 4C | Moderate suspicion, but not classic for carcinoma |
| 5 | Almost certainly malignant |
| 6 | Biopsy-proven carcinoma |
| Tumor | Lymph node | Metastasis | Grade | ER | PR | Stage |
|---|---|---|---|---|---|---|
| Grade: tumor grade (1 = low, 2 = intermediate, 3 = high). ER: estrogen receptor; PR: progesterone receptor; TNM stage: tumor, node, metastasis stage. | ||||||
| T1 | N0 | M0 | 1 | Positive | Positive | IA |
| T1 | N0 | M0 | 1 | Positive | Negative | IB |
| T1 | N0 | M0 | 1 | Negative | Negative | IIA |
| T1 | N0 | M0 | 2 | Positive | Positive | IIA |
| T1 | N0 | M0 | 2 | Positive | Negative | IIB |
| T1 | N0 | M0 | 2 | Negative | Negative | IIIA |
| T2 | N0 | M0 | 1 | Positive | Positive | IIA |
| T2 | N0 | M0 | 1 | Positive | Negative | IIB |
| T2 | N0 | M0 | 1 | Negative | Negative | IIIA |
| T2 | N0 | M0 | 2 | Positive | Positive | IIIA |
| T2 | N0 | M0 | 2 | Positive | Negative | IIIB |
| T2 | N0 | M0 | 2 | Negative | Negative | IIIC |
| T3 | N0 | M0 | 1 | Positive | Positive | IIIA |
| T3 | N0 | M0 | 1 | Positive | Negative | IIIB |
| T3 | N0 | M0 | 1 | Negative | Negative | IIIC |
| T4 | N0 | M0 | 1 | Any | Any | IIIC |
| T1 | N1 | M0 | 1 | Any | Any | IIB |
| T1 | N1 | M0 | 2 | Any | Any | IIIA |
| T2 | N1 | M0 | 1 | Any | Any | IIIA |
| T2 | N1 | M0 | 2 | Any | Any | IIIB |
| T3 | N1 | M0 | 1 | Any | Any | IIIB |
| T3 | N1 | M0 | 2 | Any | Any | IIIC |
| Any T | N2 | M0 | Any | Any | Any | IIIC |
| Any T | N3 | M0 | Any | Any | Any | IV |
| Any T | Any N | M1 | Any | Any | Any | IV |
| T | Tumor size |
|---|---|
| TNM stage: tumor, node, metastasis stage; DCIS: ductal carcinoma in situ. | |
| TX | The primary tumor cannot be assessed. |
| T0 | No evidence of primary tumor. |
| Tis | Carcinoma in situ (DCIS, or Paget disease of the breast with no associated tumor mass) |
| T | Tumor is 2 cm (3/4 of an inch) or less across. |
| T1mi | Microinvasive carcinoma: tumor is 0.1 cm or less across. |
| T2 | Tumor is more than 2 cm but not more than 5 cm (2 inches) across. |
| T3 | Tumor is more than 5 cm across. |
| T4 | Tumor of any size growing into the chest wall or skin. |
| N | Node involvement |
| NX | Nearby lymph nodes cannot be assessed. |
| N0 | No spread to nearby lymph nodes. |
| N1 | Cancer has spread to fewer than three lymph nodes located on the underarm or has spread to any number of lymph nodes located near the breastbone (internal mammary lymph nodes). |
| N2 | Cancer has spread to four or more lymph nodes located on the underarm or has spread to lymph nodes located in the chest outside of the underarm. |
| N3 | Cancer has spread to lymph nodes located in the neck. |
| M | Metastasis |
| MX | Distant spread cannot be assessed |
| M0 | There is no evidence of distant metastases |
| M1 | There is evidence of distant metastases. |
| Characteristic | Annual (n = 1,728)a | Biennial (n = 384)a | Less frequent than biennial (n = 107)a |
|---|---|---|---|
| aMean (SD); n (%). SD: standard deviation. | |||
| Age (years) | 60 (8) | 59 (8) | 59 (7) |
| Race | |||
| White | 1,497 (87%) | 324 (84%) | 98 (92%) |
| Black or African American | 111 (6.4%) | 24 (6.3%) | 3 (2.8%) |
| Asian | 17 (1.0%) | 4 (1.0%) | 1 (0.9%) |
| Other | 103 (6.0%) | 32 (8.3%) | 5 (4.7%) |
| Ethnicity | |||
| Hispanic or Latina | 98 (5.7%) | 34 (8.9%) | 5 (4.7%) |
| Not Hispanic or Latina | 1,630 (94%) | 350 (91%) | 102 (95%) |
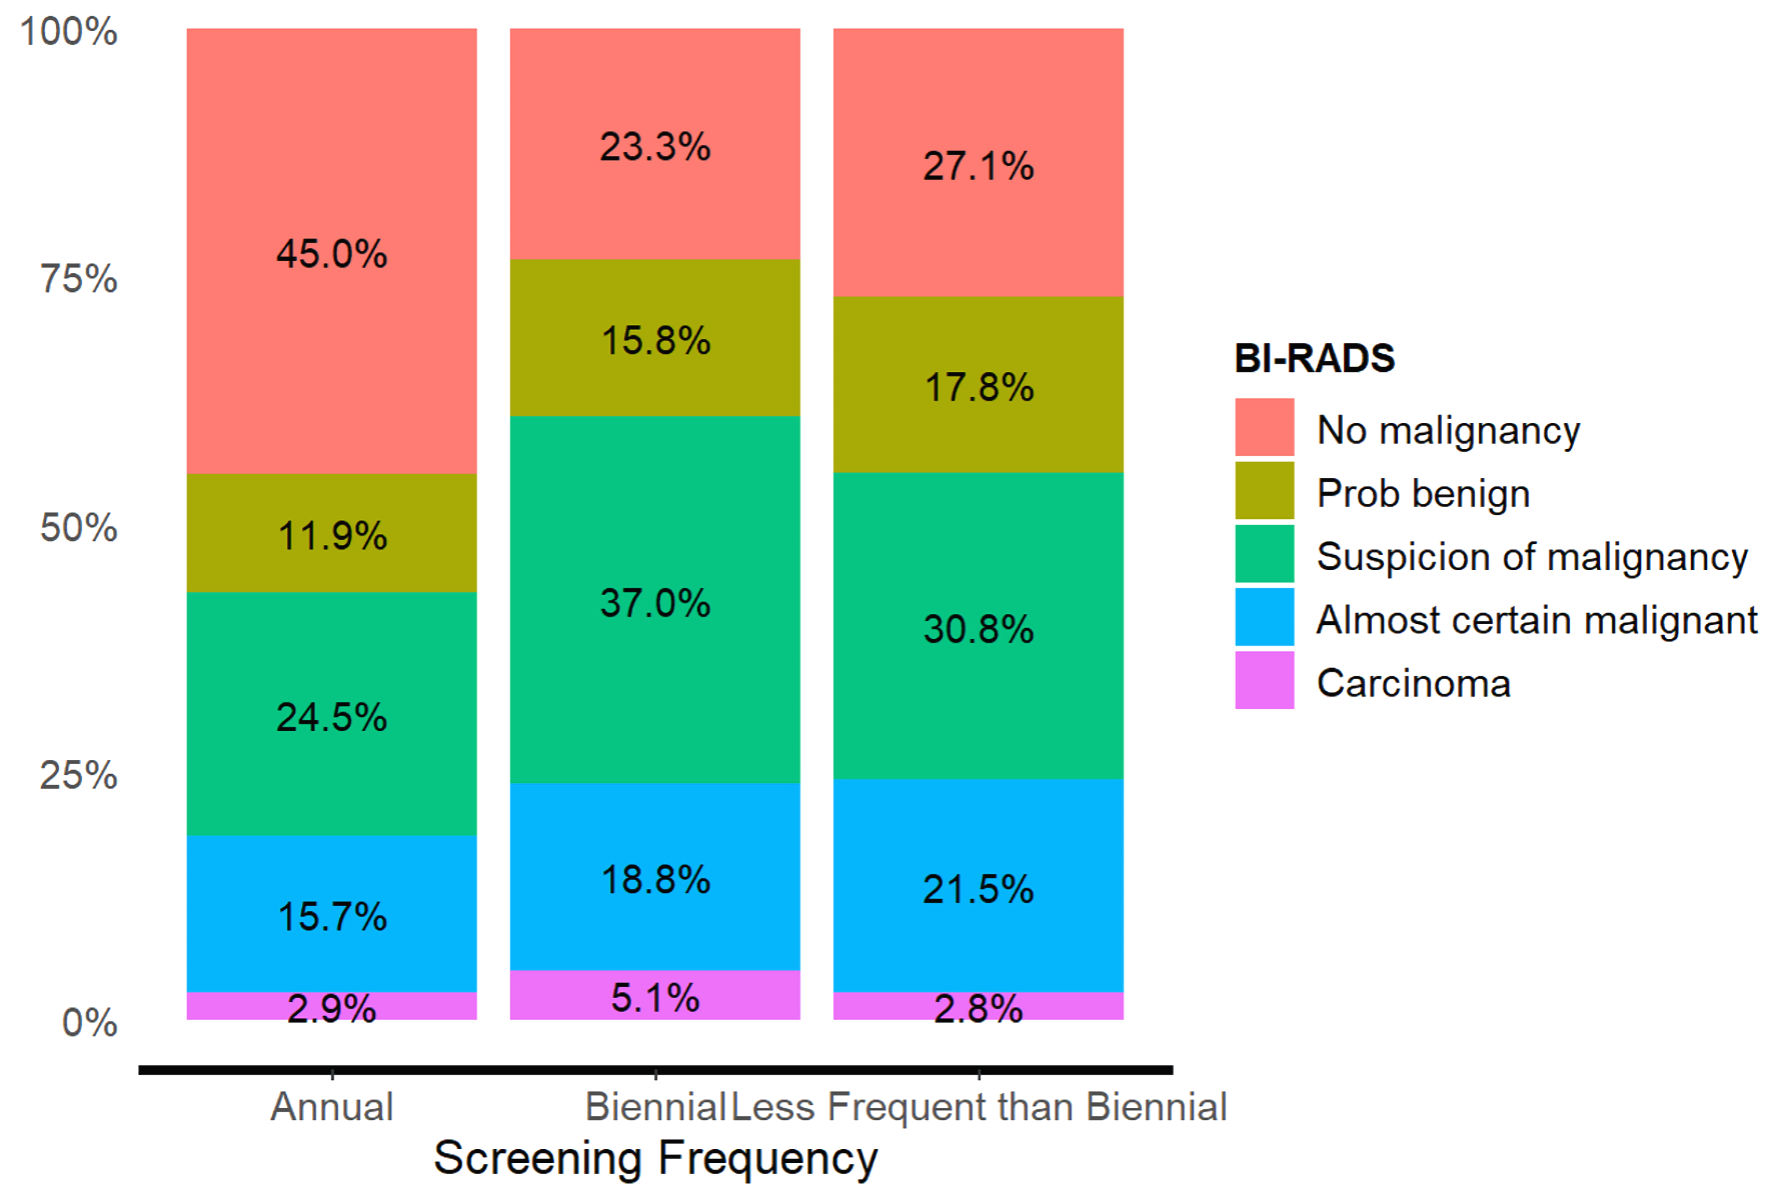
| BI-RADS | Screening frequency | Total | ||
|---|---|---|---|---|
| Annual | Biennial | Less frequent than biennial | ||
| χ2 = 72.2, df = 8, P < 0.001, Cramer’s V = 0.13. BI-RADS: Breast Imaging Reporting and Data System. | ||||
| No malignancy | 741 (45.0%) | 87 (23.3%) | 29 (27.1%) | 857 (40.3%) |
| Probably benign | 196 (11.9%) | 59 (15.8%) | 19 (17.8%) | 274 (12.9%) |
| Suspicion of malignancy | 404 (24.5%) | 138 (37.0%) | 33 (30.8%) | 575 (27.0%) |
| Almost certain malignant | 259 (15.7%) | 70 (18.8%) | 23 (21.5%) | 352 (16.5%) |
| Carcinoma | 47 (2.9%) | 19 (5.1%) | 3 (2.8%) | 69 (3.2%) |
| Total | 1,647 (100.0%) | 373 (100.0%) | 107 (100.0%) | 2,127 (100.0%) |
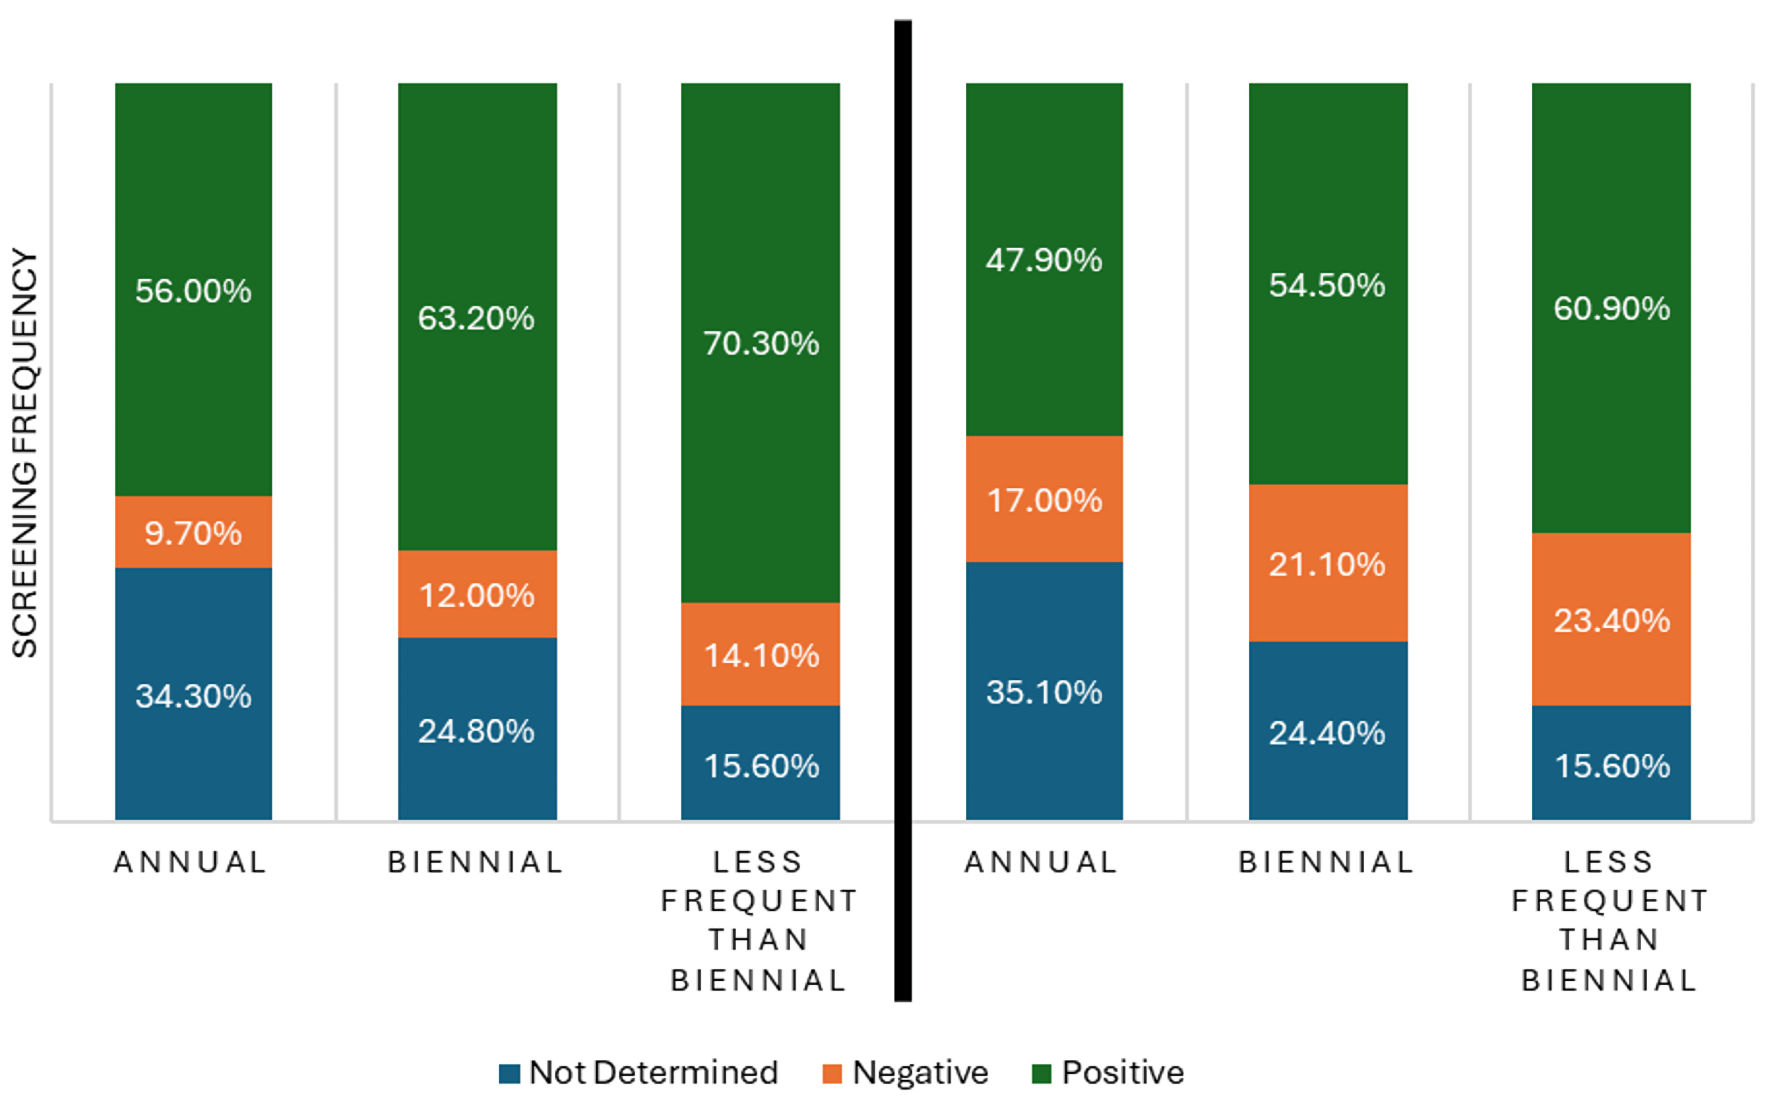
| ER status | Screening frequency | Total | ||
|---|---|---|---|---|
| Annual | Biennial | Less frequent than biennial | ||
| χ2 = 16.2, df = 4, P = 0.003. Cramer’s V = 0.08. ER: estrogen receptor. | ||||
| Not determined | 350 (34.3%) | 60 (24.8%) | 10 (15.6%) | 420 (31.7%) |
| Negative | 99 (9.7%) | 29 (12.0%) | 9 (14.1%) | 137 (10.3%) |
| Positive | 572 (56.0%) | 153 (63.2%) | 45 (70.3%) | 770 (58.0%) |
| Total | 1,021 (100.0%) | 242 (100.0%) | 64 (100.0%) | 1,327 (100.0%) |
| PR status | Screening frequency | Total | ||
|---|---|---|---|---|
| Annual | Biennial | Less frequent than biennial | ||
| χ2 = 18.9, df = 2, P = 0.001, Cramer’s V = 0.08. PR: progesterone receptor. | ||||
| Not determined | 358 (35.1%) | 59 (24.4%) | 10 (15.6%) | 427 (32.2%) |
| Negative | 174 (17.0%) | 51 (21.1%) | 15 (23.4%) | 240 (18.1%) |
| Positive | 489 (47.9%) | 132 (54.5%) | 39 (60.9%) | 660 (49.7%) |
| Total | 1,021 (100.0%) | 242 (100.0%) | 64 (100.0%) | 1,327 (100.0%) |
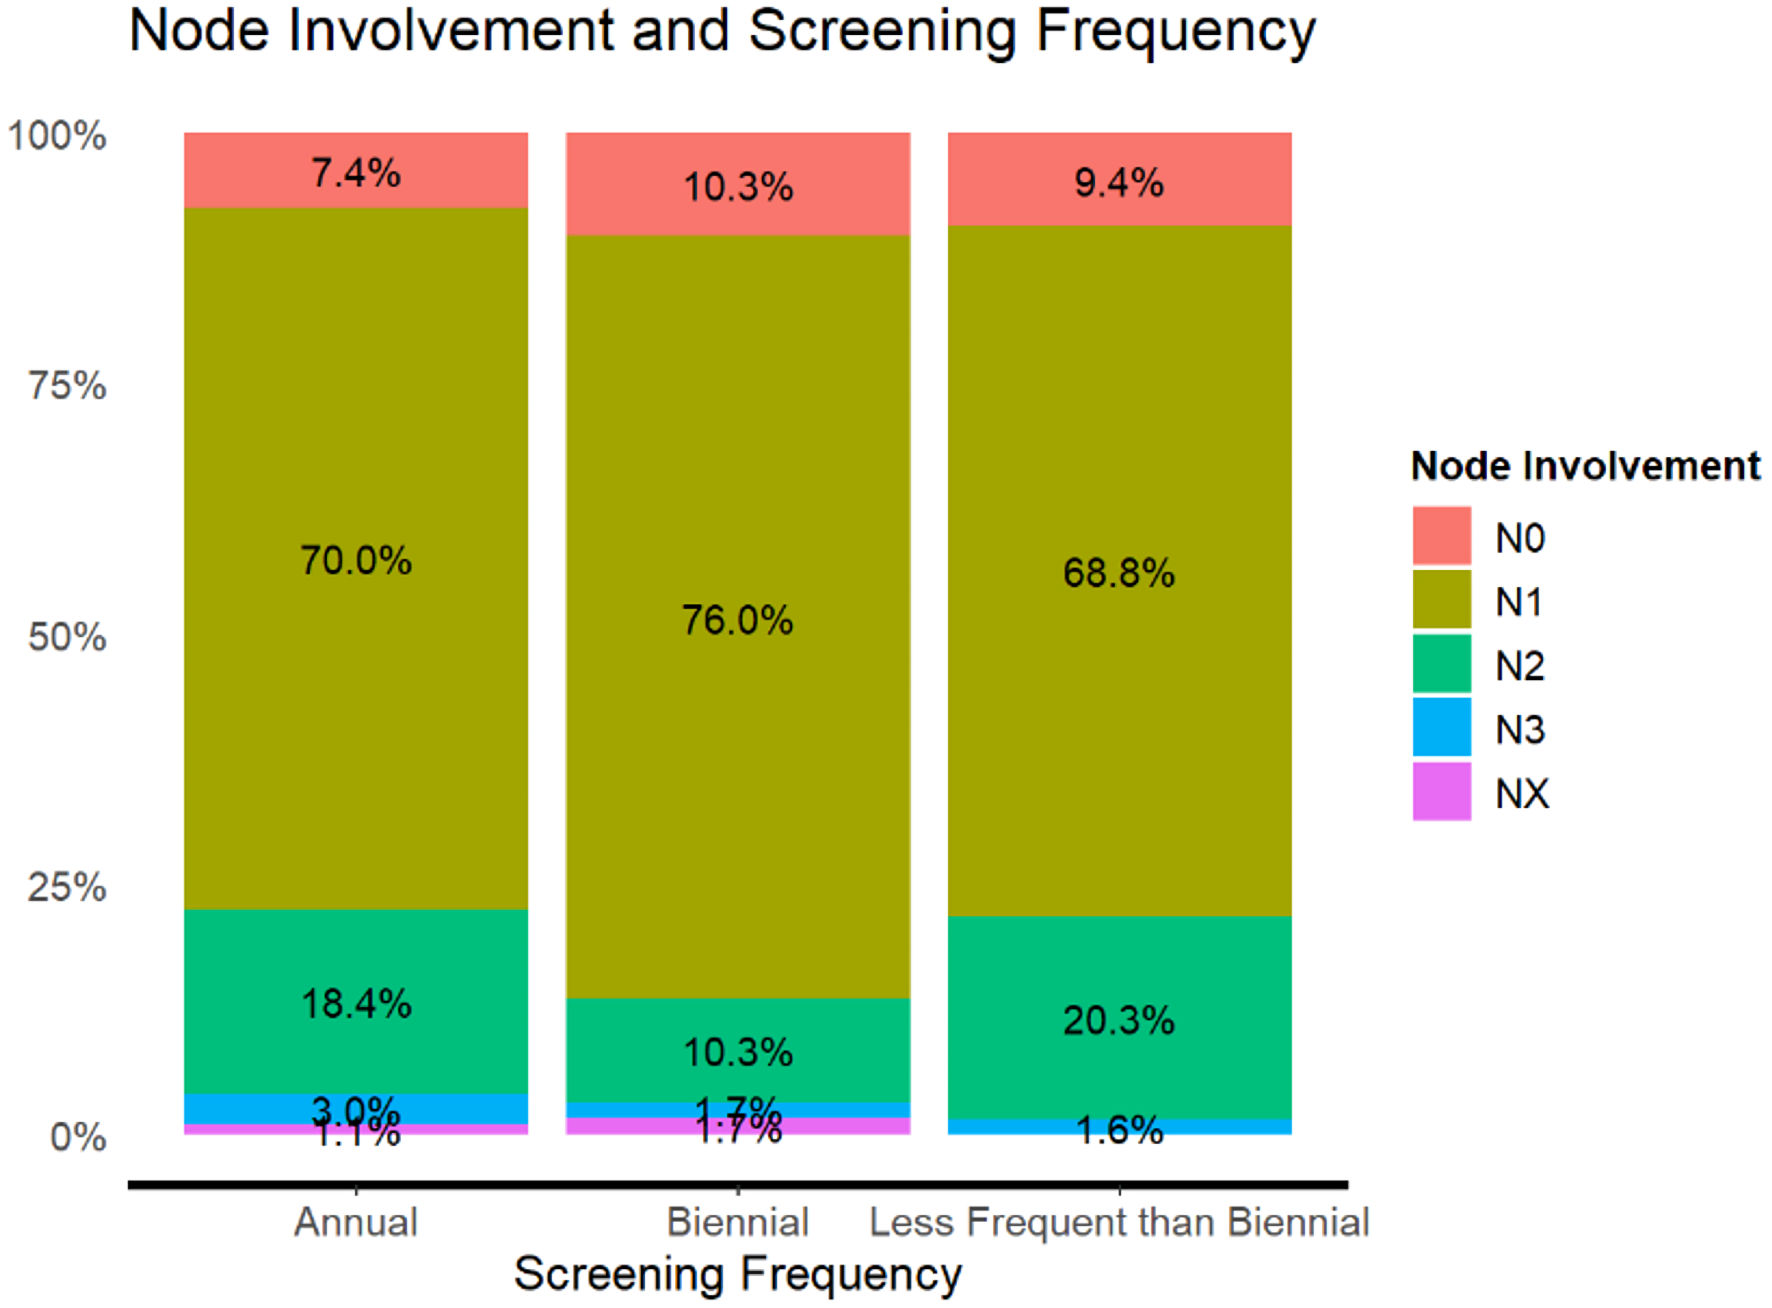
| Node involvement | Screening frequency | Total | ||
|---|---|---|---|---|
| Annual | Biennial | Less frequent than biennial | ||
| χ2 = 14.8, df = 8, Cramer’s V = 0.10. | ||||
| N0 | 76 (7.4%) | 25 (10.3%) | 6 (9.4%) | 107 (8.1%) |
| N1 | 715 (70.0%) | 184 (76.0%) | 44 (68.8%) | 943 (71.1%) |
| N2 | 188 (18.4%) | 25 (10.3%) | 13 (20.3%) | 226 (17.0%) |
| NX | 11 (1.1%) | 4 (1.7%) | 0 (0.0%) | 15 (1.1%) |
| Total | 1,021 (100.0%) | 242 (100.0%) | 64 (100.0%) | 1,327 (100.0%) |
| Organization | Guidelines |
|---|---|
| American Cancer Society (ACS) [45] | Annual screening between 45 and 55 years |
| Biennial screening > 55 years | |
| US Preventive Services Task Force (USPSTF) [46] | Biennial screenings between 40 and 75 years |
| American Academy of Family Physicians [47] | Biennial screening between 40 and 75 years |
| American College of Radiology (ACR) [48] | Average risk: annual screening from 40 years beyond 75 years |
| National Comprehensive Cancer Network [49] | Higher risk: annual, earlier screening with additional imaging |