Journal of Clinical Medicine Research, ISSN 1918-3003 print, 1918-3011 online, Open Access
Article copyright, the authors; Journal compilation copyright, J Clin Med Res and Elmer Press Inc
Journal website https://jocmr.elmerjournals.com

Original Article

Volume 000, Number 000, November 2024, pages 000-000


Association Between the Development of Sensorineural Hearing Loss and Blood NAD+ Levels

Figures

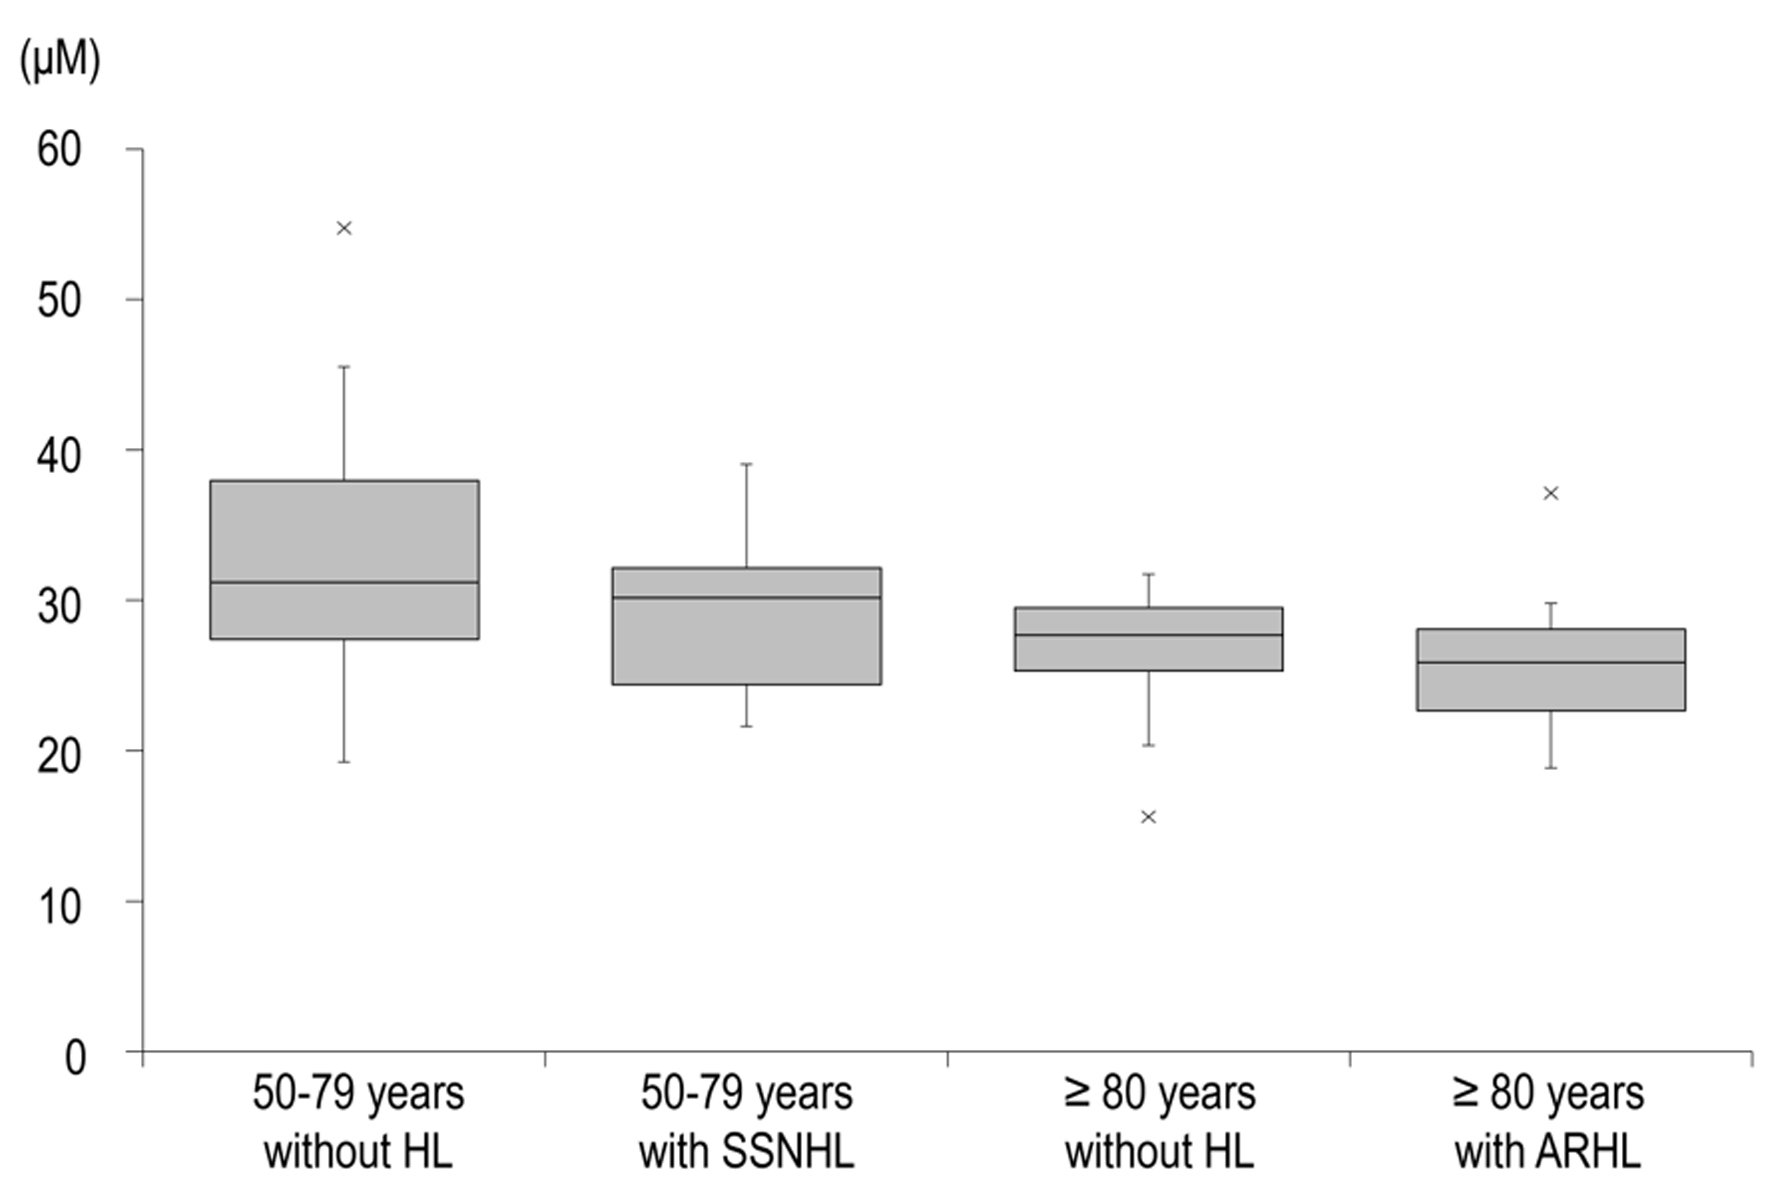
Figure 1.
Figure 1. Distribution of NAD+ levels in each group. The boxes indicate the IQR, the black band in the middle of each box indicates the median, and the upper and lower whiskers indicate the upper and lower limits of the 1.5-fold range of the IQR, respectively. Data are median (interquartile range). ARHL: age-related hearing loss; HL: hearing loss; IQR: interquartile range; NAD+: nicotinamide adenine dinucleotide; SSNHL: sudden sensorineural hearing loss.
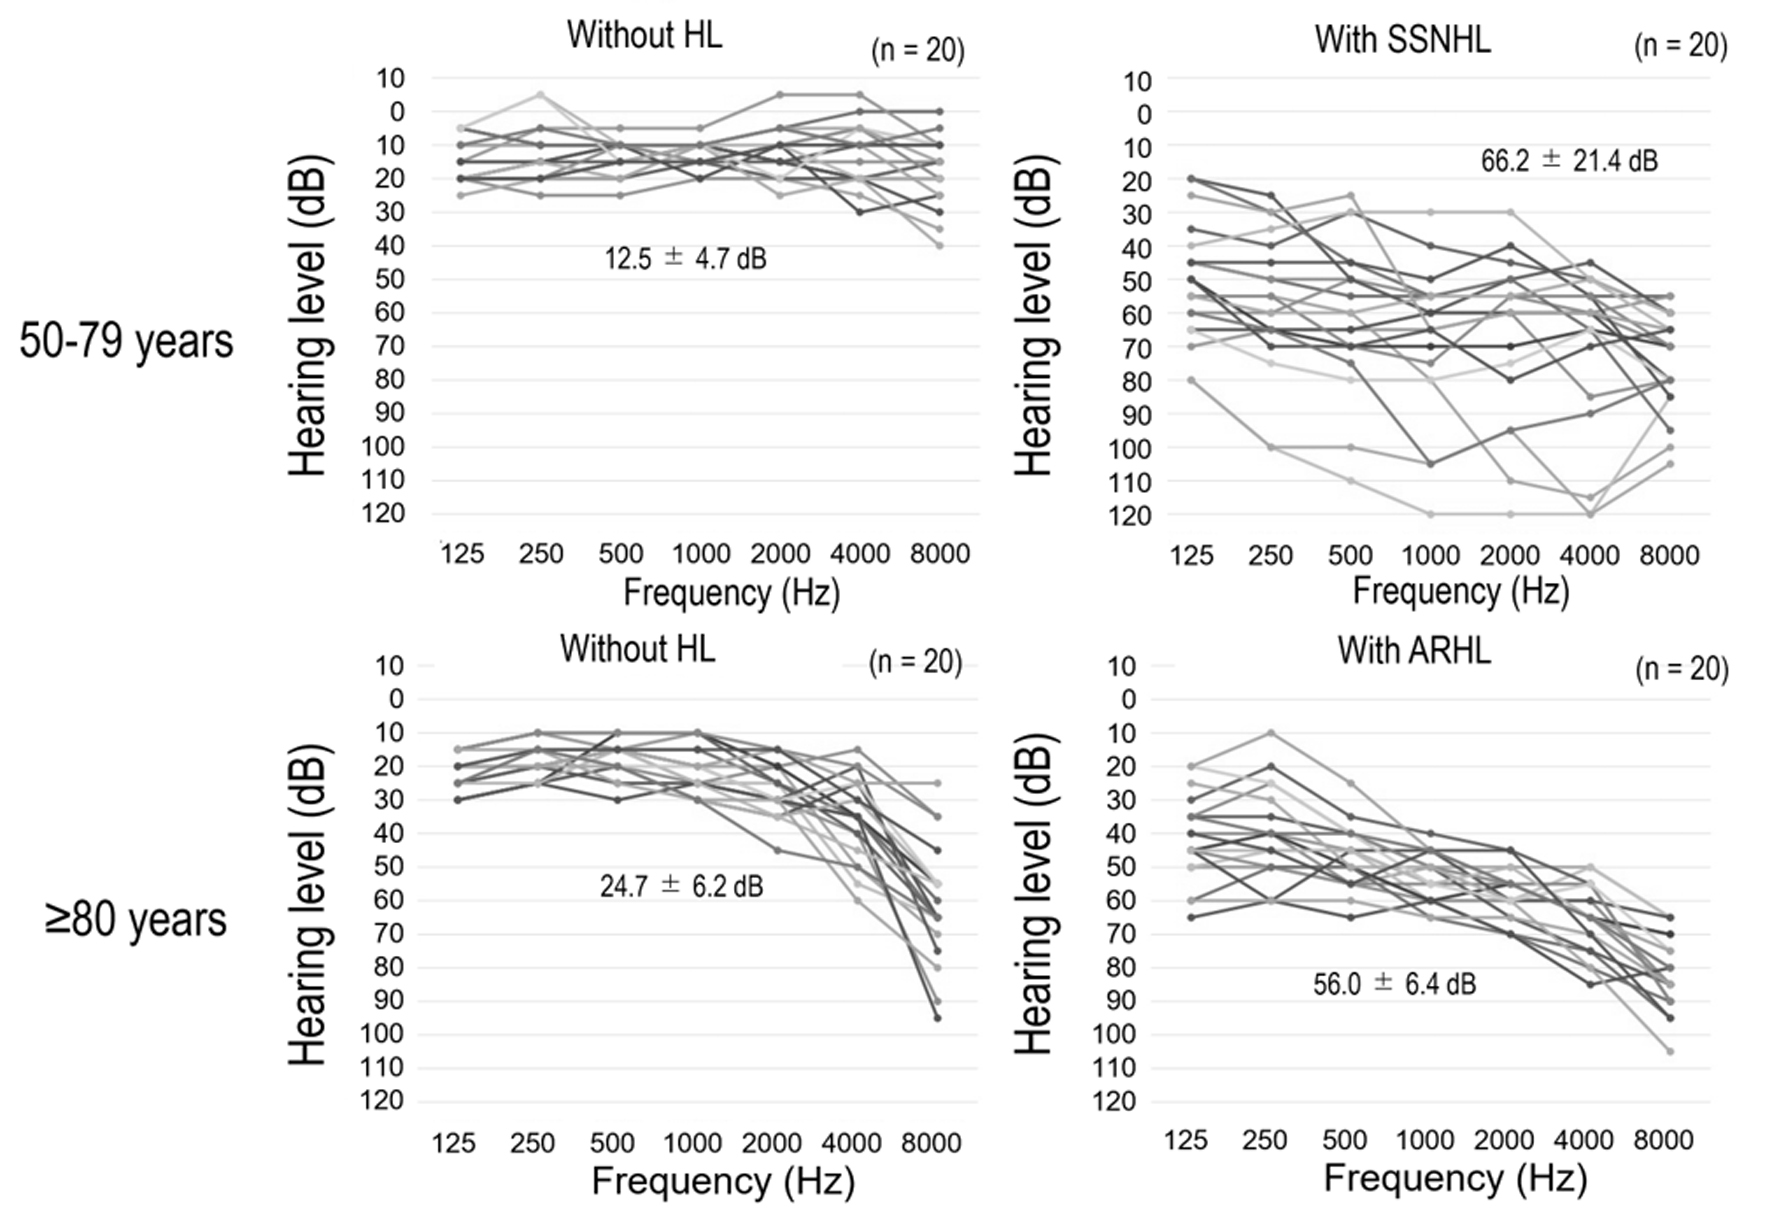
Figure 2.
Figure 2. Audiograms for each group. All data are from the side of the ear with the poorer test result, and the values are the means of six frequencies. ARHL: age-related hearing loss; HL: hearing loss; SSNHL: sudden sensorineural hearing loss.

Tables

Table 1. Patient Characteristics
 
Factor50 - 79 years without HL (n = 20)50 - 79 years with SSNHL (n = 20)P-value for between-group comparison (50 - 79 years)≥ 80 years without HL (n = 20)≥ 80 years with ARHL (n = 20)P-value for between-group comparison (≥ 80 years)
Data are n (%) or mean ± standard deviation or median (interquartile range). aFisher’s exact test. bStudent’s t-test. cWilcoxon rank sum test. HL: hearing loss; SSNHL: sudden sensorineural hearing loss; ARHL: age-related hearing loss; M: male; F: female; BAP: biological antioxidant potential; dROMs: diacron-reactive oxygen metabolites; Zn: zinc; HSV: herpes simplex virus; NAD+: nicotinamide adenine dinucleotide; VSV: vesicular stomatitis virus.
Sex (M/F)5 (25.0)/15 (75.0)6 (30.0)/14 (70.0)1.000a2 (10.0)/18 (90.0)5 (25.0)/15 (75.0)0.407a
Age (years)54.05 ± 4.6660.05 ± 7.800.005b83.40 ± 3.8985.35 ± 4.180.135b
Hypertension1 (5.0)8 (40.0)0.020a11 (55.0)7 (35.0)0.341a
Diabetes0 (0.0)2 (10.0)0.487a1 (5.0)6 (30.0)0.091a
BAP (µM)2,180.75 ± 178.082,222.50 ± 206.990.498b2,139.05 ± 162.632,177.45 ± 140.930.430b
dROMs (U.CARR)325.20 ± 41.93357.85 ± 64.650.066b346.70 ± 57.69369.65 ± 52.740.197b
Zn (µg/dL)77.80 ± 11.8881.30 ± 14.140.402b74.50 ± 9.2773.80 ± 10.300.822b
HSV (copies/× 106 cells)16.40 (10.60 - 38.02)18.05 (8.03 - 29.58)0.882c24.15 (14.88 - 29.65)25.30 (15.40 - 37.88)0.829c
NAD+ (µM)31.25 (27.47 - 37.98)30.21 (24.44 - 32.19)0.245c27.69 (25.34 - 29.50)25.91 (22.69 - 28.13)0.144c
VSV6.30 (0.67 - 67.35)29.70 (0.60 - 68.42)0.829c66.90 (50.58 - 76.82)66.90 (45.52 - 75.70)0.892c


Table 2. Comparison of NAD+ Levels With and Without Hearing Loss (ANCOVA)
 
Age groupWithout HLWith HLDifference between groupsP-value
Data are least squared mean ± standard error. Covariates for analysis of 50 - 79 age group: Zn, d-ROM, BAP. Covariates for analysis of 80+ age group: sex, d-ROM, BAP. *P < 0.05, ANCOVA. ANCOVA: analysis of covariance; HL: hearing loss; NAD+: nicotinamide adenine dinucleotide.
50 - 79 years32.13 ± 1.6329.27 ± 1.632.86 ± 2.360.232
≥ 80 years27.56 ± 0.8525.00 ± 0.852.55 ± 1.240.047*


Table 3. Factor Analysis for SNHL
 
VariableOdds ratio95% CIP-value
*P < 0.05, Wald’s Chi-squared test. BAP: biological antioxidant potential; CI: confidence interval; Zn: zinc; NAD+: nicotinamide adenine dinucleotide; dROMs: diacron-reactive oxygen metabolites; SNHL: sensorineural hearing loss.
Male:16.821.53 - 30.350.012*
Age (years)1.000.97 - 1.040.854
Zn (µg/dL)1.010.96 - 1.050.786
NAD+ (µM)0.900.81 - 1.000.047*
dROMs (U.CARR)1.011.00 - 1.030.014*
BAP (µM)1.001.00 - 1.000.587