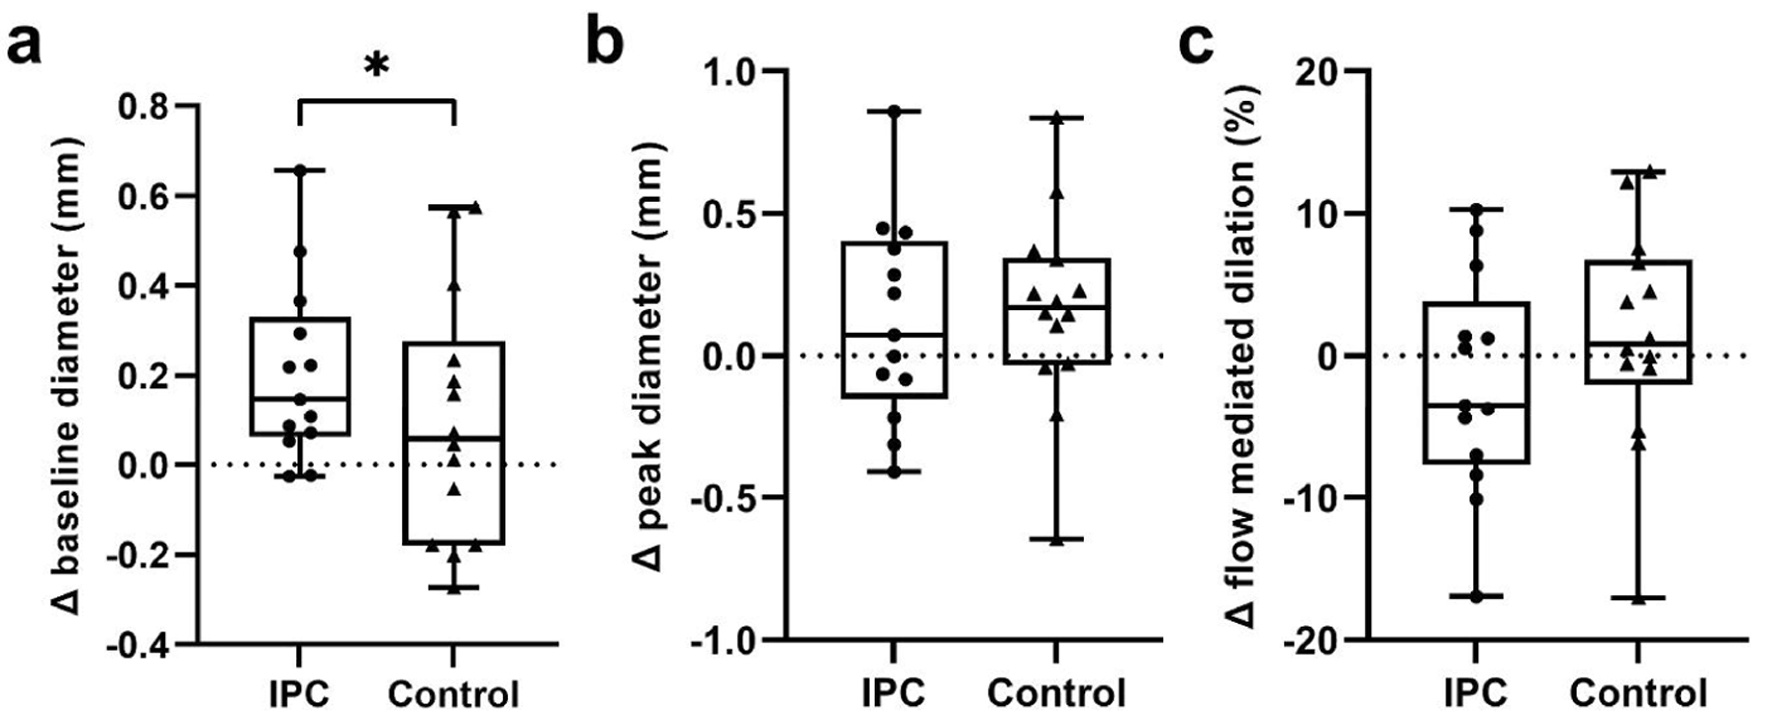
↓ Figure 1. (a) Change in baseline diameter, (b)
peak diameter and (c) flow-mediated dilation of the brachial artery with a 2-week period of daily IPC or
a control period in cerebral small vessel occlusion stroke patients. *Significant difference between
control and IPC; P < 0.05. IPC: ischemic preconditioning.
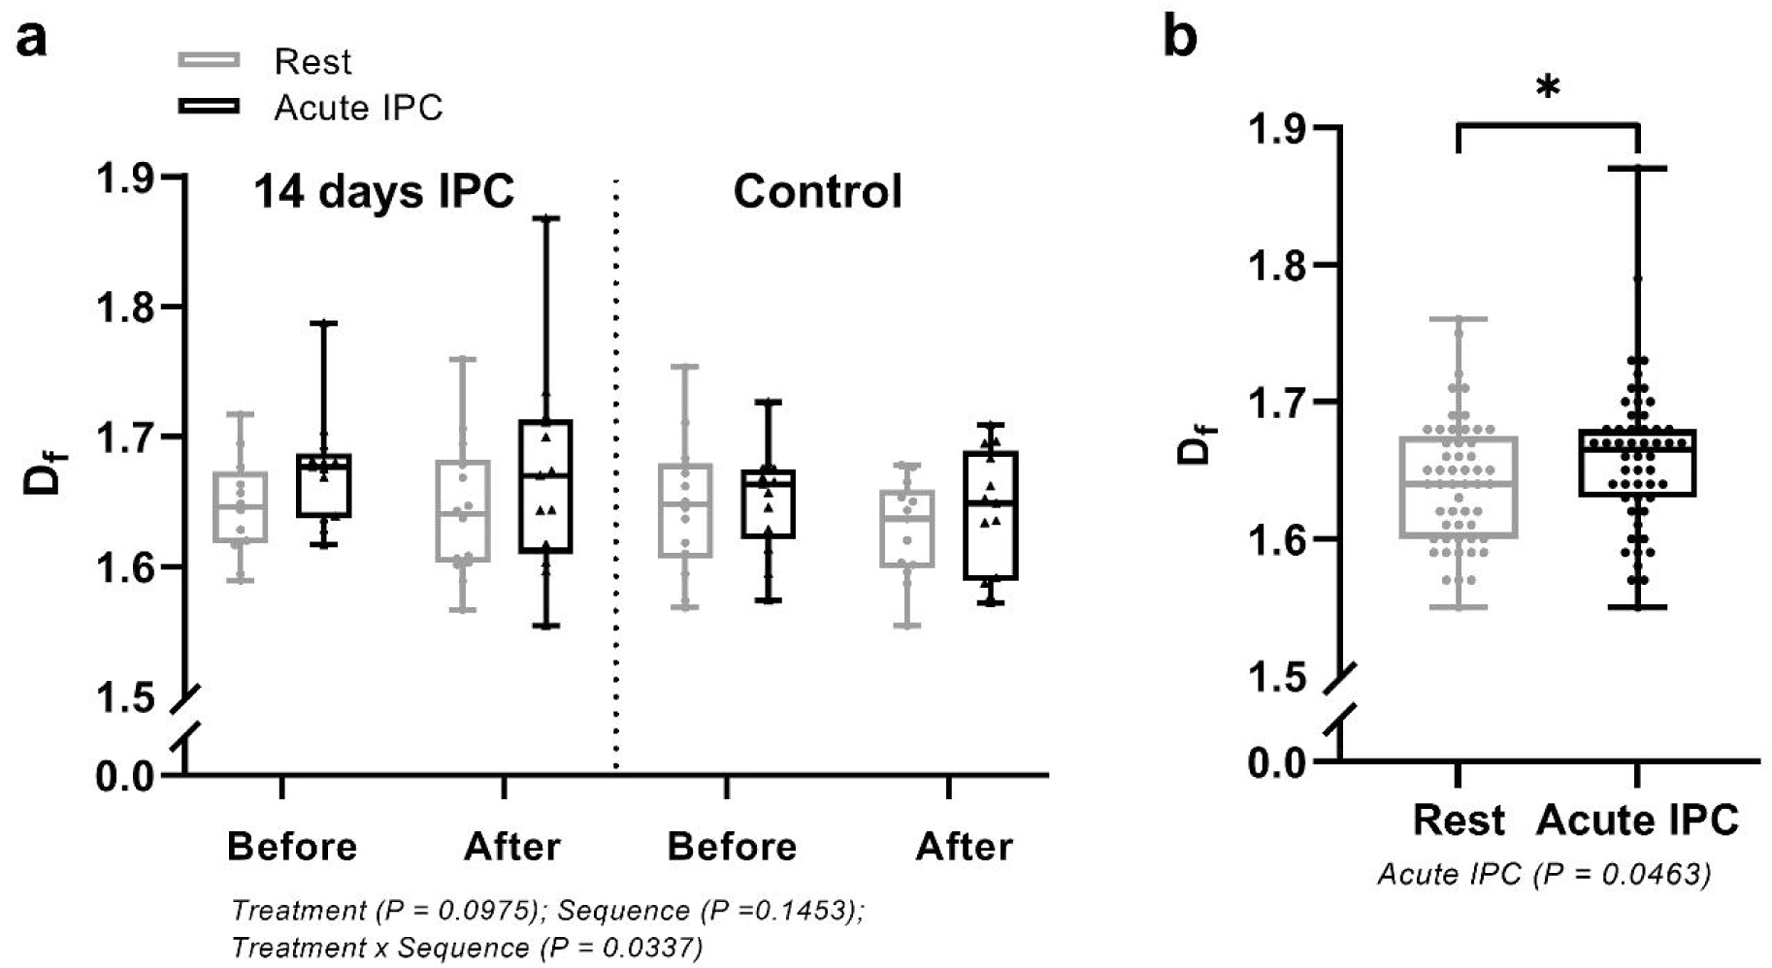
↓ Figure 2. Fractal dimension (df) in
cerebral small vessel occlusion stroke patients (a) before and after an acute bout of IPC conducted
before and after a 2-week period of daily IPC or a 2-week control period and (b) before and after an
acute bout of IPC. Data combined from the acute interventions. *Significant difference between control
and IPC; P < 0.05. IPC: ischemic preconditioning.
↓ Figure 3. Plasma indicators of thrombogenesis:
(a, b) D-dimer, (c, d) PAI-1 and (e, f) fibrinogen, before and after an acute bout of IPC conducted
before and after a 2-week period of daily IPC, or a 2-week control period, in cerebral small vessel
occlusion stroke patients. *Significant difference between control and IPC; P < 0.05. IPC: ischemic
preconditioning.
