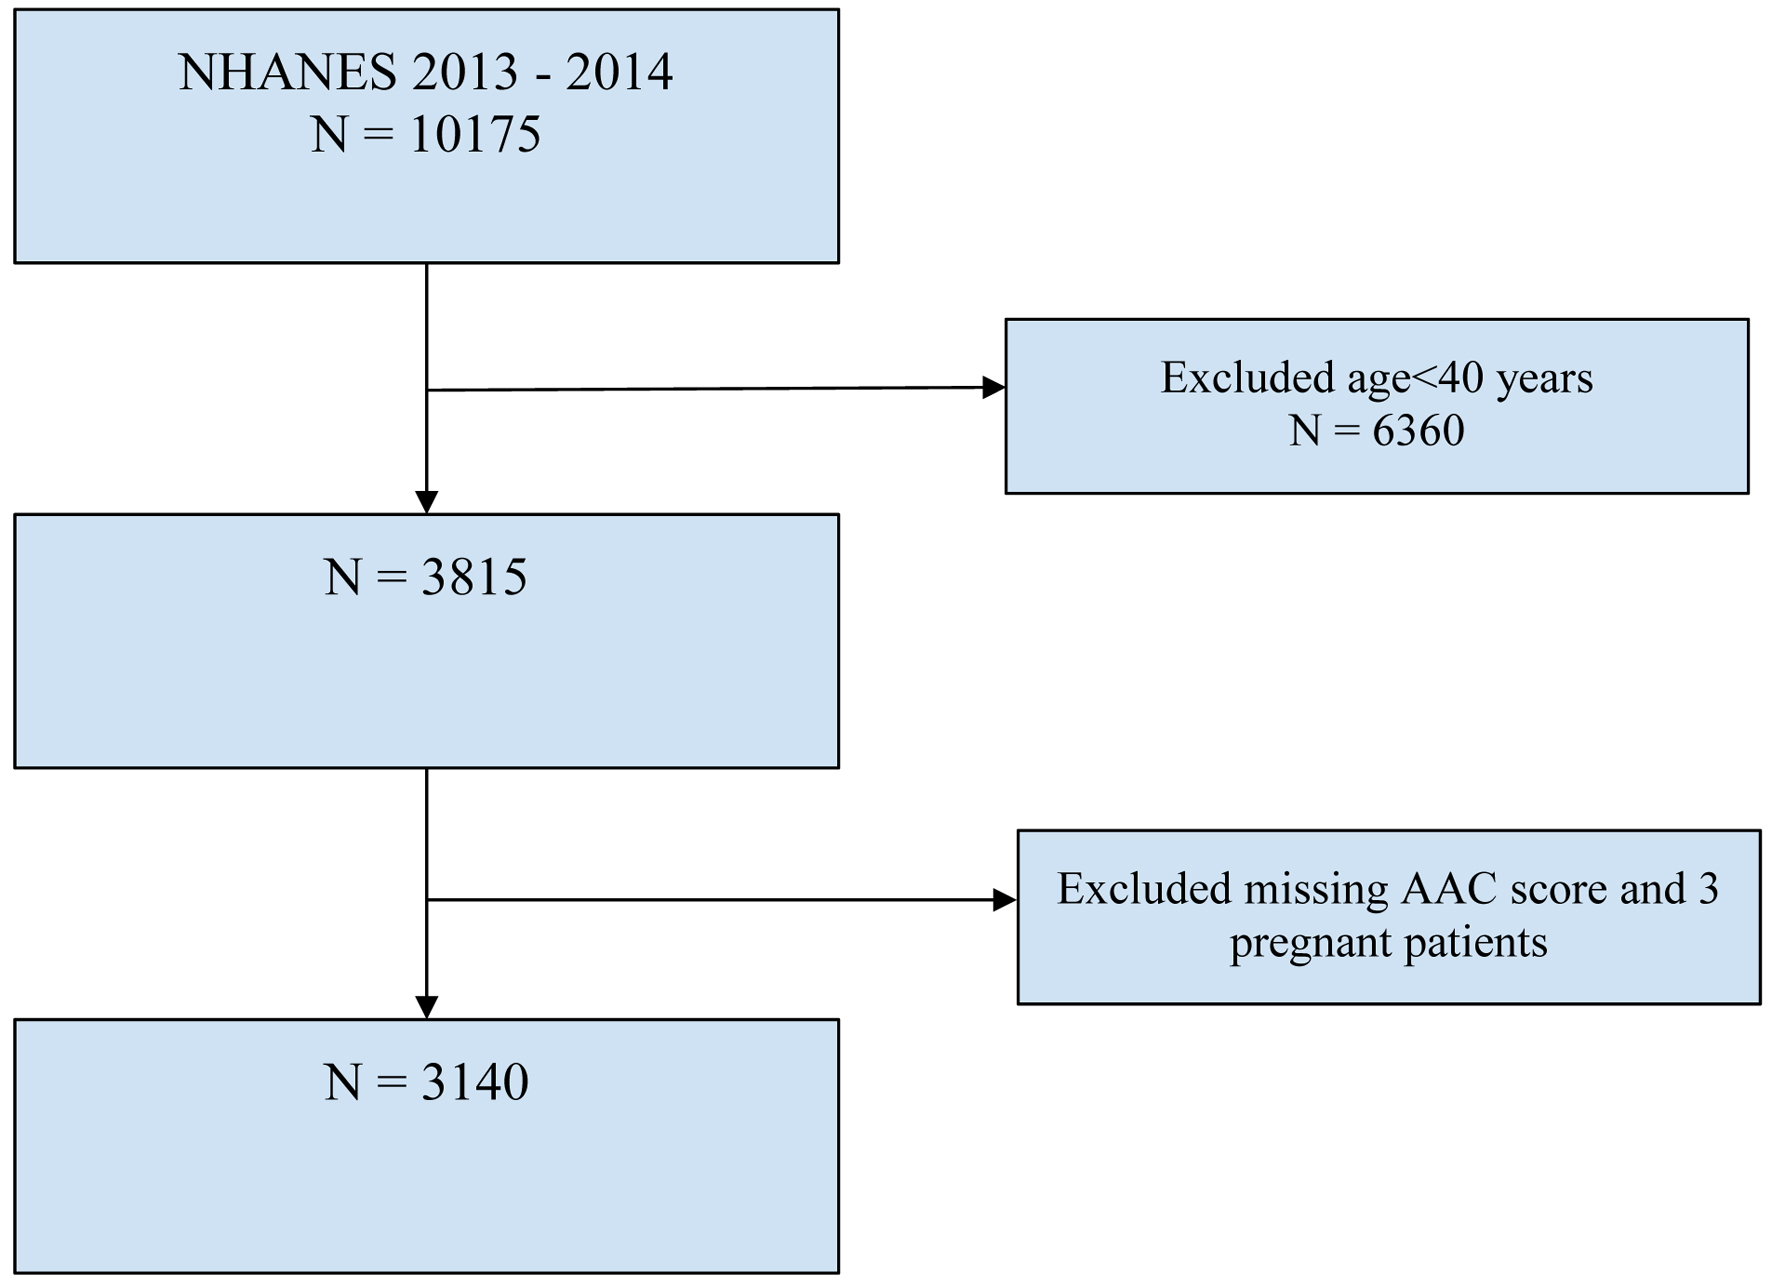
↓ Figure 1. Flowchart of selection of
participants. AAC: abdominal aortic calcification; NHANES: National Health and Nutrition Examination
Survey.
| Journal of Clinical Medicine Research, ISSN 1918-3003 print, 1918-3011 online, Open Access |
| Article copyright, the authors; Journal compilation copyright, J Clin Med Res and Elmer Press Inc |
| Journal website https://jocmr.elmerjournals.com |
Original Article
Volume 16, Number 12, December 2024, pages 589-599
Association Between Chronic Kidney Disease Risk Categories and Abdominal Aortic Calcification: Insights From the National Health and Nutrition Examination Survey
Figure
Tables
| Variables | Severe AAC, n = 423, Population size (weighted estimate = 14,592,085) | No severe AAC, n = 2,717, Population size (weighted estimate = 112,592,130) | P-value | ||
|---|---|---|---|---|---|
| Mean | SE | Mean | SE | ||
| AAC: abdominal aortic calcification; Apo B: apolipoprotein B; CI: confidence interval; eGFR: estimated glomerular filtration rate; Hb: hemoglobin; HDL: high-density lipoprotein; LDL: low-density lipoprotein; OR: odds ratio; SE: standard error. | |||||
| Age (years) | 69.2 | 1.0 | 55.9 | 0.5 | < 0.001 |
| Body mass index (kg/m2) | 27.2 | 0.8 | 28.7 | 0.2 | 0.09 |
| Urine albumin/creatinine ratio (mg/g) | 102.3 | 16.7 | 35.0 | 10.7 | 0.19 |
| Albumin (g/dL) | 4.2 | 0.03 | 4.2 | 0.02 | 0.61 |
| Creatinine (mg/dL) | 1.1 | 0.02 | 0.9 | 0.02 | 0.27 |
| Uric acid (mg/dL) | 5.7 | 0.2 | 5.4 | 0.04 | 0.082 |
| Sodium (mmol/L) | 140.2 | 0.2 | 139.9 | 0.1 | 0.19 |
| Potassium (mmol/L) | 4.2 | 0.04 | 4.1 | 0.02 | 0.054 |
| Bicarbonate (mmol/L) | 25.9 | 0.2 | 25.5 | 0.2 | 0.076 |
| Blood urea nitrogen (mg/dL) | 16.5 | 0.8 | 13.6 | 0.2 | 0.001 |
| Chloride (mmol/L) | 103.6 | 0.2 | 104.3 | 0.1 | 0.013 |
| Calcium (mg/dL) | 9.5 | 0.03 | 9.4 | 0.02 | 0.072 |
| eGFR (mL/min/1.73 m2) | 70.0 | 1.7 | 86.2 | 0.7 | 0.00001 |
| Phosphorus (mg/dL) | 3.8 | 0.05 | 3.7 | 0.02 | 0.04 |
| Klotho (pg/mL) | 799.9 | 22.3 | 842.0 | 13.3 | 0.1 |
| Lymphocyte (1,000 cells/µL) | 1.8 | 0.1 | 1.9 | 0.03 | 0.14 |
| Segmented neutrophils (1,000 cells/µL) | 4.1 | 0.1 | 4.1 | 0.1 | 0.34 |
| Hemoglobin (g/dL) | 14.1 | 0.2 | 14.3 | 0.1 | 0.18 |
| Platelet count (1,000 cells/µL) | 217.2 | 4.1 | 231.5 | 1.6 | 0.002 |
| Platelet/lymphocyte ratio | 137.0 | 6.3 | 131.1 | 1.3 | 0.23 |
| Neutrophil/lymphocyte ratio | 2.7 | 0.1 | 2.3 | 0.04 | 0.00001 |
| Triglycerides (mg/dL) | 140.8 | 7.6 | 135.7 | 4.9 | 0.5 |
| LDL-cholesterol (mg/dL) | 109.4 | 4.1 | 116.3 | 1.1 | 0.2 |
| HDL-cholesterol (mg/dL) | 55.3 | 1.8 | 55.3 | 0.5 | 0.98 |
| Insulin (µIU/mL) | 12.7 | 1.2 | 12.3 | 0.76 | 0.62 |
| HbA1c (%) | 6.1 | 0.1 | 5.7 | 0.027 | 0.034 |
| Apo B (mg/dL) | 92 | 2.59 | 94 | 2.7 | 0.44 |
| Variables | No AAC unweighted (n = 2,717) | No AAC weighted (n = 1.108 × 10⁸), SE 7.107 × 10⁶* | AAC unweighted (n = 423) | AAC weighted (1.490 × 10⁷) SE 1.154 × 10⁶* | OR | 95% CI | P-value |
|---|---|---|---|---|---|---|---|
| *Univariate analysis of demographic and clinical variables by the presence of severe abdominal aortic calcification. AAC: abdominal aortic calcification; CI: confidence interval; OR: odds ratio; SE: standard error. | |||||||
| Sex (male) | 1,314 (48%) | 5.37 × 10⁷ (48%) | 204 (48%) | 6.76 × 10⁶ (45%) | 0.89 | 0.6 - 1.30 | 0.49 |
| Race (Caucasian) | 1,129 (42%) | 7.78 × 10⁷ (70%) | 246 (58%) | 1.15 × 10⁷ (77%) | 1.43 | 0.96 - 2.14 | 0.07 |
| Hypertension | 1,460 (53%) | 5.56 × 10⁷ (50%) | 335 (79%) | 1.18 × 10⁷ (79%) | 3.77 | 2.8 - 5.10 | 0.00001 |
| Diabetes | 543 (20%) | 1.70 × 10⁷ (15% | 151 (36%) | 4.70 × 10⁶ (31%) | 2.53 | 1.93 - 3.30 | 0.00001 |
| Hypercholesterolemia | 1,275 (47%) | 5.34 × 10⁷ (48%) | 273 (61%) | 9.73 × 10⁶ (65%) | 2.03 | 1.57 - 2.61 | 0.00002 |
| Smoked more than 100 cigarettes in a lifetime | 1,207 (44%) | 4.91 × 10⁷ (44%) | 254 (57%) | 8.7 × 10⁶ (58%) | 1.75 | 1.30 - 2.40 | 0.0015 |
| Variables | OR | SE | 95% CI | P-value | |
|---|---|---|---|---|---|
| AAC: abdominal aortic calcification; CI: confidence interval; eGFR: estimated glomerular filtration rate; OR: odds ratio; Ref: reference; SE: standard error. | |||||
| Age | 1.10 | 0.01 | 1.05 | 1.11 | 0.00001 |
| History of hypertension | 1.83 | 0.48 | 1.04 | 3.21 | 0.03 |
| Smoking history | 1.76 | 0.45 | 1.03 | 3.0 | 0.04 |
| eGFR | 0.98 | 0.01 | 0.97 | 0.98 | 0.004 |
| Renal risk category | OR | SE | 95% CI | P-value | |
|---|---|---|---|---|---|
| AAC: abdominal aortic calcification; BMI: body mass index; CI: confidence interval; CKD: chronic kidney disease; OR: odds ratio; Ref: reference; SE: standard error. | |||||
| Multivariable logistic regression analysis of renal risk for CKD and AAC (unadjusted model) | |||||
| 1 | Ref. | Ref. | Ref. | Ref. | Ref. |
| 2 | 3.93 | 0.96 | 2.34 | 6.60 | < 0.001 |
| 3 | 3.75 | 1.74 | 1.40 | 10.08 | 0.012 |
| 4 | 10.48 | 5.95 | 3.13 | 35.14 | 0.001 |
| Multivariable logistic regression analysis of renal risk and AAC adjusted for age | |||||
| 1 | Ref. | Ref. | Ref. | Ref. | Ref. |
| 2 | 1.80 | 0.48 | 1.02 | 3.16 | 0.043 |
| 3 | 1.34 | 0.64 | 0.48 | 3.72 | 0.549 |
| 4 | 6.34 | 6.09 | 0.82 | 49.05 | 0.073 |
| Multivariable logistic regression analysis of renal risk and AAC adjusted for age and hypertension | |||||
| 1 | Ref. | Ref. | Ref. | Ref. | Ref. |
| 2 | 1.60 | 0.43 | 0.96 | 2.94 | 0.067 |
| 3 | 1.30 | 0.60 | 0.48 | 3.46 | 0.59 |
| 4 | 5.30 | 4.8 | 0.76 | 36 | 0.09 |
| Multivariable logistic regression analysis of renal risk and AAC adjusted for age, hypertension, and smoking history | |||||
| 1 | Ref. | Ref. | Ref. | Ref. | Ref. |
| 2 | 1.72 | 0.43 | 0.9 | 2.86 | 0.06 |
| 3 | 1.07 | 0.50 | 0.40 | 3.0 | 0.90 |
| 4 | 5.7 | 5.0 | 0.85 | 38 | 0.070 |
| Multivariable logistic regression analysis of renal risk and AAC adjusted for age, hypertension, smoking history and BMI | |||||
| 1 | Ref | Ref | Ref | Ref | Ref |
| 2 | 1.73 | 0.44 | 1.00 | 2.98 | 0.05 |
| 3 | 1.18 | 0.51 | 0.47 | 2.95 | 0.70 |
| 4 | 6.34 | 6.13 | 0.80 | 49.83 | 0.08 |
| Variables | Renal risk category | OR | 95% CI | P-value | P-value for interaction | |
|---|---|---|---|---|---|---|
| aThere were no participants with no history of hypertension in renal risk category for AAC class 4. CI: confidence interval; OR: odds ratio; Ref: reference. | ||||||
| Age < 65 | 1 | Ref. | Ref. | Ref. | Ref. | 0.453 |
| 2 | 2.27 | 0.73 | 7.05 | 0.144 | ||
| 3 | 4.02 | 0.68 | 23.74 | 0.116 | ||
| 4 | 14.54 | 2.99 | 70.68 | 0.003 | ||
| Age ≥ 65 | 1 | Ref. | Ref. | Ref. | Ref. | |
| 2 | 2.29 | 1.20 | 4.357 | 0.015 | ||
| 3 | 1.51 | 0.52 | 4.41 | 0.421 | ||
| 4 | 4.41 | 1.15 | 16.89 | 0.033 | ||
| Male gender | 1 | Ref. | Ref. | Ref. | Ref. | 0.714 |
| 2 | 4.85 | 2.66 | 8.83 | 0.0001 | ||
| 3 | 5.42 | 1.37 | 21.51 | 0.019 | ||
| 4 | 7.99 | 1.31 | 48.64 | 0.027 | ||
| Female gender | 1 | Ref. | Ref. | Ref. | Ref. | |
| 2 | 3.32 | 1.67 | 6.57 | 0.002 | ||
| 3 | 1.66 | 0.17 | 16.59 | 0.648 | ||
| 4 | 39.92 | 3.20 | 498.00 | 0.007 | ||
| History of diabetes mellitus | 1 | Ref. | Ref. | Ref. | Ref. | 0.288 |
| 2 | 1.89 | 0.88 | 4.09 | 0.098 | ||
| 3 | 2.94 | 0.73 | 11.85 | 0.121 | ||
| 4 | 5.49 | 1.16 | 25.87 | 0.033 | ||
| No history of diabetes mellitus | 1 | Ref. | Ref. | Ref. | Ref. | |
| 2 | 4.71 | 2.54 | 8.74 | 0.0001 | ||
| 3 | 1.89 | 0.30 | 8.96 | 0.398 | ||
| 4 | 9.82 | 0.76 | 127.79 | 0.077 | ||
| White race | 1 | Ref. | Ref. | Ref. | Ref. | 0.818 |
| 2 | 3.93 | 1.81 | 8.51 | 0.002 | ||
| 3 | 4.57 | 1.31 | 15.93 | 0.02 | ||
| 4 | 11.00 | 1.50 | 80.66 | 0.022 | ||
| Non-white race | 1 | Ref. | Ref. | Ref. | Ref. | |
| 2 | 2.27 | 0.73 | 7.05 | 0.144 | ||
| 3 | 4.02 | 0.68 | 23.74 | 0.116 | ||
| 4 | 14.53 | 2.99 | 70.68 | 0.003 | ||
| History of hypertension | 1 | Ref. | Ref. | Ref. | Ref. | 0.411 |
| 2 | 3.01 | 1.81 | 5.02 | 0.0001 | ||
| 3 | 2.32 | 0.79 | 6.83 | 0.117 | ||
| 4 | 6.82 | 1.90 | 24.47 | 0.006 | ||
| No history of hypertension | 1 | Ref. | Ref. | Ref. | Ref. | |
| 2 | 3.59 | 1.35 | 9.54 | 0.014 | ||
| 3 | 7.58 | 0.66 | 87.09 | 0.097 | ||
| 4a | n/a | n/a | n/a | n/a | ||