Figures
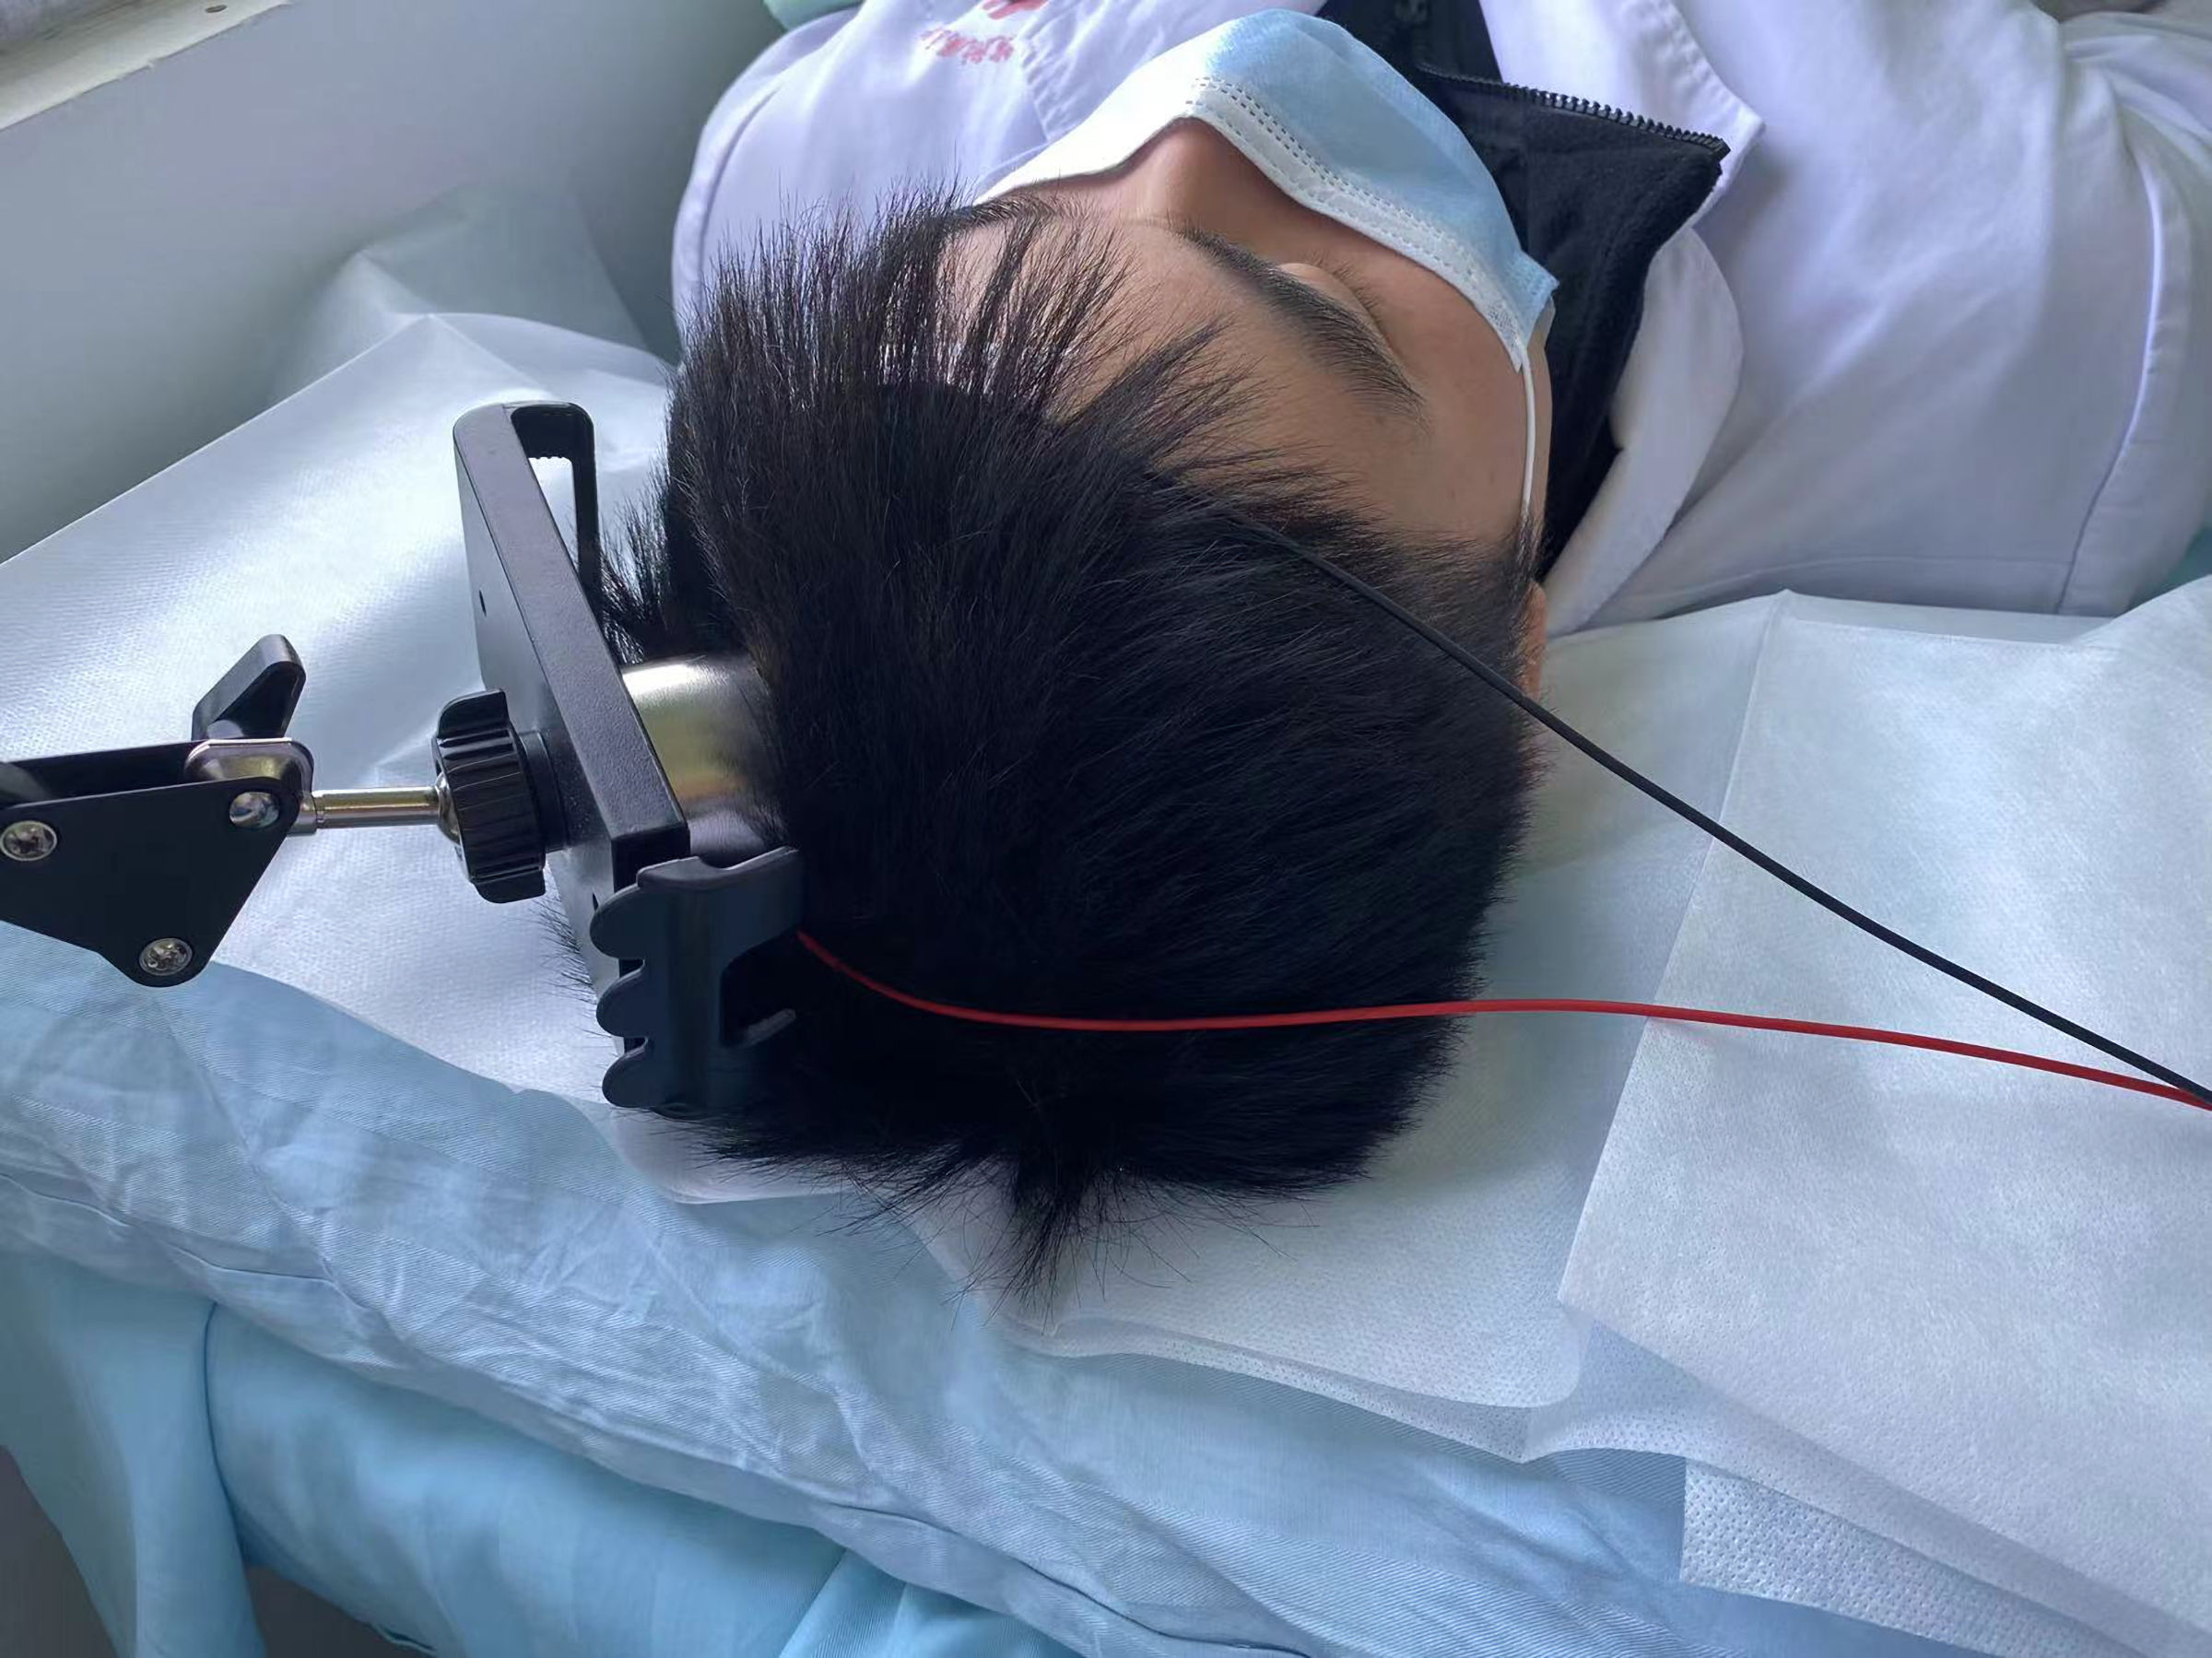
↓ Figure 1. Diagram of the tSMS intervention
measures model. Using a floor-to-ceiling mobile stent to attach a neodymium magnet (south pole) and a
non-magnetic stainless steel cylinder to the subject’s C3 scalp. tSMS: transcranial static
magnetic stimulation.
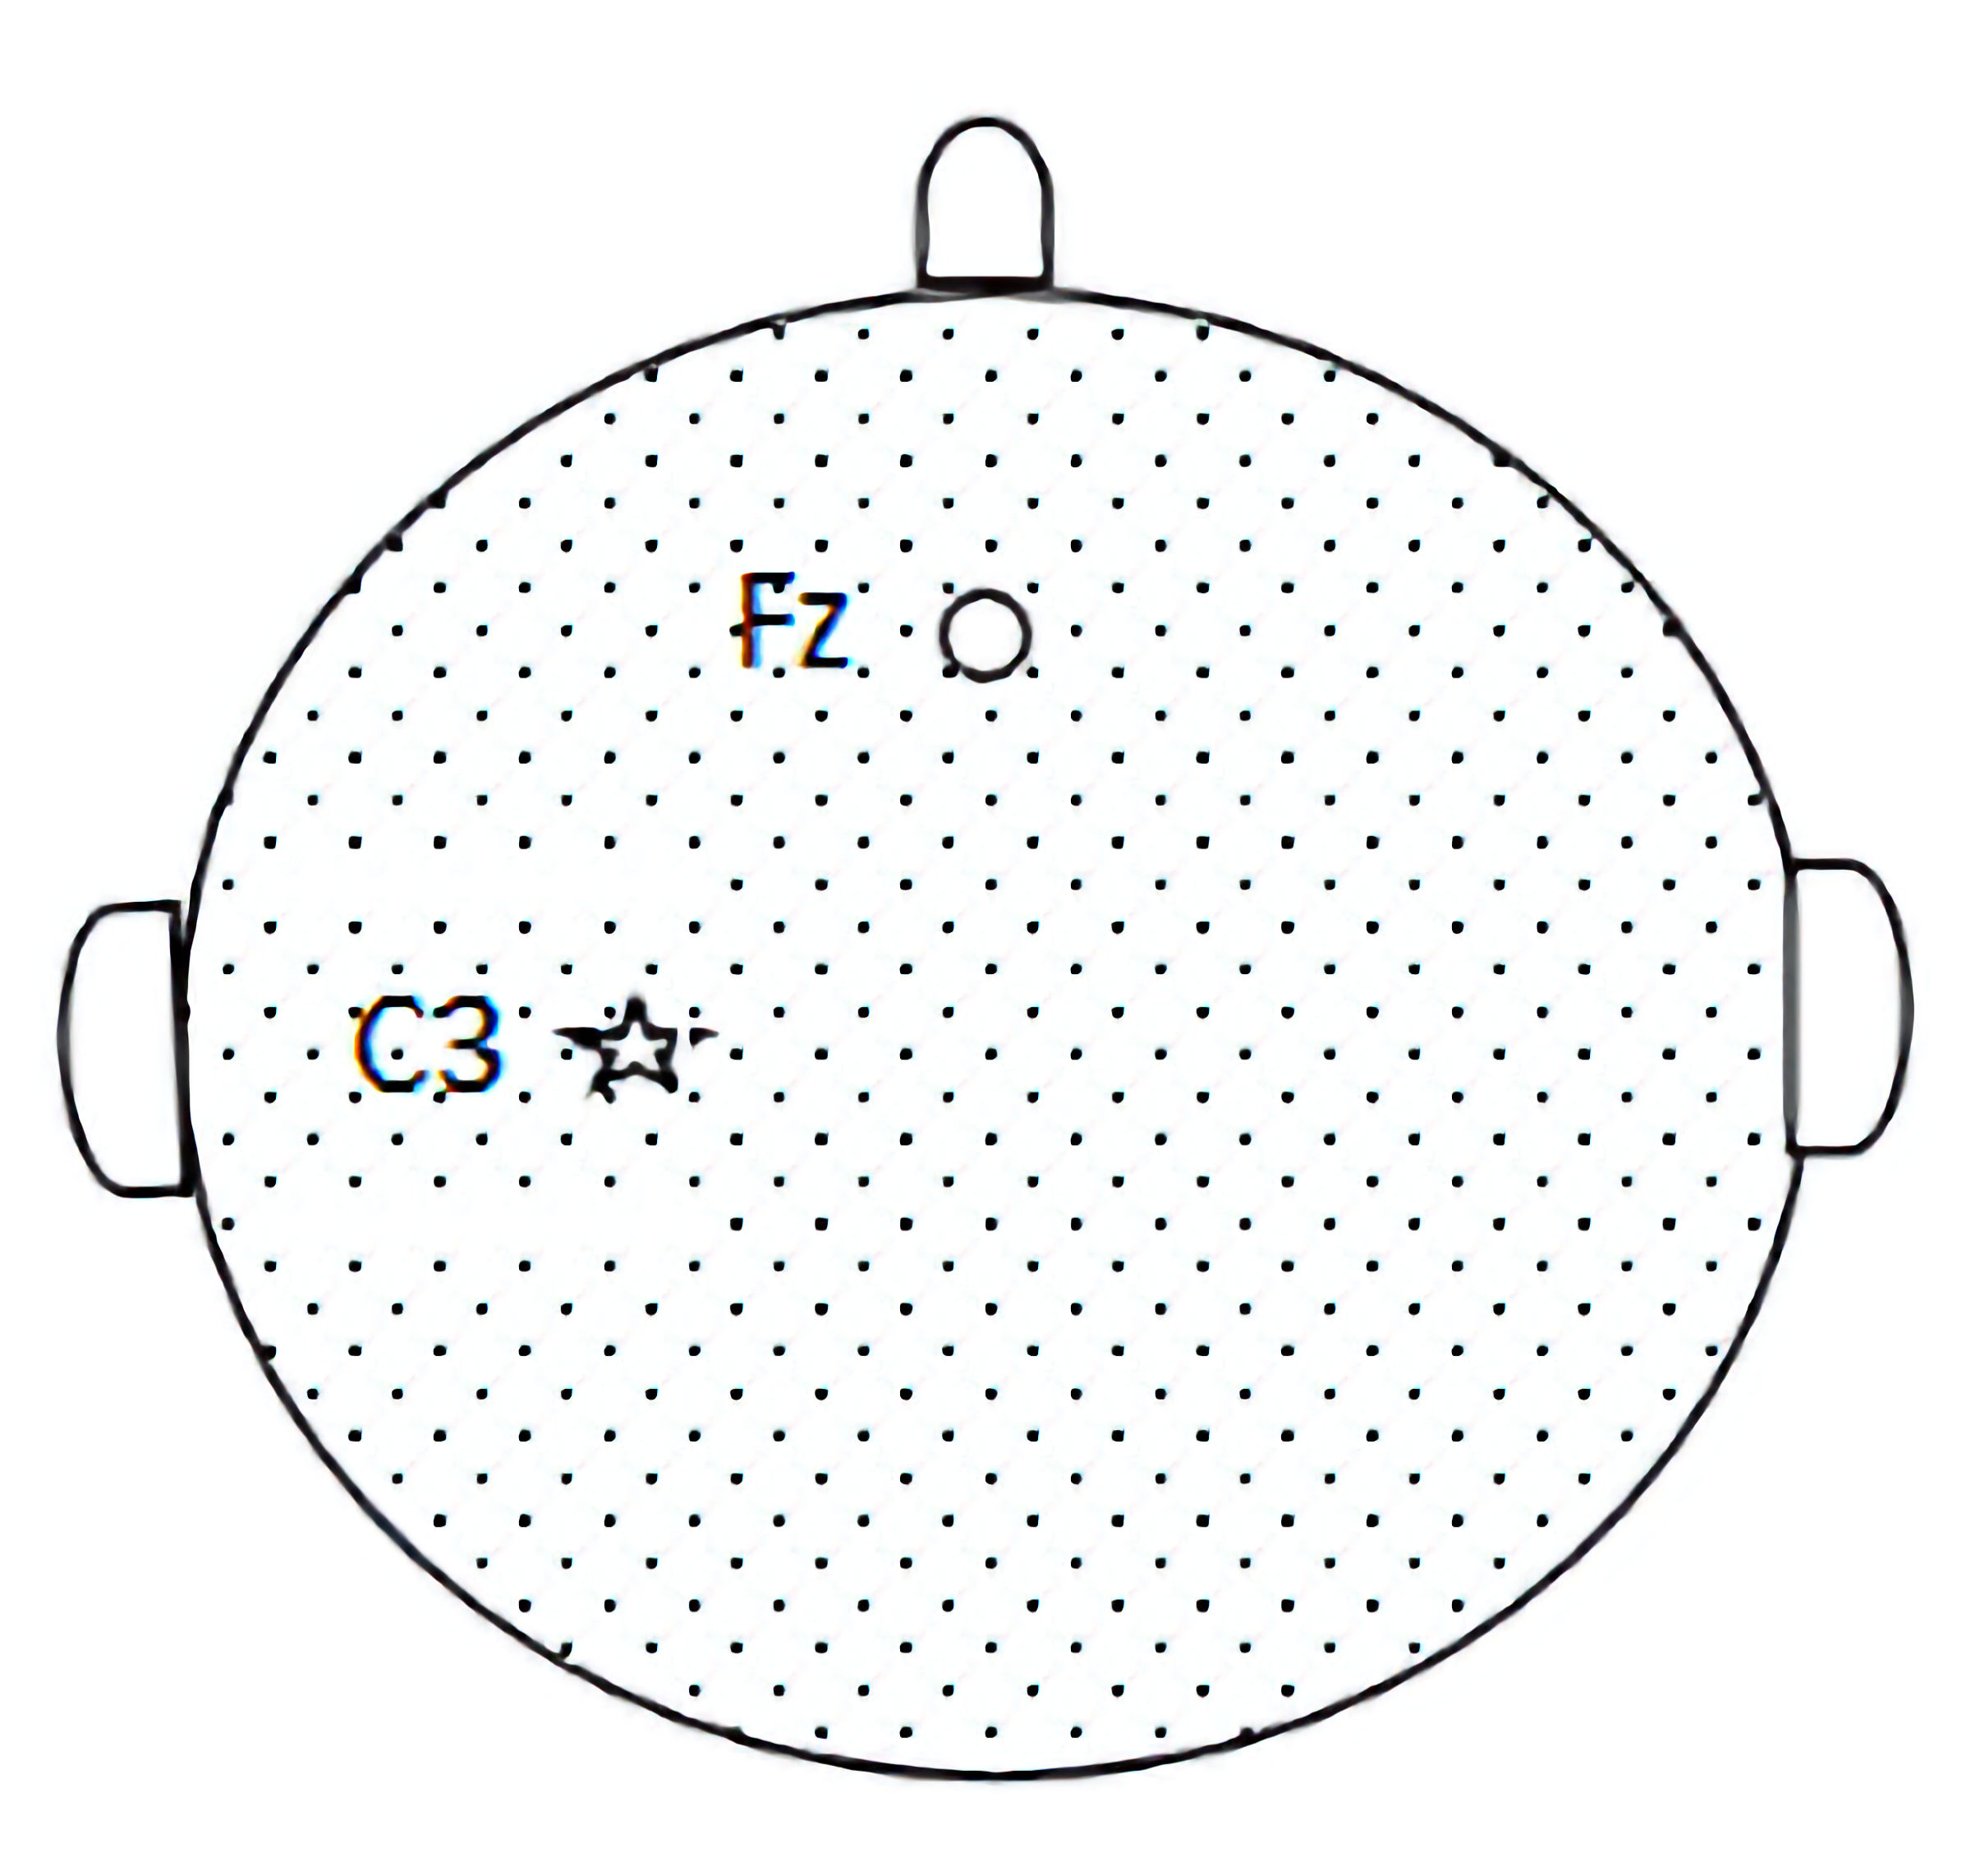
↓ Figure 2. Pattern map of C3 and Fz sites. Based
on the international 10-20 system electrode placement method to determine the C3 and Fz sites, SEP is
recorded from the C3 (parietal cortex) and Fz (forehead) sites. SEP: somatosensory evoked potential.
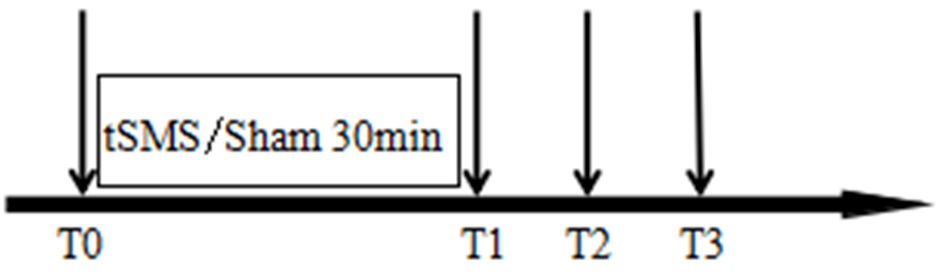
↓ Figure 3. Intervention timeline. T0 represents
before stimulation, T1 represents 0 - 2 min after stimulation, T2 represents 5 - 7 min after
stimulation, and T3 represents 10 - 12 min after stimulation. A 30-min tSMS or sham stimulation is
applied between T0 and T1. tSMS: transcranial static magnetic stimulation.
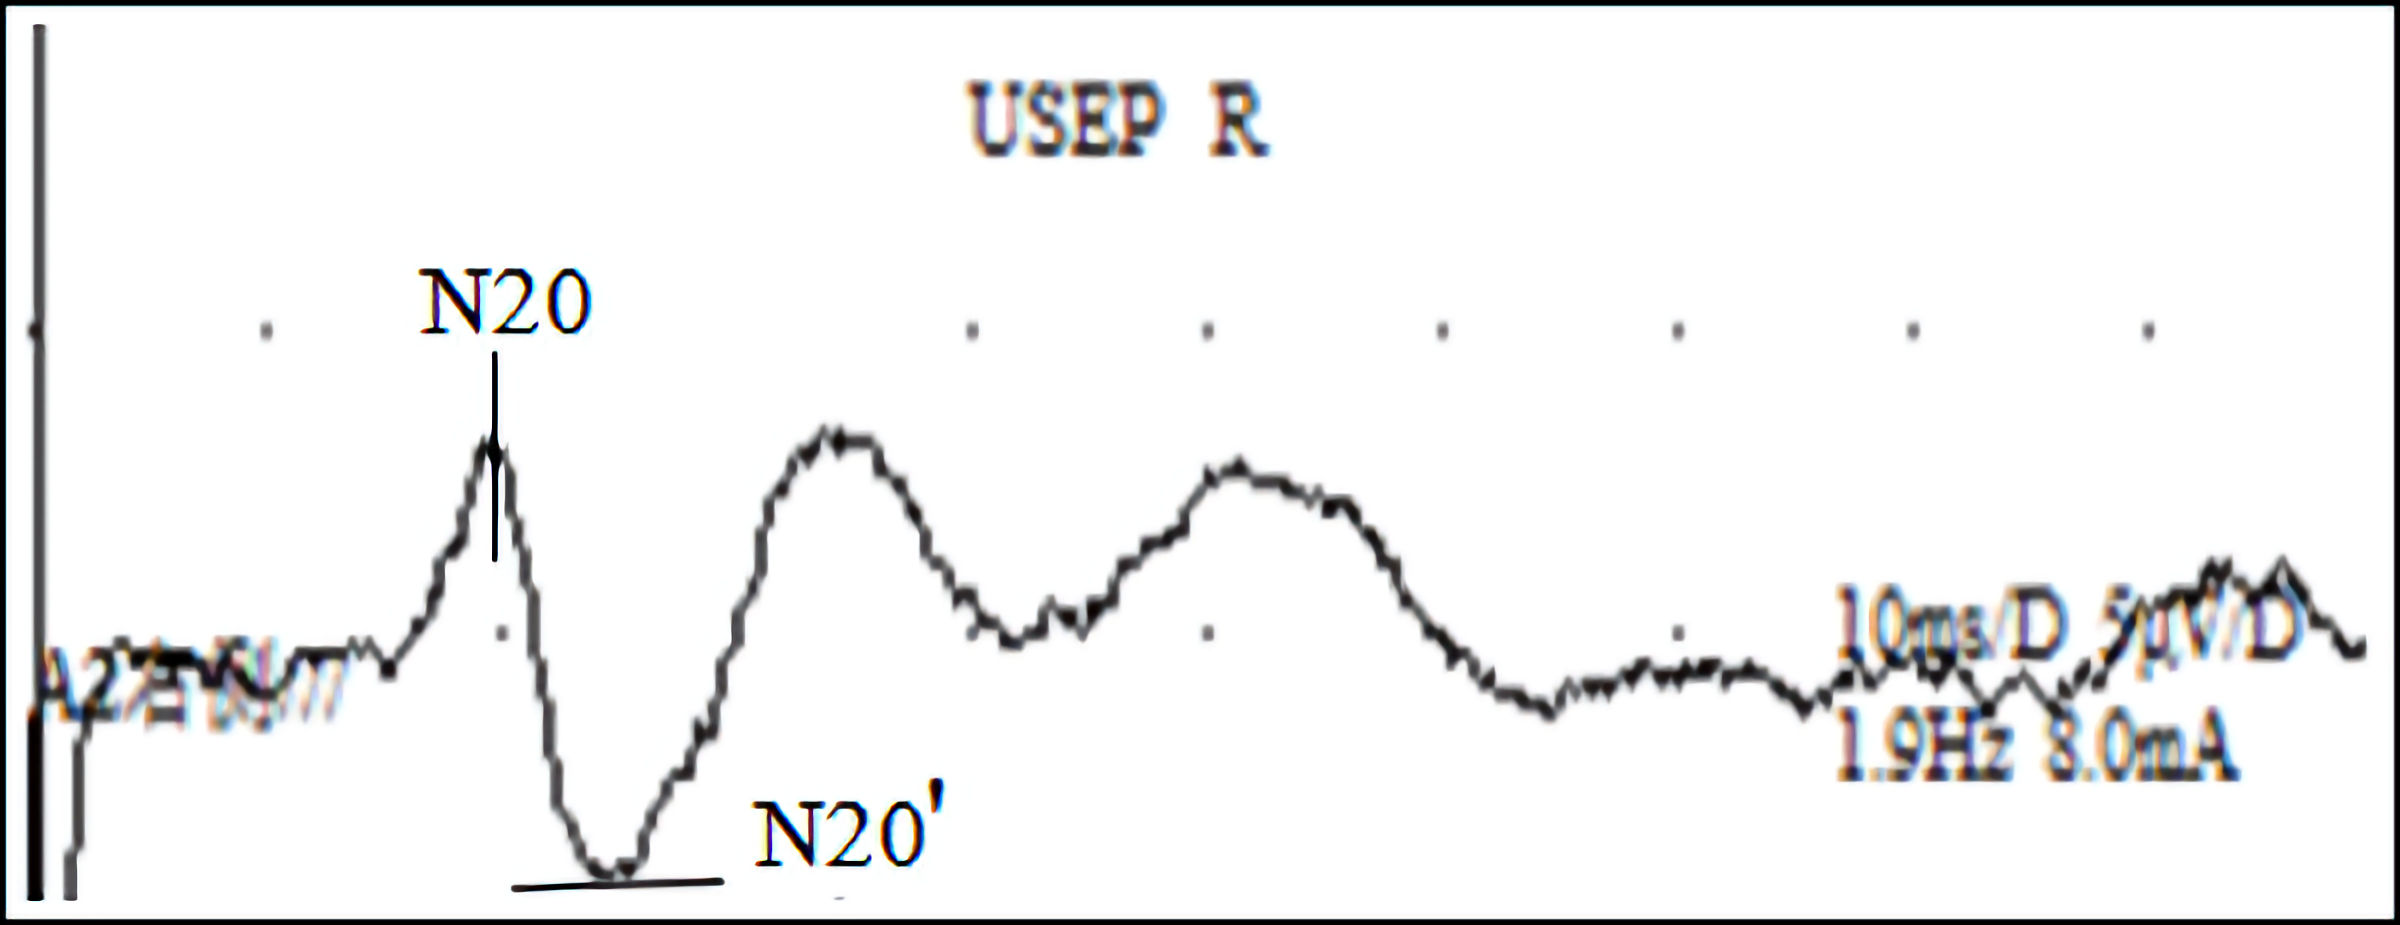
↓ Figure 4. SEP wave map: a SEP waveform recorded
using electromyography and evoked potential stimulation of the right median nerve. SEP: somatosensory
evoked potential.
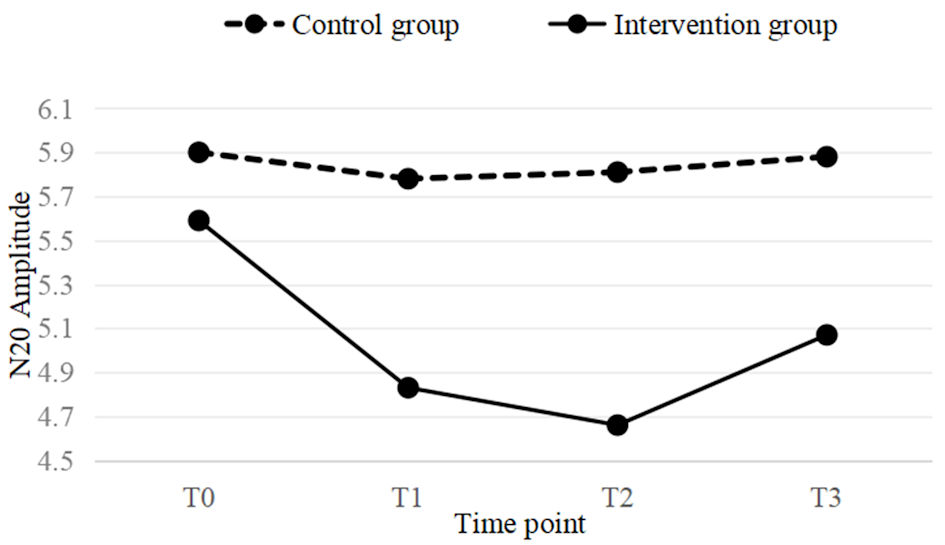
↓ Figure 5. A line graph of the mean values for
both the intervention and control groups at four time points (T0, T1, T2, T3). In the intervention
group, a significant downward trend is observed at T1 time point, which still remains significant at T2.
At T3, the downward trend begins to weaken.
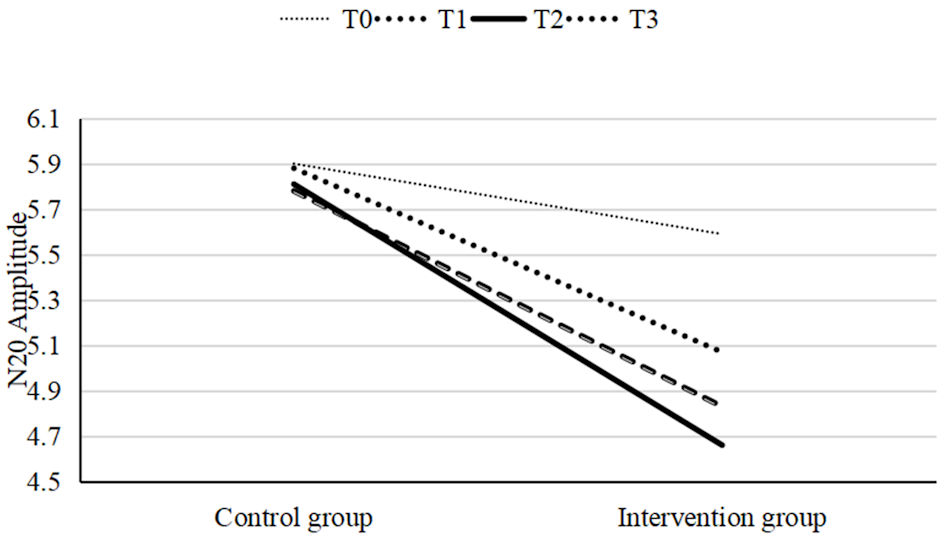
↓ Figure 6. A linear graph of the mean values at
four time points for both the intervention and control groups. The mean values at T1, T2, and T3 in the
intervention group were significantly different from T0, with the largest difference observed at T2. In
contrast, no significant differences were observed in the control group.
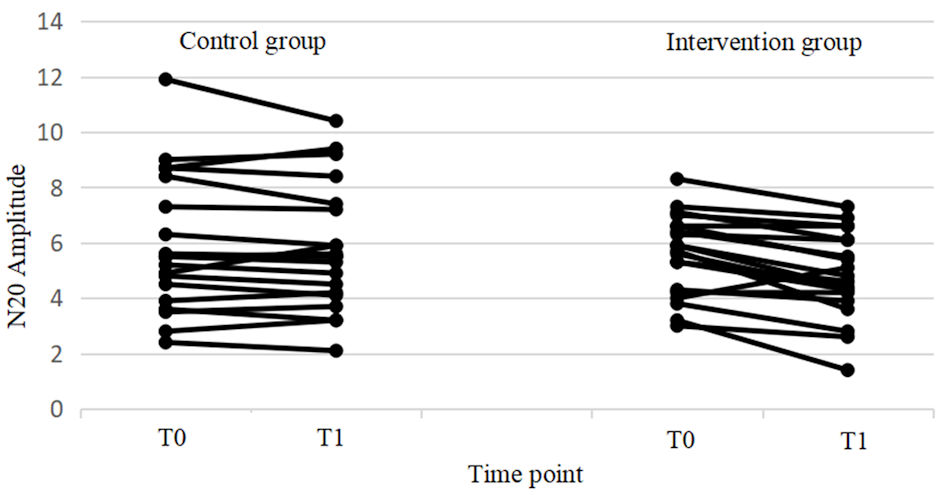
↓ Figure 7. Changes in excitability from T0 to T1
for individual subjects in both the control and intervention groups. In the intervention group,
significant differences were found between T0 and T1, while no significant differences were observed in
the control group. Additionally, the control group showed large individual differences.
Tables
↓ Table 1. General Information of Two Groups of Subjects Before
Intervention
| Group |
Number of cases |
Age |
Gender |
| Male
|
Female |
| tSMS: transcranial static magnetic stimulation. |
| tSMS group |
20 |
27.25 ± 7.86 |
10 |
10 |
| Sham stimulation group |
20 |
28.40 ± 6.60 |
6 |
14 |
| t/χ2 |
|
0.501 |
1.667 |
| P |
|
0.619 |
0.197 |
↓ Table 2. Description Statistics of Two Groups of Subjects
| Time
point |
tSMS
group (n = 20) |
Sham
stimulation group (n = 20) |
| Sphericity test P > 0.05, indicating that it meets the sphericity test. tSMS:
transcranial static magnetic stimulation. |
| T0 |
5.59 ± 1.45 |
5.9 ± 2.4 |
| T1 |
4.82 ± 1.54 |
5.78 ± 2.26 |
| T2 |
4.66 ± 1.72 |
5.81 ± 2.28 |
| T3 |
5.07 ± 1.70 |
5.87 ± 2.20 |
| Sphericity test |
P = 0.52 |
↓ Table 3. Comparison of the Two Groups of Subjects Before and After
Intervention
|
|
tSMS
group (n = 20) |
Sham
stimulation group (n = 20) |
t |
P
|
| aStatistical significance was found between T0 and T1, T0 and T2, and T0 and
T3 in the tSMS group (P < 0.05), while no significant differences were observed for the other
comparisons (P > 0.05). tSMS: transcranial static magnetic stimulation. |
| T0 |
5.59 ± 1.45 |
5.9 ± 2.4 |
0.491 |
0.626 |
| T1 |
4.82 ± 1.54 |
5.78 ± 2.26 |
1.561 |
0.127 |
| T2 |
4.66 ± 1.72 |
5.81 ± 2.28 |
1.801 |
0.080 |
| T3 |
5.07 ± 1.70 |
5.87 ± 2.20 |
1.295 |
0.203 |
| F |
8.861 |
0.382 |
|
|
| P |
0.008 |
0.544 |
|
|
| Intergroup effect |
F = 1.743 |
P = 0.195 |
|
|
| Intragroup effect |
F = 7.735 |
P < 0.001 |
|
|
| Time point groupa |
F = 4.822 |
P = 0.003 |
|
|
↓ Table 4. Comparison of Time Before and After Intervention in tSMS
Group
| Time
point |
tSMS
group time point difference (n = 20) |
P
|
95%
CI |
| Statistical significance was observed between T0 and T1, T0 and T2, and T0 and T3 in the
tSMS group (P < 0.05), while no statistical significance was found for the other comparisons (P
> 0.05). tSMS: transcranial static magnetic stimulation; CI: confidence interval. |
| T0 and T1 |
0.77 ± 0.14 |
< 0.001 |
0.37, 1.16 |
| T0 and T2 |
0.93 ± 0.16 |
< 0.001 |
0.48, 1.38 |
| T0 and T3 |
0.52 ± 0.18 |
0.034 |
0.03, 1.01 |
| T1 and T2 |
0.17 ± 0.17 |
0.910 |
-0.30, 0.63 |
| T1 and T3 |
0.25 ± 0.18 |
0.675 |
-0.73, 0.24 |
| T2 and T3 |
0.41 ± 0.15 |
0.061 |
-0.83, 0.01 |
↓ Table 5. Comparison of Time Before and After Intervention in Control
Group
| Time
point |
Sham
stimulation group time point difference (n = 20) |
P
|
95%
CI |
| There was no significant statistical difference between the four time points in the
control group (P > 0.05). CI: confidence interval. |
| T0 and T1 |
0.12 ± 0.14 |
0.956 |
-0.28, 0.52 |
| T0 and T2 |
0.09 ± 0.16 |
0.995 |
-0.36, 0.54 |
| T0 and T3 |
0.03 ± 0.18 |
> 0.999 |
-0.47, 0.52 |
| T1 and T2 |
0.03 ± 0.17 |
> 0.999 |
-0.50, 0.44 |
| T1 and T3 |
0.10 ± 0.18 |
0.995 |
-0.58, 0.39 |
| T2 and T3 |
0.07 ± 0.15 |
0.999 |
-0.49, 0.36 |