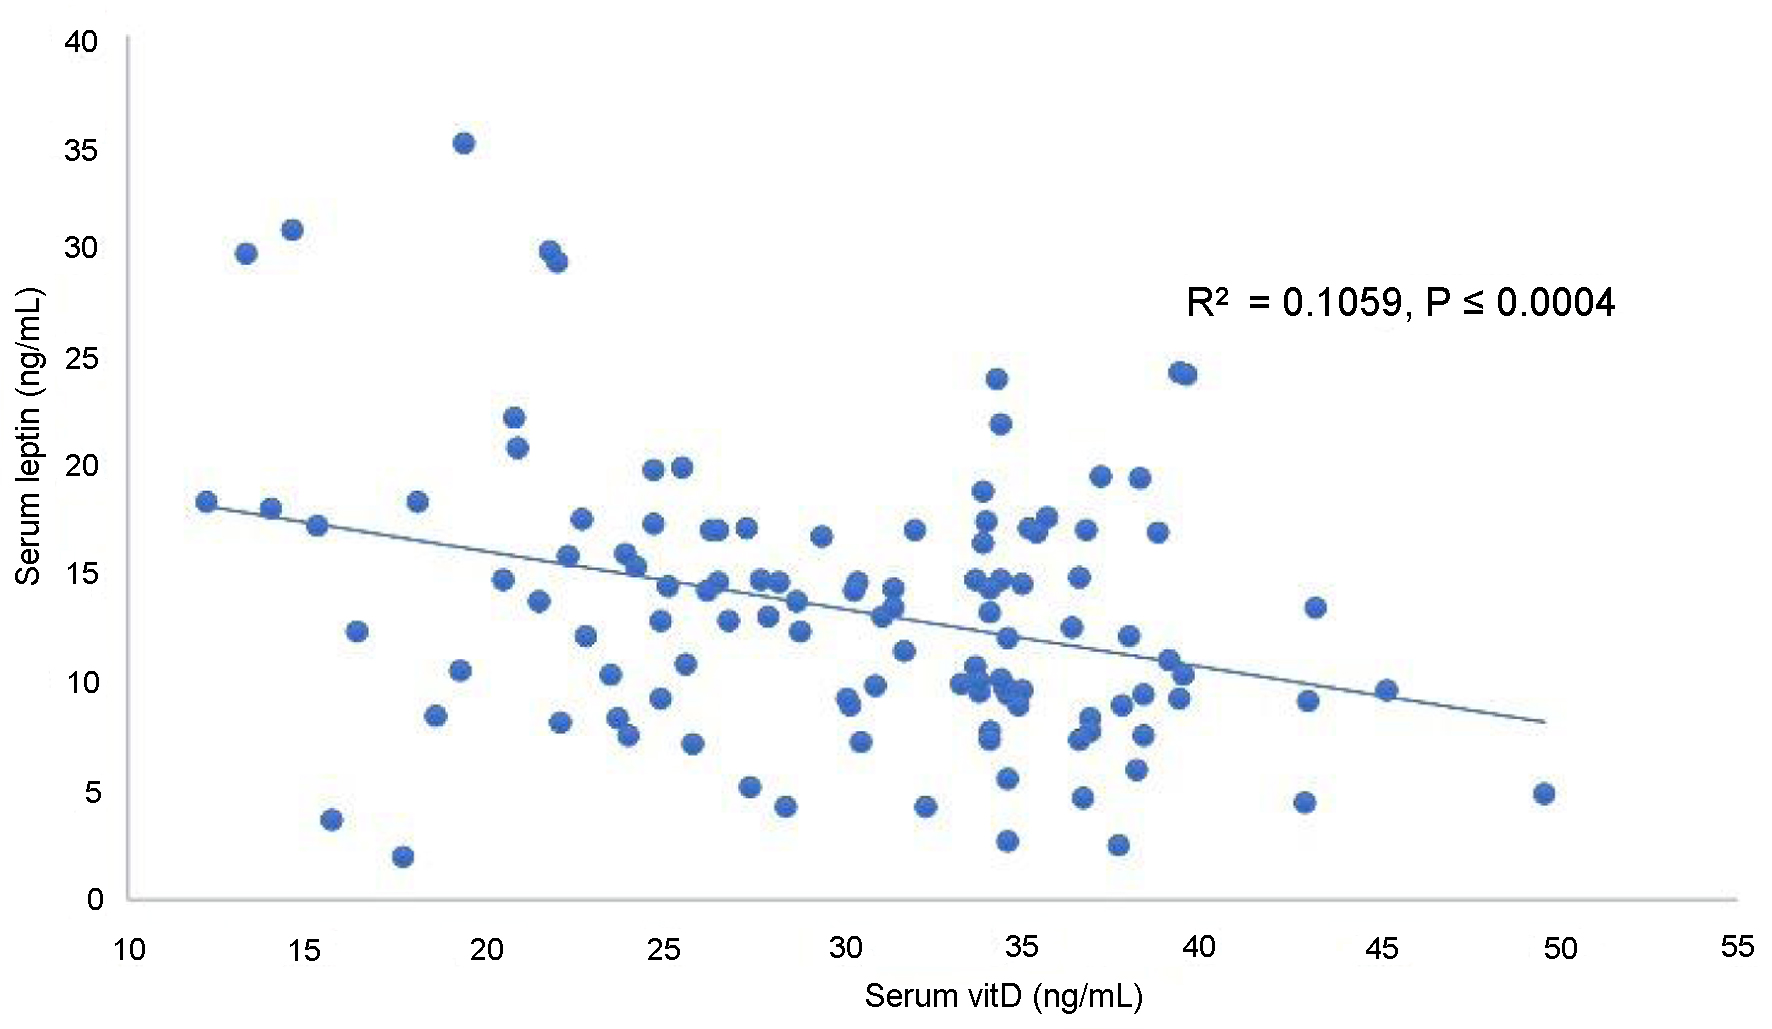
↓ Figure 1. Correlation of serum vitamin D with
leptin in overweight hypertensive postmenopausal women.
| Journal of Clinical Medicine Research, ISSN 1918-3003 print, 1918-3011 online, Open Access |
| Article copyright, the authors; Journal compilation copyright, J Clin Med Res and Elmer Press Inc |
| Journal website https://jocmr.elmerjournals.com |
Original Article
Volume 17, Number 1, January 2025, pages 51-59
Serum Vitamin D Level Correlates Significantly With Leptin and Tumor Necrosis Factor-Alpha in Overweight Postmenopausal Women With Hypertension
Figures
Tables
| Variables | NW-NT | NW-HT | OW-HT | P-value* |
|---|---|---|---|---|
| Values are presented as mean ± SD. *P-values for one-way ANOVA, statistical analysis done by using the Statistical Package for Social Sciences (SPSS), version 24.0 for Windows. ANOVA: analysis of variance; BMI: body mass index; Hcy: homocysteine; IL-6: interleukin-6; Lep: leptin; NW-HT: normal weight hypertensive; NW-NT: normal weight normotensive; OW-HT: overweight hypertensive; SD: standard deviation; TC: total cholesterol; TG: triglycerides; TNF-α: tumor necrosis factor-alpha; 25(OH)D: vitamin D. | ||||
| Number of subjects (n) | 116 | 115 | 115 | - |
| Age (years) | 55.32 ± 2.84 | 55.33 ± 2.79 | 55.35 ± 2.75 | 0.99 |
| BMI (kg/m2) | 23.46 ± 0.87 | 23.42 ± 0.88 | 27.49 ± 1.48 | < 0.001 |
| Lep (ng/mL) | 5.99 ± 2.49 | 10.23 ± 5.36 | 13.40 ± 6.21 | < 0.001 |
| 25(OH)D (ng/mL) | 32.04 ± 7.14 | 32.05 ± 6.99 | 30.21 ± 7.57 | 0.09 |
| TC (mg/dL) | 179.83 ± 13.50 | 182.69 ± 14.49 | 183.19 ± 18.94 | 0.22 |
| TG (mg/dL) | 96.14 ± 14.04 | 96.41 ± 14.47 | 98.66 ± 17.27 | 0.39 |
| Hcy (µmol/L) | 6.914 ± 4.83 | 6.99 ± 4.88 | 7.20 ± 5.14 | 0.91 |
| IL-6 (pg/mL) | 7.68 ± 7.48 | 9.26 ± 6.42 | 13.69 ± 8.15 | < 0.001 |
| TNF-α (pg/mL) | 6.01 ± 5.65 | 9.23 ± 5.73 | 12.61 ± 6.54 | < 0.001 |
| Variables | NW-NT | NW-HT | OW-HT | |||
|---|---|---|---|---|---|---|
| R2 | P | R2 | P | R2 | P | |
| BMI: body mass index; Hcy: homocysteine; IL-6: interleukin-6; Lep: leptin; NW-HT: normal weight hypertensive; NW-NT: normal weight normotensive; OW-HT: overweight hypertensive; R2: coefficient of correlation, statistical analysis done by using the Statistical Package for Social Sciences (SPSS), version 24.0 for Windows; TC: total cholesterol; TG: triglycerides; TNF-α: tumor necrosis factor-alpha; 25(OH)D: vitamin D. | ||||||
| Lep | 0.004 | 0.49 | 0.021 | 0.12 | 0.037 | 0.04 |
| 25(OH)D | 0.003 | 0.56 | 0.005 | 0.46 | 0.350 | < 0.001 |
| TC | 0.036 | 0.04 | 0.019 | 0.15 | 0.020 | 0.13 |
| TG | 0.004 | 0.50 | 0.004 | 0.50 | 0.000 | 0.89 |
| Hcy | 0.001 | 0.74 | 0.001 | 0.79 | 0.000 | 0.96 |
| IL-6 | 0.037 | 0.04 | 0.004 | 0.48 | 0.003 | 0.56 |
| TNF-α | 0.028 | 0.07 | 0.24 | < 0.001 | 0.288 | < 0.001 |
| Variables | NW-NT | NW-HT | OW-HT | |||
|---|---|---|---|---|---|---|
| R2 | P | R2 | P | R2 | P | |
| BMI: body mass index; Hcy: homocysteine; IL-6: interleukin-6; Lep: leptin; NW-HT: normal weight hypertensive; NW-NT: normal weight normotensive; OW-HT: overweight hypertensive; R2: coefficient of correlation, statistical analysis done by using the Statistical Package for Social Sciences (SPSS), version 24.0 for Windows; TC: total cholesterol; TG: triglycerides; TNF-α: tumor necrosis factor-alpha; 25(OH)D: vitamin D. | ||||||
| 25(OH)D | 0.006 | 0.42 | 0.002 | 0.60 | 0.106 | < 0.0004 |
| TC | 0.001 | 0.72 | 0.001 | 0.73 | 0.007 | 0.39 |
| TG | 0.020 | 0.13 | 0.010 | 0.30 | 0.000 | 0.96 |
| Hcy | 0.006 | 0.41 | 0.010 | 0.30 | 0.028 | 0.08 |
| IL-6 | 0.067 | 0.005 | 0.016 | 0.18 | 0.024 | 0.10 |
| TNF-α | 0.070 | 0.004 | 0.147 | < 0.001 | 0.149 | < 0.001 |
| Variables | NW-NT | NW-HT | OW-HT | |||
|---|---|---|---|---|---|---|
| R2 | P | R2 | P | R2 | P | |
| BMI: body mass index; Hcy: homocysteine; IL-6: interleukin-6; Lep: leptin; NW-HT: normal weight hypertensive; NW-NT: normal weight normotensive; OW-HT: overweight hypertensive; R2: coefficient of correlation, statistical analysis done by using the Statistical Package for Social Sciences (SPSS), version 24.0 for Windows; negative linear slope was obtained for all variables in all groups; TC: total cholesterol; TG: triglycerides; TNF-α: tumor necrosis factor-alpha; vitD: vitamin D. | ||||||
| Lep | 0.006 | 0.42 | 0.002 | 0.60 | 0.106 | < 0.0004 |
| TC | 0.000 | 0.856 | 0.001 | 0.705 | 0.007 | 0.391 |
| TG | 0.001 | 0.771 | 0.005 | 0.460 | 0.008 | 0.347 |
| Hcy | 0.001 | 0.729 | 0.003 | 0.546 | 0.002 | 0.673 |
| IL-6 | 0.009 | 0.303 | 0.001 | 0.685 | 0.004 | 0.491 |
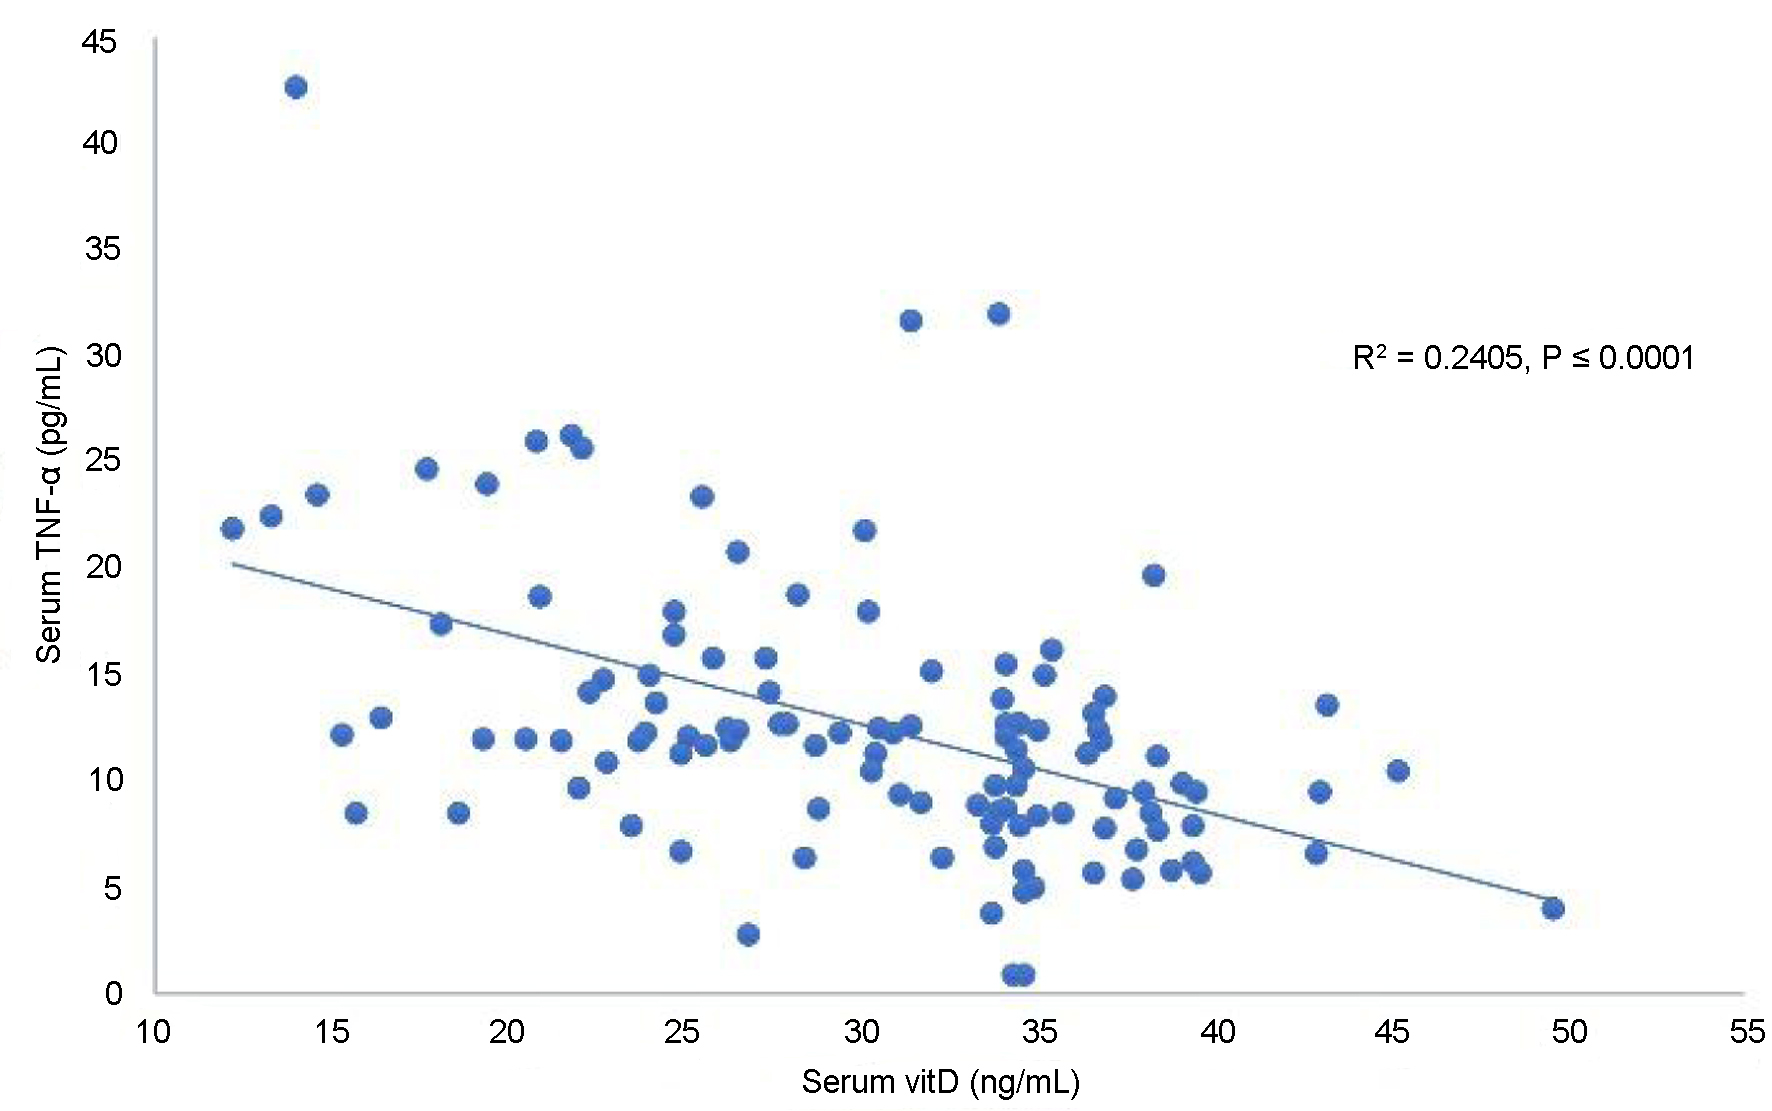
| TNF-α | 0.009 | 0.303 | 0.007 | 0.359 | 0.241 | < 0.0001 |