| Age (years) |
60.22 ± 10.54 |
| Female |
29 (78.4) |
| BMI (kg/m2) |
28.98 ± 6.87 |
| Race |
|
| African-American |
20 (54.1) |
| Caucasian |
15 (40.5) |
| Asian |
1 (2.7) |
| Hispanic |
1 (2.7) |
| Subtype of ILD |
|
| Connective tissue disease associated-ILD |
27 (73.0) |
| Idiopathic pulmonary fibrosis |
4 (10.8) |
| Hypersensitivity pneumonitis |
2 (5.4) |
| Unclassifiable |
2 (5.4) |
| Idiopathic NSIP |
1 (2.7) |
| Smoking-related ILD |
1 (2.7) |
| Imaging pattern |
|
| Definite/probable UIP |
17 (45.9) |
| NSIP |
14 (37.8) |
| Othera |
6 (16.2) |
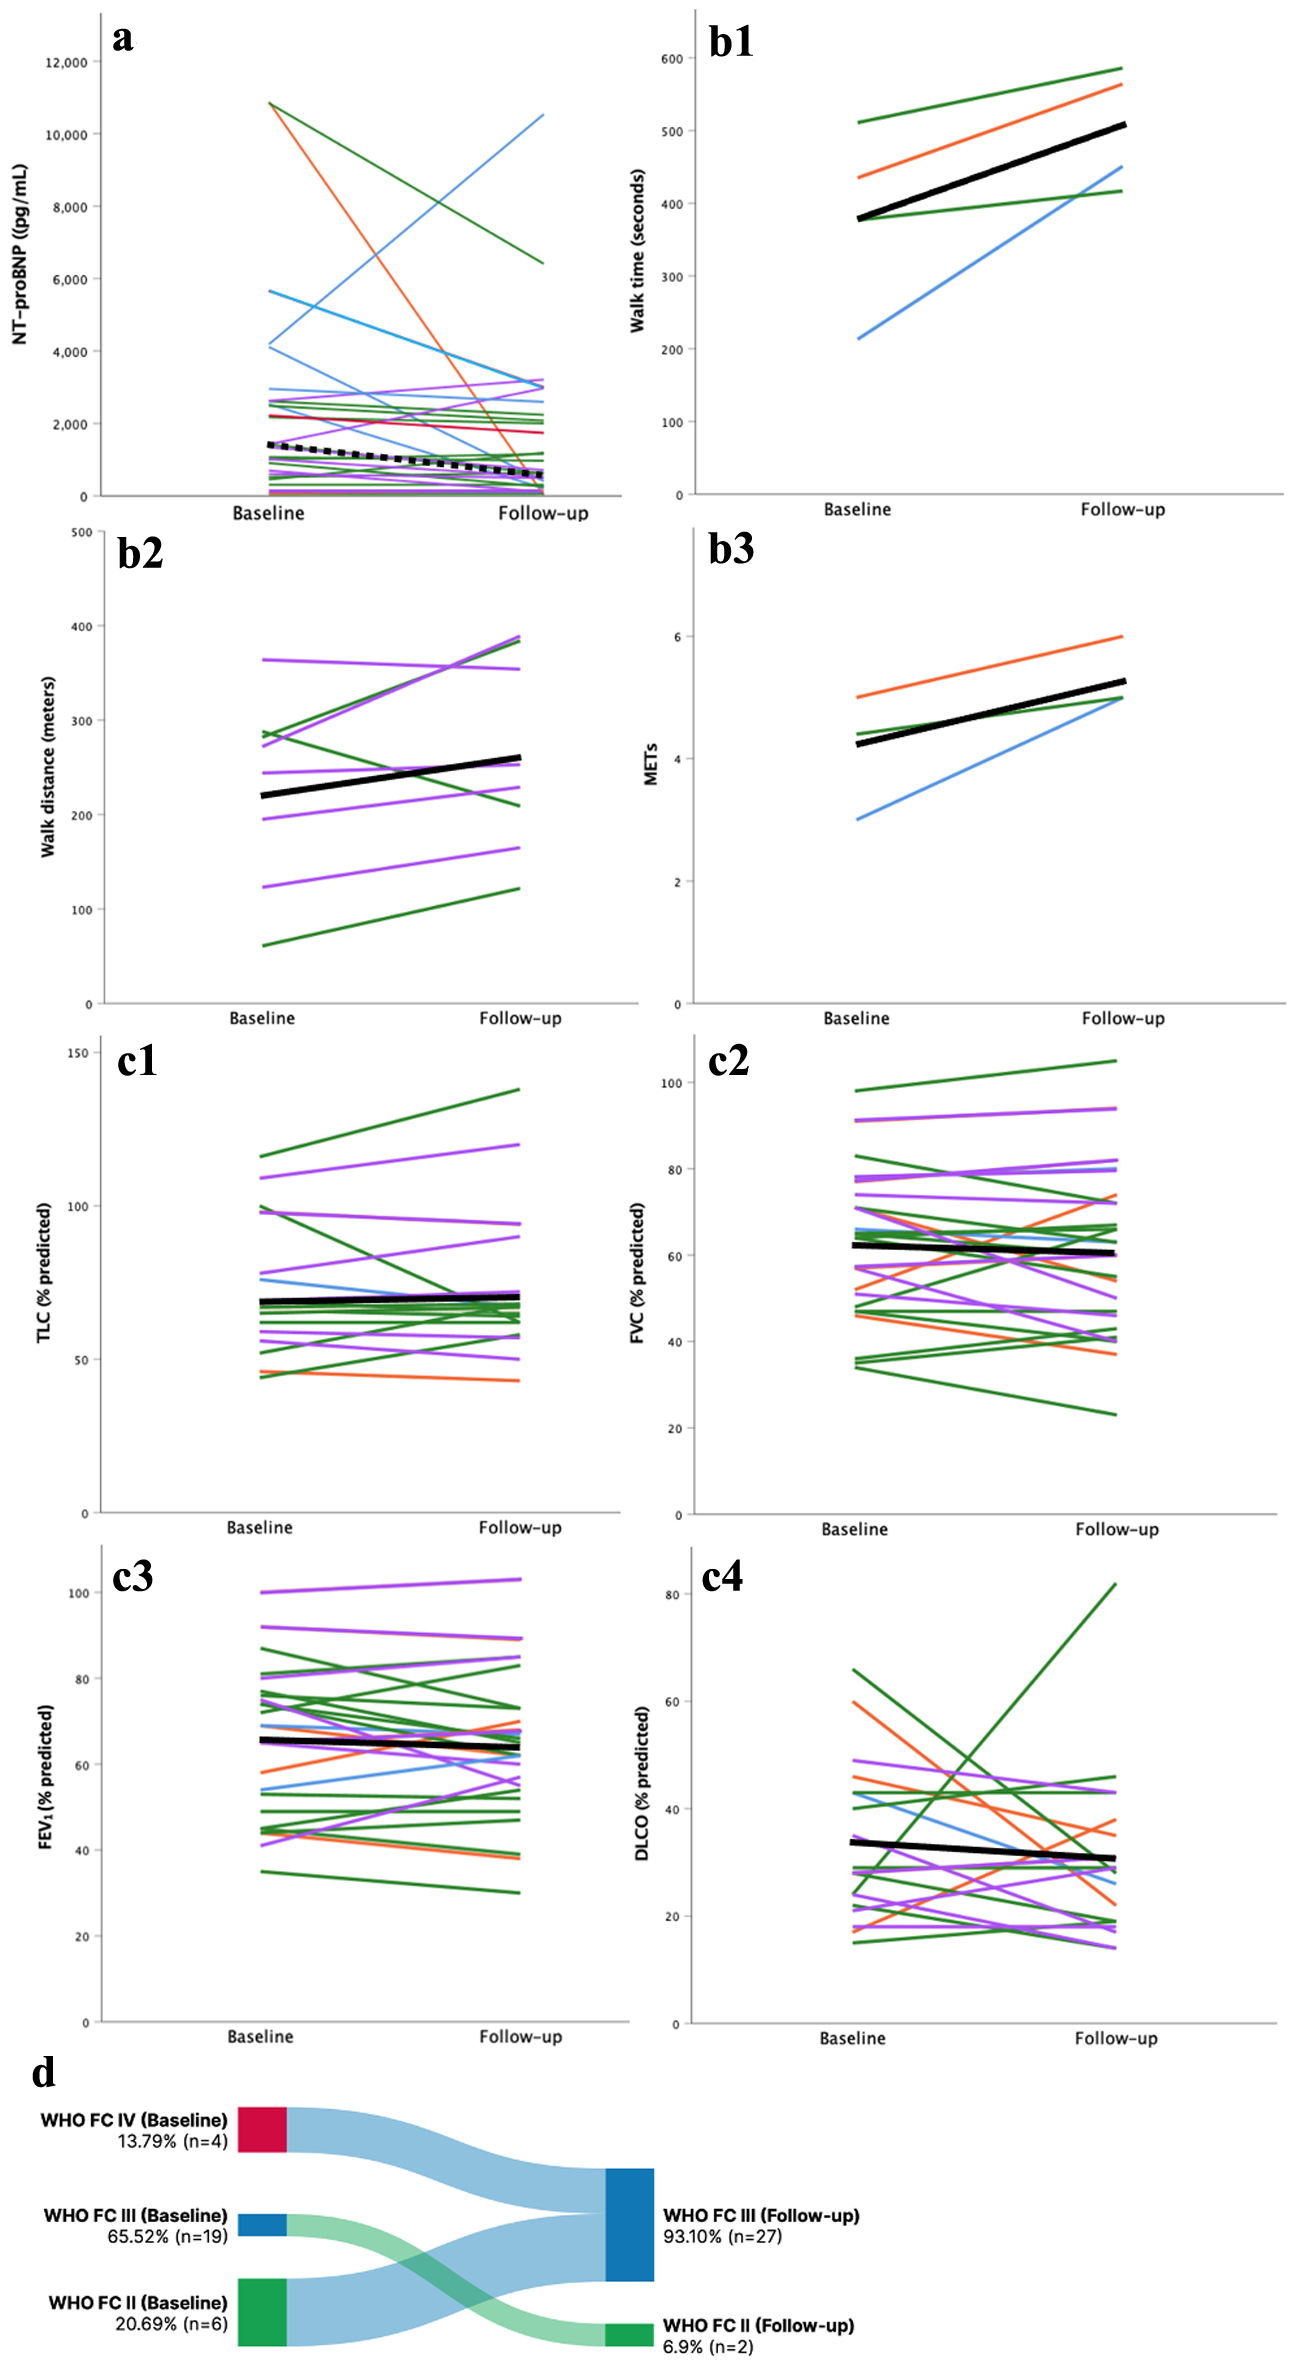
| Pulmonary function test |
|
| TLC (% predicted) |
68.9 ± 20.2 |
| FVC (% predicted) |
59.9 ± 15.7 |
| FEV1 (% predicted) |
63 ± 16.2 |
| DLCO (% predicted) |
34.5 ± 15.3 |
| Comorbidities |
|
| Connective tissue disease |
27 (73.0) |
| Systemic sclerosis |
11 (29.7) |
| Mixed connective tissue disease |
4 (10.8) |
| Rheumatoid arthritis |
4 (10.8) |
| Polymyositis/dermatomyositis |
3 (8.1) |
| SLE/SLE overlap syndrome |
2 (5.4) |
| Undifferentiated connective tissue disease |
2 (5.4) |
| Sjogren’s syndrome |
1 (2.7) |
| Hypertension |
19 (51.4) |
| Obesity (BMI ≥ 30 kg/m2) |
15 (40.5) |
| Heart failure with preserved ejection fraction |
12 (32.4) |
| Chronic obstructive pulmonary diseaseb |
7 (18.9) |
| Obstructive sleep apnea |
7 (18.9) |
| Atrial fibrillation |
7 (18.9) |
| Diabetes mellites |
7 (18.9) |
| Venous thromboembolism |
6 (16.2) |
| Chronic kidney disease |
5(13.5) |
| Heart failure with reduced ejection fraction |
2 (5.4) |
| Medications |
|
| Diuretics |
25 (67.6) |
| Aspirin |
12 (32.4) |
| Beta-blockers |
11 (29.7) |
| ACEIs/ARBs |
8 (21.6) |
| Calcium channel blockers |
|
| Dihydropyridines |
10 (27.0) |
| Non-dihydropyridines |
4 (10.8) |
| Warfarin/DOACs |
7 (18.9) |
| Labs (n = 30) |
|
| NT-proBNP (pg/mL) |
1,498 (675 - 3,208) |
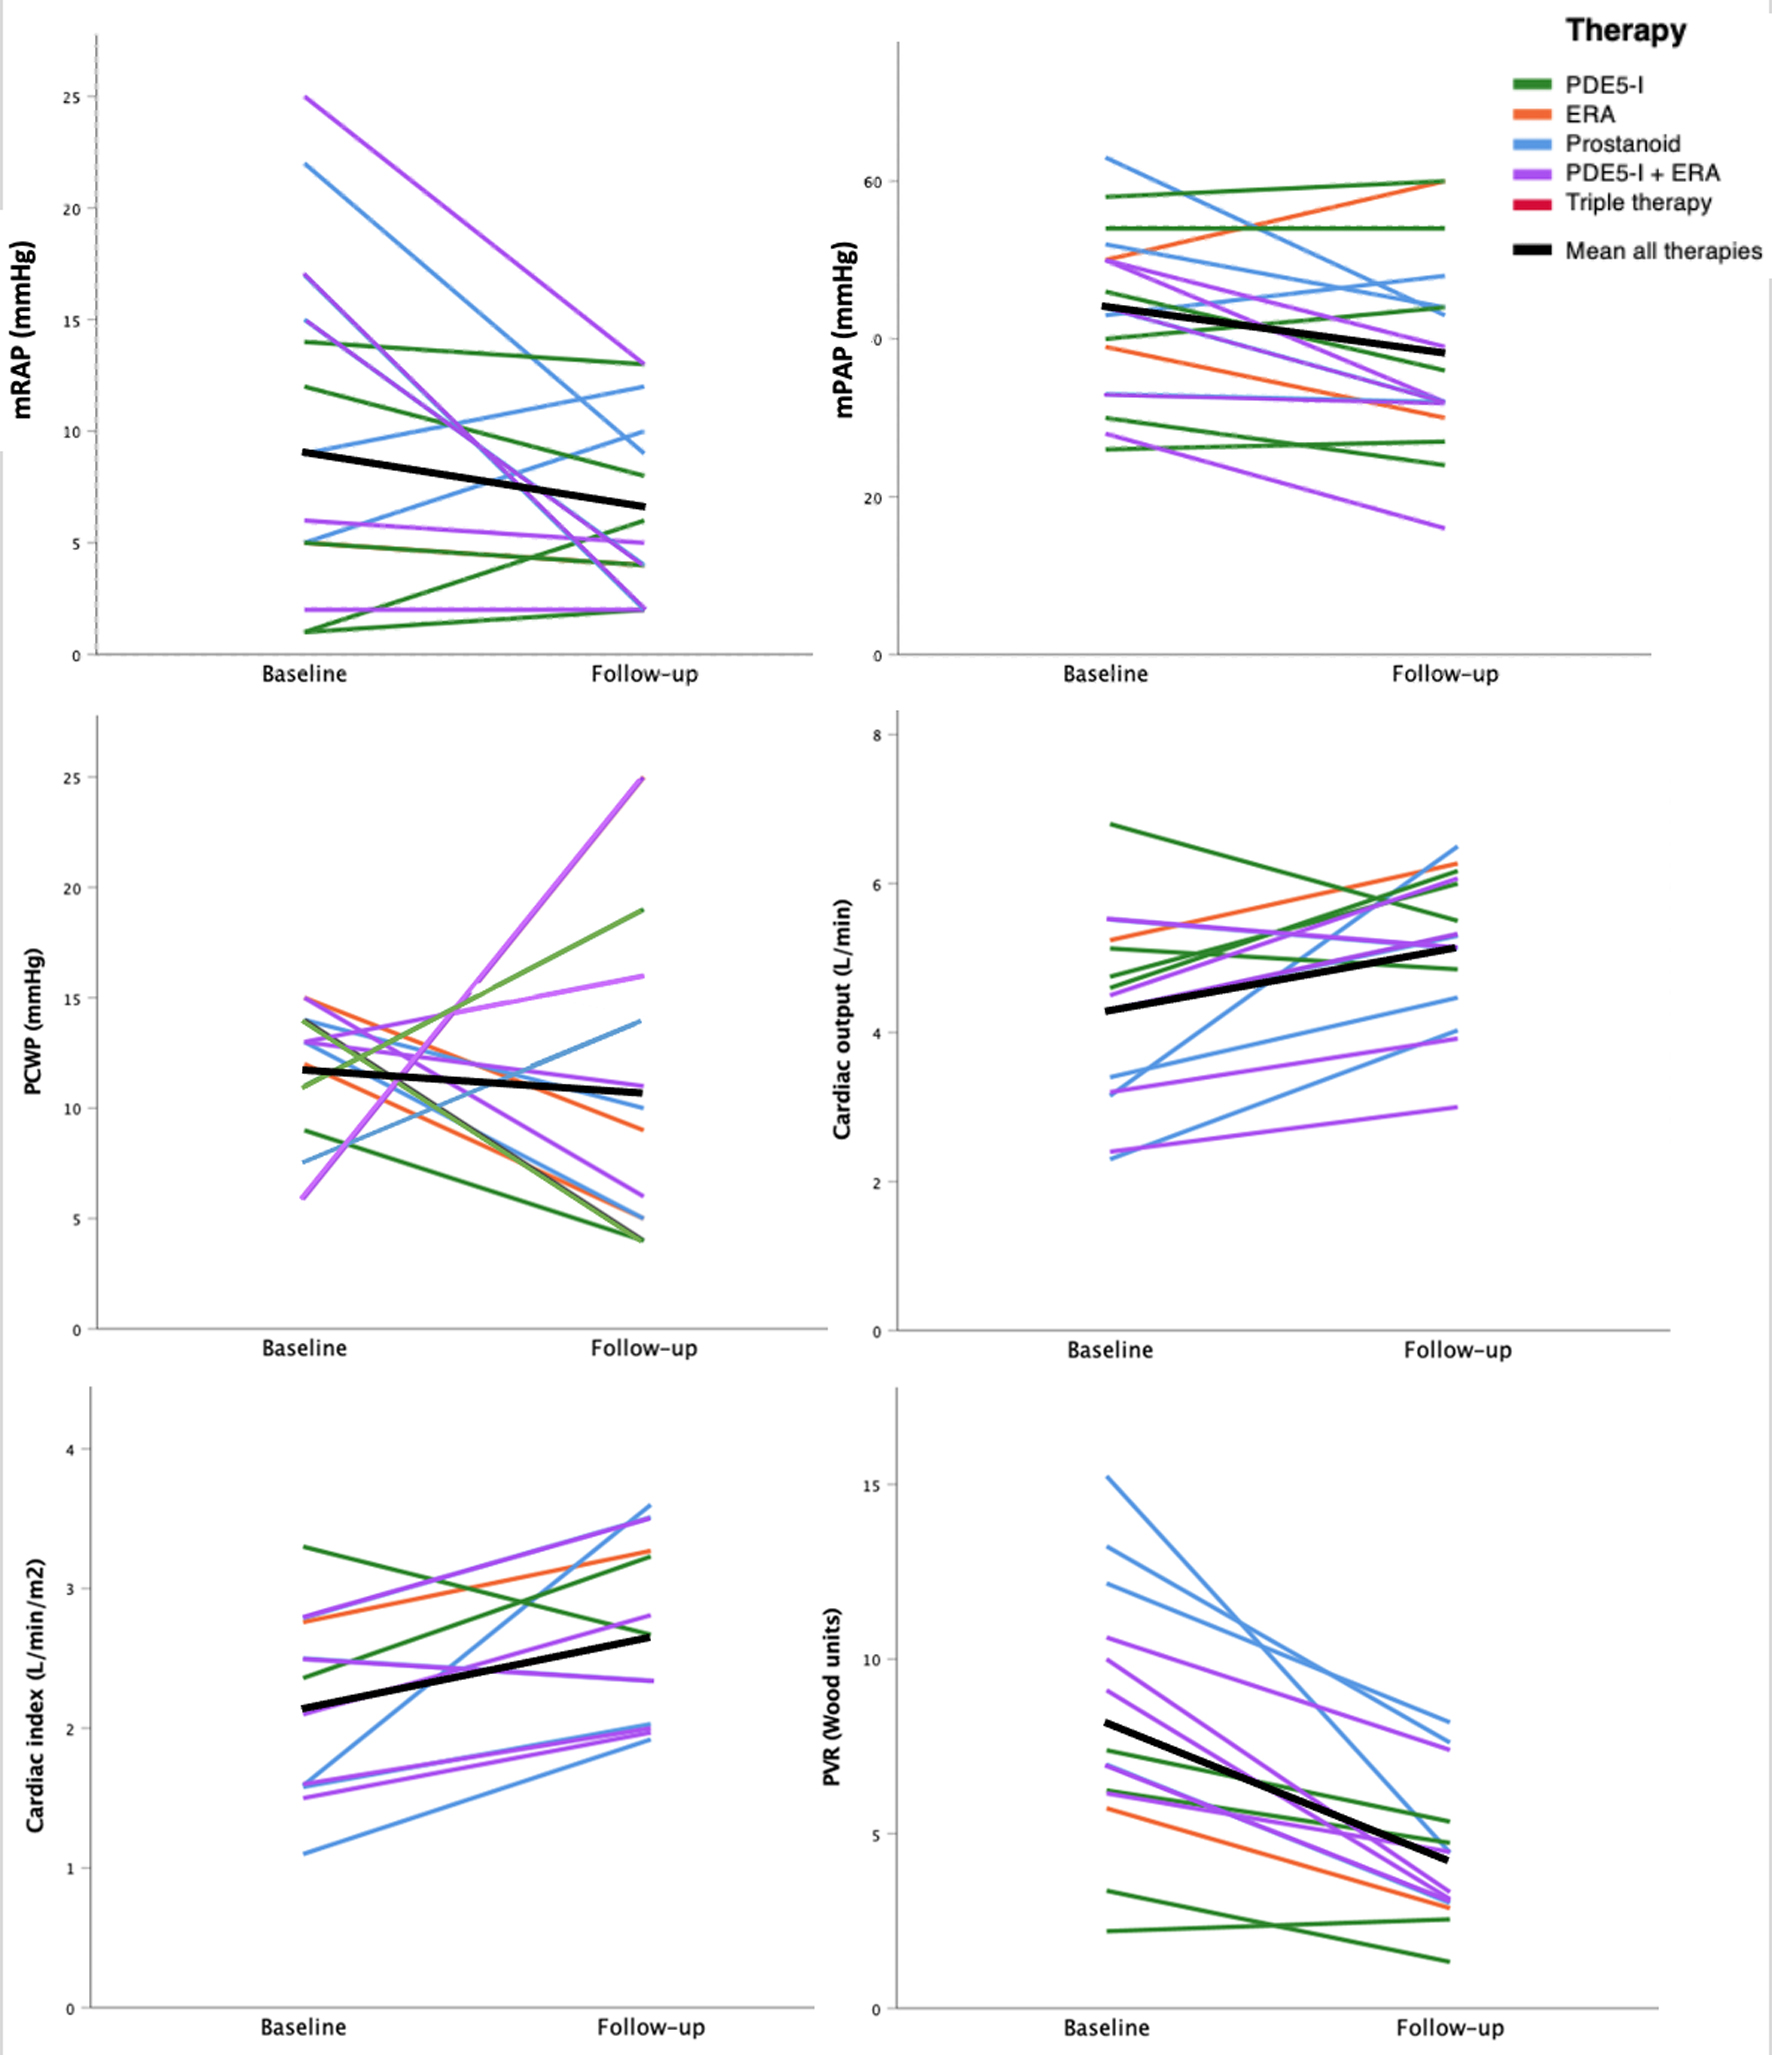
| Pulmonary hemodynamics (n = 33) |
|
| mRAP (mm Hg) |
9.4 ± 4.2 |
| mPAP (mm Hg) |
44.5 ± 10.5 |
| PCWP (mm Hg) |
12.0 ± 3.3 |
| Cardiac output (L/min) |
3.8 ± 1.1 |
| Cardiac index (L/min/m2) |
2.1 ± 0.6 |
| PVR (Wood units) |
8.9 ± 4.0 |
| 6-min walk test or treadmill |
|
| Walk time (s), n = 7 |
335.8 ± 119.7 |
| Walk distance (m), n = 10 |
233.4 ± 87.0 |
| METs, n = 6 |
5.10 ± 1.05 |
| WHO functional class (n = 31) |
|
| II |
6 (19.4) |
| III |
21 (67.7) |
| IV |
4 (12.9) |