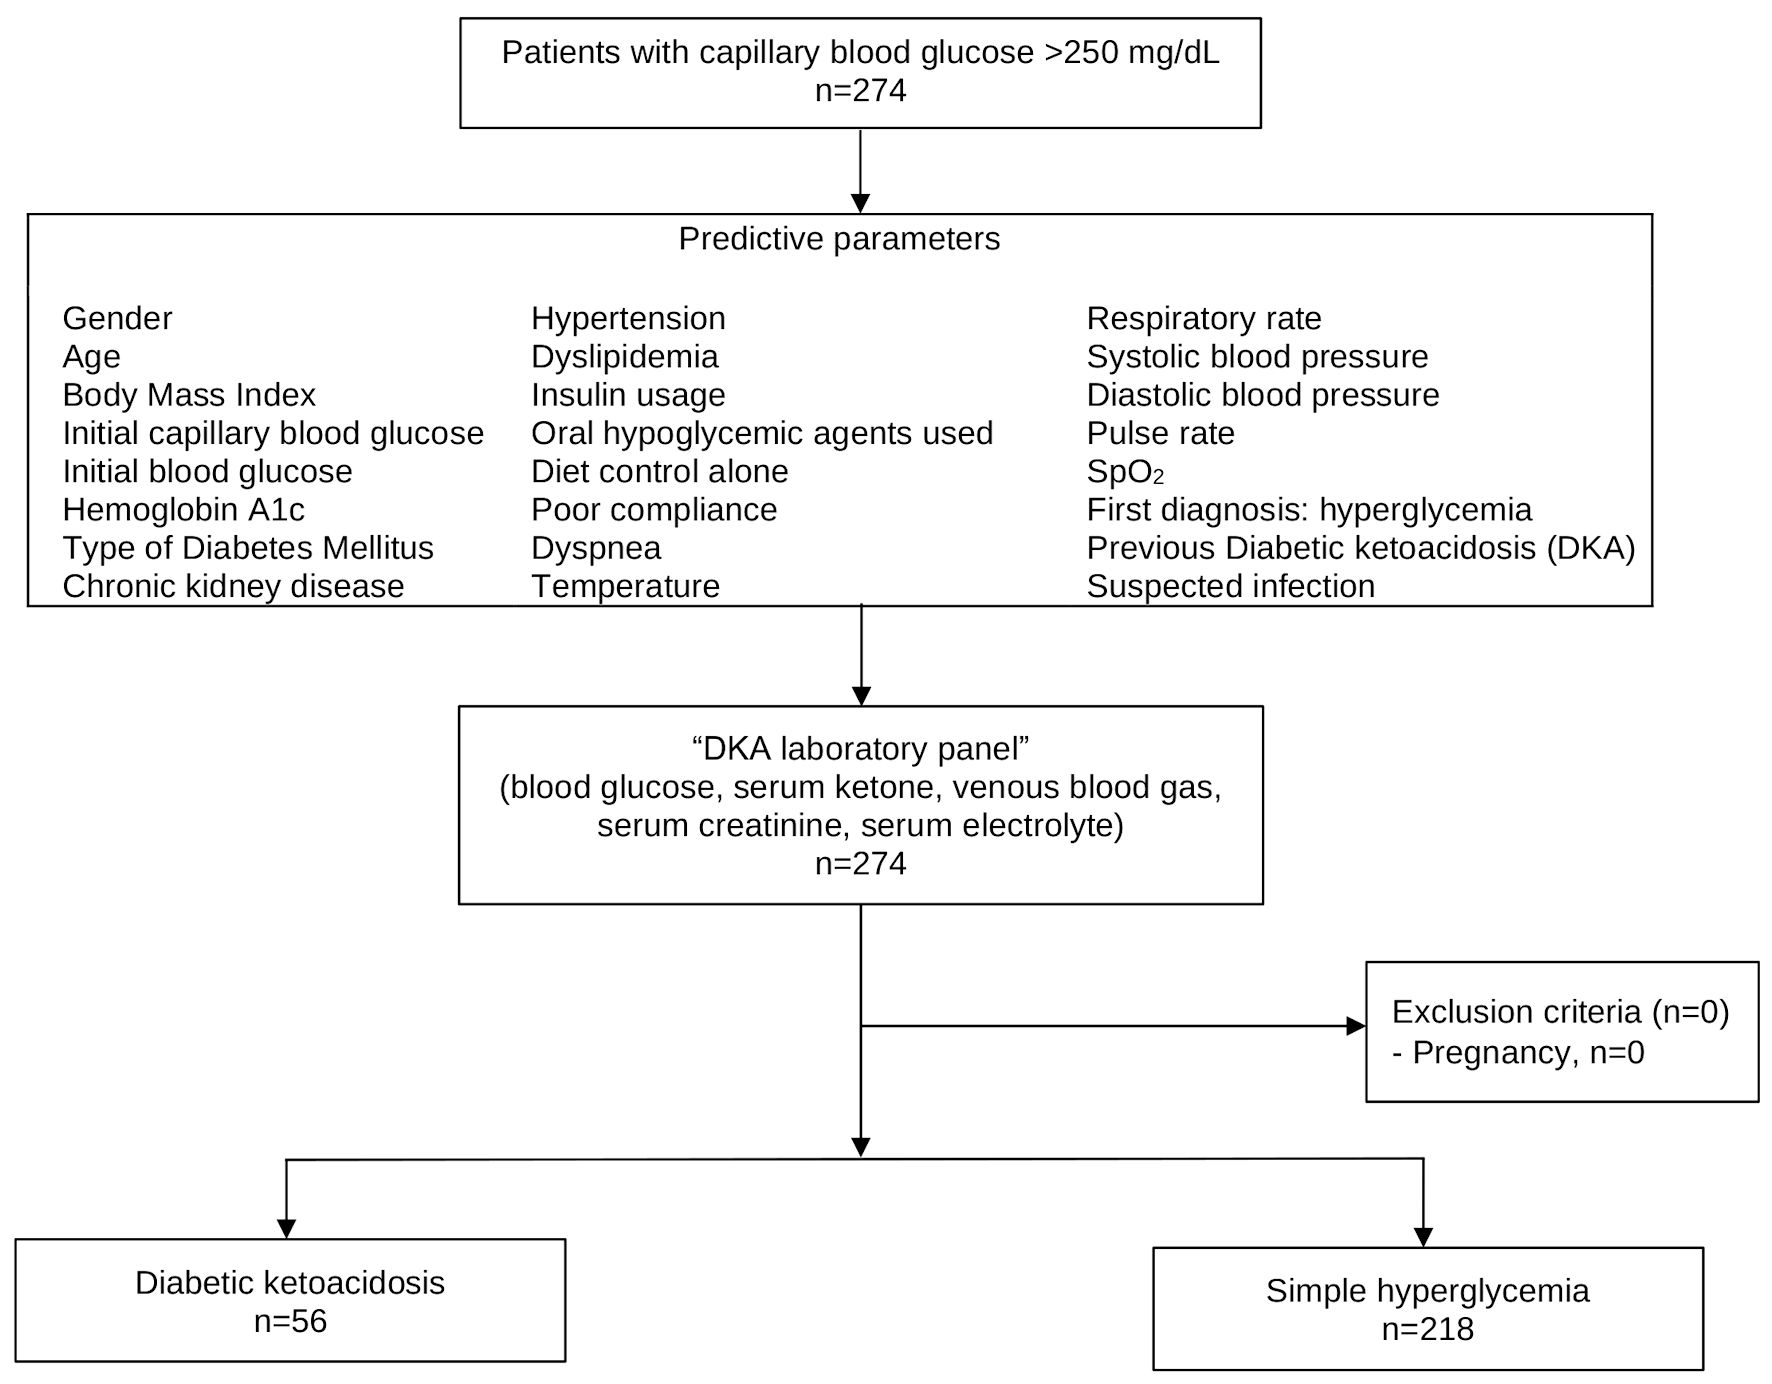
↓ Figure 1. Study flow diagram.
| Journal of Clinical Medicine Research, ISSN 1918-3003 print, 1918-3011 online, Open Access |
| Article copyright, the authors; Journal compilation copyright, J Clin Med Res and Elmer Press Inc |
| Journal website https://jocmr.elmerjournals.com |
Original Article
Volume 17, Number 3, March 2025, pages 164-173
Predictive Factors for Diagnosing Diabetic Ketoacidosis or Simple Hyperglycemia in Adults With High Blood Glucose: The “1-DKA Alert” Study
Figures
Tables
| Baseline characteristics | Missing | Diabetic ketoacidosis (n = 56), mean ± SD | Simple hyperglycemia (n = 218), mean ± SD | P value |
|---|---|---|---|---|
| SD: standard deviation; bpm: beats per minute; SpO2: peripheral capillary oxygen saturation; Cr: Creatinine; eGFR: estimated glomerular filtration rate; CKD: chronic kidney disease. | ||||
| Female, n (%) | 0 | 31 (55.4) | 114 (52.3) | 0.765 |
| Age (years) | 0 | 52.9 ± 18.5 | 60.4 ± 13.7 | 0.001 |
| Body mass index (kg/m2) | 4 | 22.4 ± 4.6 | 23.4 ± 5.0 | 0.209 |
| Symptoms, n (%) | 0 | 54 (96.4) | 124 (56.9) | < 0.001 |
| Dyspnea | 0 | 42 (75.0) | 74 (33.9) | < 0.001 |
| Gastrointestinal/hepatobiliary | 0 | 23 (41.1) | 55 (25.2) | 0.030 |
| Fever | 0 | 18 (32.1) | 55 (25.2) | 0.312 |
| Vital signs | ||||
| Temperature (°C) | 0 | 36.7 ± 1.0 | 36.8 ± 1.1 | 0.613 |
| Respiratory rate | 0 | 27.4 ± 8.7 | 22.1 ± 5.6 | < 0.001 |
| Systolic blood pressure (mm Hg) | 0 | 124.8 ± 34.3 | 138.3 ± 31.9 | 0.006 |
| Diastolic blood pressure (mm Hg) | 0 | 74.7 ± 20.5 | 78.4 ± 18.6 | 0.199 |
| Mean arterial pressure (mm Hg) | 0 | 91.4 ± 24.1 | 98.3 ± 21.3 | 0.035 |
| Pulse rate (bpm) | 0 | 112.4 ± 22.3 | 95.6 ± 21.8 | < 0.001 |
| SpO2 (%) | 0 | 96.5 ± 6.0 | 97.1 ± 3.5 | 0.348 |
| Initial capillary blood glucose (mg/dL) | 0 | 495.3 ± 117.0 | 420.7 ± 108.5 | < 0.001 |
| Initial blood glucose (mg/dL) | 0 | 594.8 ± 299.5 | 431.3 ± 147.7 | < 0.001 |
| Hemoglobin A1c (prior visit) (%) | 95 | 10.1 ± 3.4 | 9.3 ± 3.0 | 0.173 |
| Hemoglobin A1c (latest visit) (%) | 115 | 12.2 ± 3.1 | 10.5 ± 2.9 | 0.001 |
| Cr (prior visit) (mg/dL) median (IQR) | 46 | 0.87 (0.70, 1.28) | 0.94 (0.7, 1.43) | 0.330 |
| eGFR (prior visit) (mL/min/1.73 m2), median (IQR) | 46 | 87.26 (54.86, 107.21) | 78.76 (46.75, 101.26) | 0.135 |
| Cr (latest visit) (mg/dL), median (IQR) | 0 | 1.35 (0.67, 2.76) | 1.11 (0.75, 1.70) | 0.263 |
| eGFR (latest visit) (mL/min/1.73 m2), median (IQR) | 0 | 56.24 (21.60, 104.55) | 63.64 (41.13, 94.71) | 0.604 |
| Urine ketone, median (IQR) | 0 | 3 (2, 4) | 0 (0, 0) | < 0.001 |
| Suspected infection, n (%) | 0 | 46 (82.1) | 104 (47.7) | < 0.001 |
| Presumed source of infection, n (%) | ||||
| No infection | 0 | 11 (19.6) | 113 (51.8) | < 0.001 |
| Pneumonia | 0 | 15 (26.8) | 24 (11.0) | |
| Urinary tract infection | 0 | 13 (23.2) | 31 (14.2) | |
| Septicemia | 0 | 9 (16.1) | 16 (7.3) | |
| Gastrointestinal/hepatobiliary infection | 0 | 1 (1.8) | 5 (2.4) | |
| Infected wound | 0 | 0 (0) | 16 (7.3) | |
| Other | 0 | 7 (12.5) | 13 (6.0) | |
| First diagnosis: hyperglycemia, n (%) | 0 | 2 (3.6) | 22 (10.1) | 0.183 |
| Previous diabetic ketoacidosis, n (%) | 0 | 14 (25.0) | 9 (4.1) | < 0.001 |
| Diabetes mellitus, n (%) | 0 | 54 (96.4) | 196 (89.9) | 0.183 |
| Type of diabetes mellitus (DM), n (%) | ||||
| Undiagnosed DM | 0 | 2 (3.6) | 22 (10.1) | < 0.001 |
| Type 1 DM | 0 | 8 (14.3) | 3 (1.4) | |
| Type 2 DM | 0 | 46 (82.1) | 193 (88.5) | |
| CKD stages 3 - 5, n (%) | 0 | 18 (32.1) | 81 (37.2) | 0.535 |
| Hypertension, n (%) | 0 | 33 (58.9) | 154 (70.6) | 0.108 |
| Dyslipidemia, n (%) | 0 | 24 (42.9) | 120 (55.1) | 0.133 |
| Insulin usage, n (%) | 0 | 39 (69.6) | 64 (29.4) | < 0.001 |
| Type of insulin, n (%) | ||||
| Multiple dose regular insulin | 169 | 6 (15.4) | 12 (18.2) | 0.794 |
| Isophane insulin | 170 | 9 (23.1) | 14 (21.5) | 1 |
| Mixtard insulin | 170 | 31 (79.5) | 41 (63.1) | 0.124 |
| Oral hypoglycemic agent used, n (%) | 0 | 25 (44.6) | 138 (63.3) | 0.014 |
| Type of oral hypoglycemic agents, n (%) | ||||
| Sulfonylureas (glipizide) | 110 | 9 (36.0) | 69 (49.6) | 0.277 |
| Biguanides (metformin) | 110 | 24 (96.0) | 112 (80.6) | 0.081 |
| Thiazolidinediones (pioglitazone) | 110 | 13 (52.0) | 45 (32.4) | 0.071 |
| Diet control alone, n (%) | 0 | 2 (3.6) | 21 (9.6) | 0.183 |
| Poor compliance, n (%) | 0 | 42 (75.0) | 97 (44.5) | < 0.001 |
| Predictors | Diabetic ketoacidosis | ||
|---|---|---|---|
| mRR | 95% CI | P value | |
| mRR: multivariable risk ratio; DM: diabetes mellitus; CI: confidence interval. | |||
| Initial capillary blood glucose (mg/dL) | 1 | 1.00, 1.00 | 0.043 |
| History of DM | Reference | ||
| Type 1 DM | 2.93 | 1.00, 8.52 | 0.049 |
| Type 2 DM | 2.14 | 0.83, 5.53 | 0.117 |
| Insulin usage | 2.79 | 1.63, 4.77 | < 0.001 |
| Poor compliance | 2.43 | 1.45, 4.05 | 0.001 |
| Respiratory rate | 1.04 | 1.01, 1.06 | 0.001 |
| Suspected infection | 2.51 | 1.32, 4.78 | 0.005 |
| Parameters | Apparent performance | Bootstrap performance |
|---|---|---|
| AuROC: area under the receiver operating characteristic curve; CITL: calibration-in-the-large; E:O ratio: expected-to-observed outcomes ratio. | ||
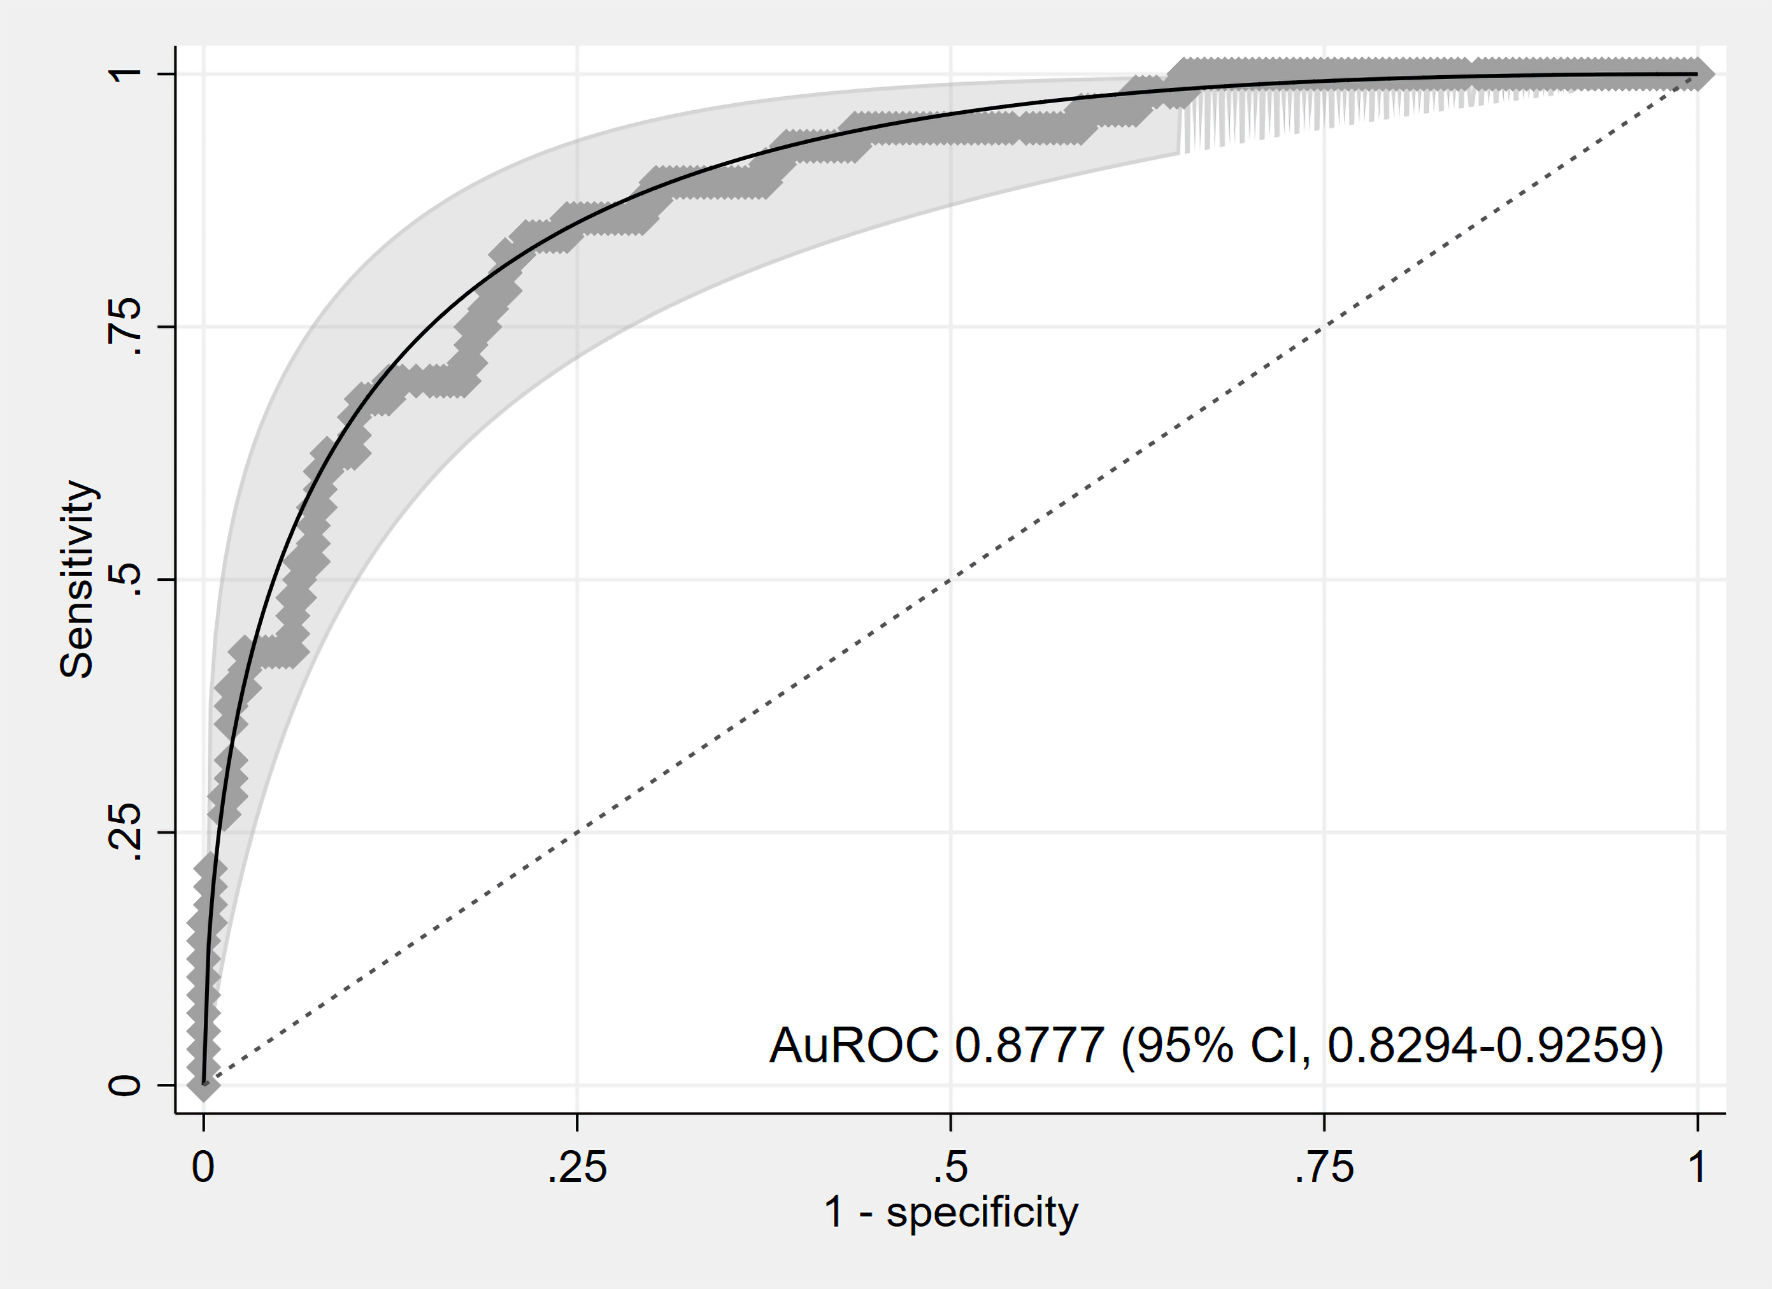
| AuROC | 0.8777 (0.8294, 0.9259) | 0.8770 (0.8330, 0.9310) |
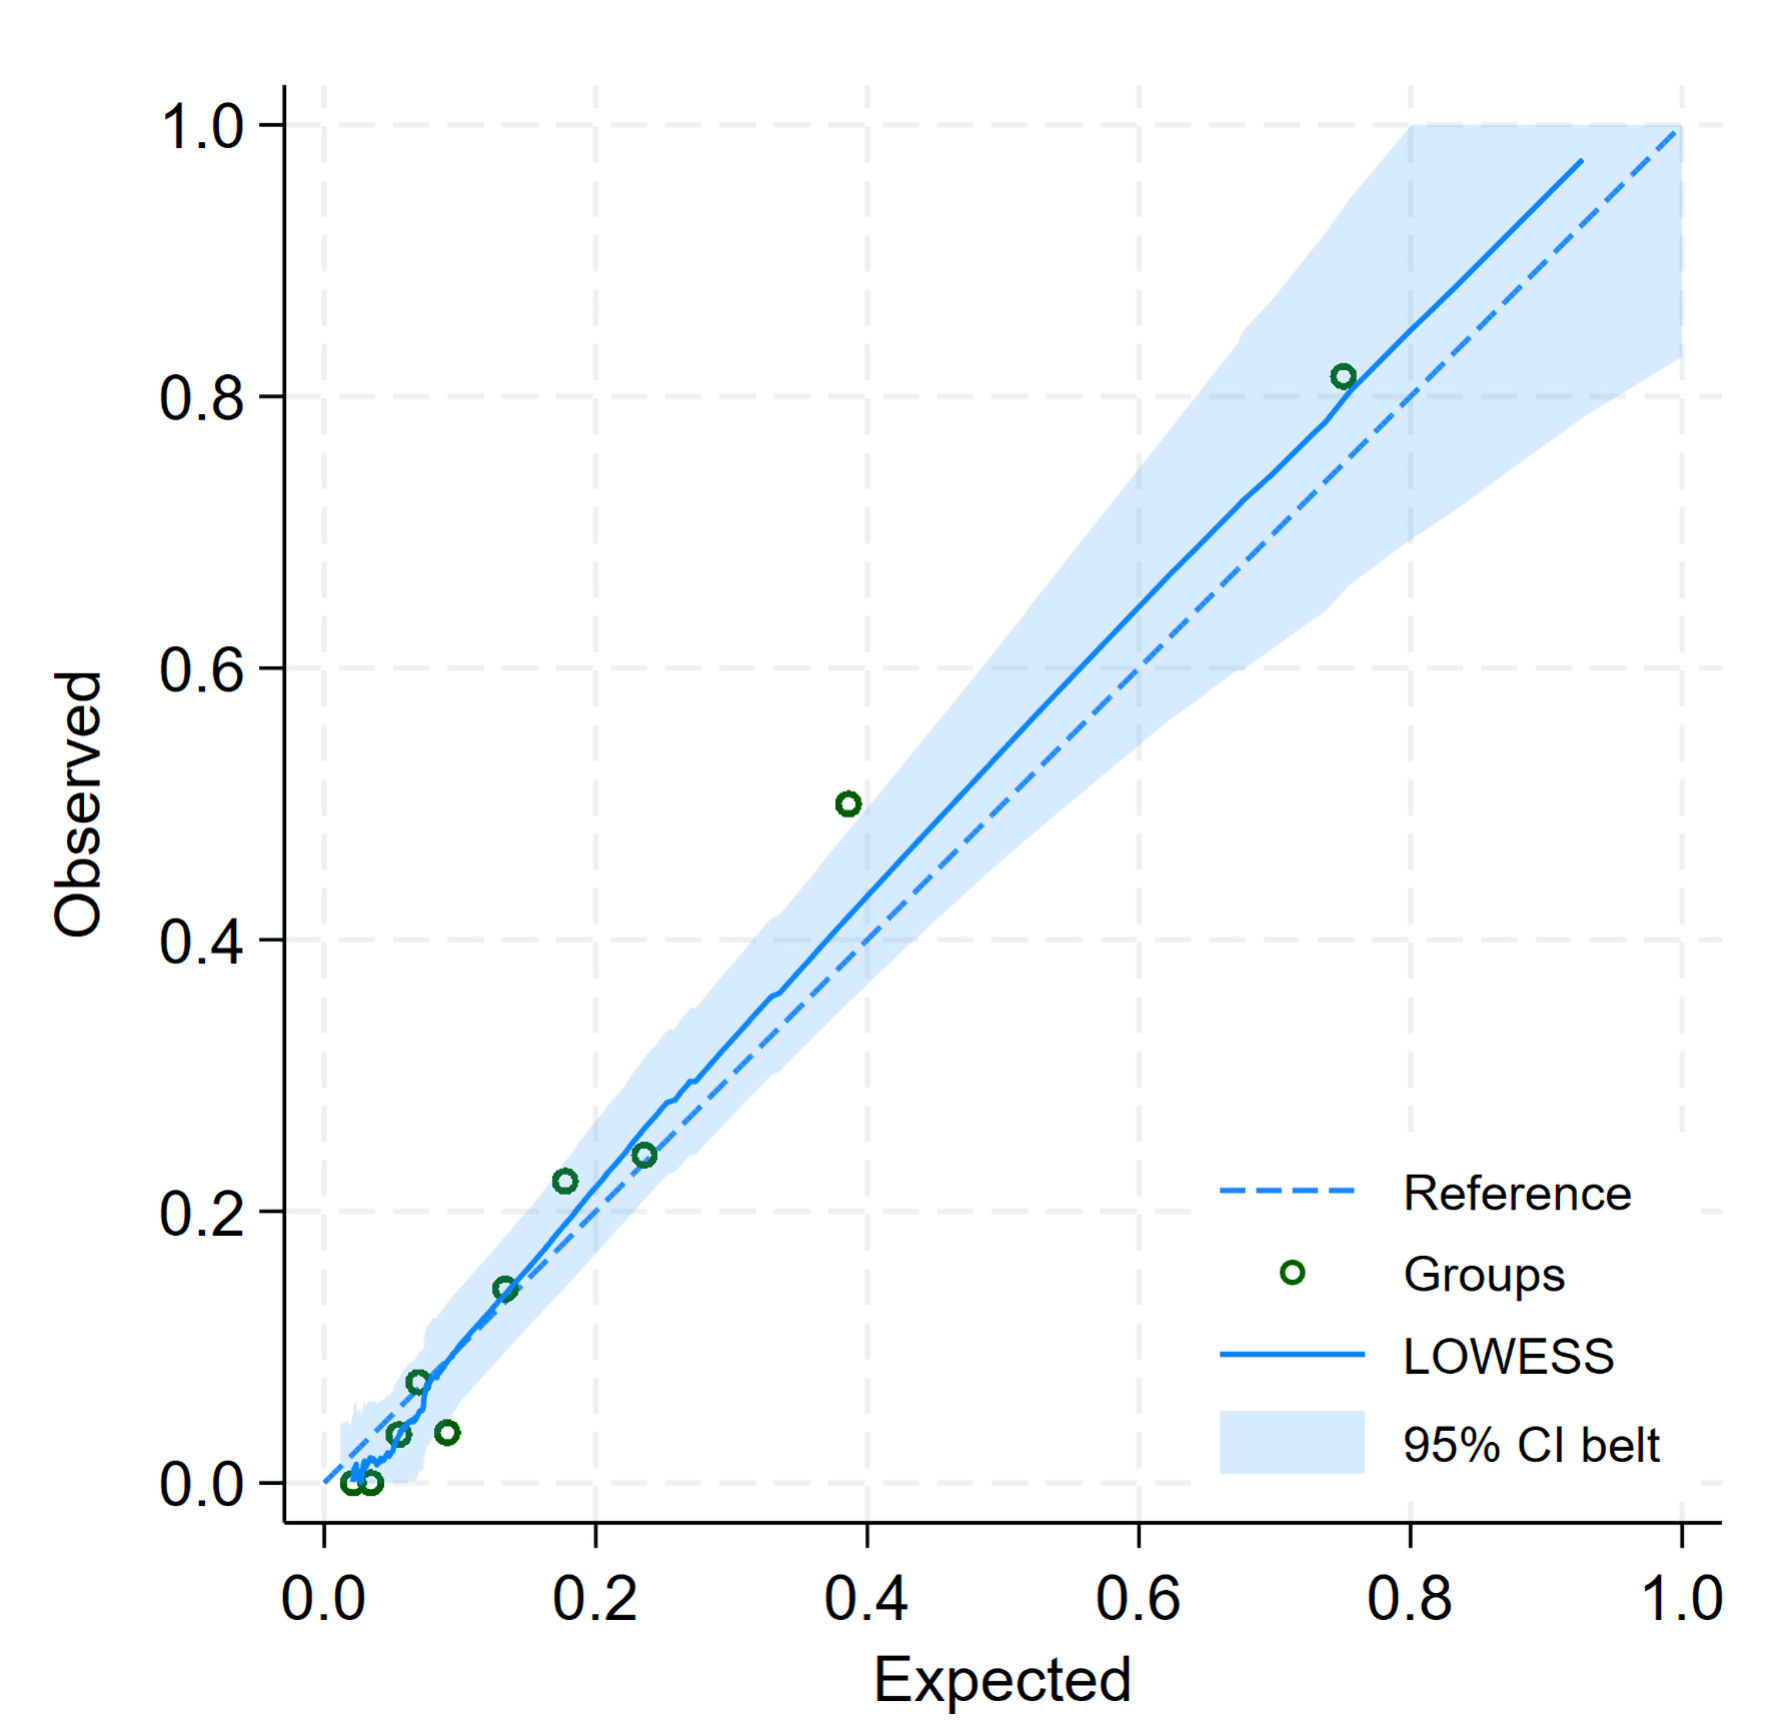
| Slope | 1.000 (0.730, 1.270) | 0.991 (0.743, 1.285) |
| E:O ratio | 1.000 | 1.004 |
| CITL | 0.000 (-0.367, 0.367) | 0.002 (-0.386, 0.425) |
| Bootstrap shrinkage | - | 0.991 |
| Cut-point | DKA (n = 56) | Simple hyperglycemia (n = 218) | Total | Sensitivity | Specificity | PPV | NPV |
|---|---|---|---|---|---|---|---|
| DKA: diabetic ketoacidosis; PPV: positive predictive value; NPV: negative predictive value. | |||||||
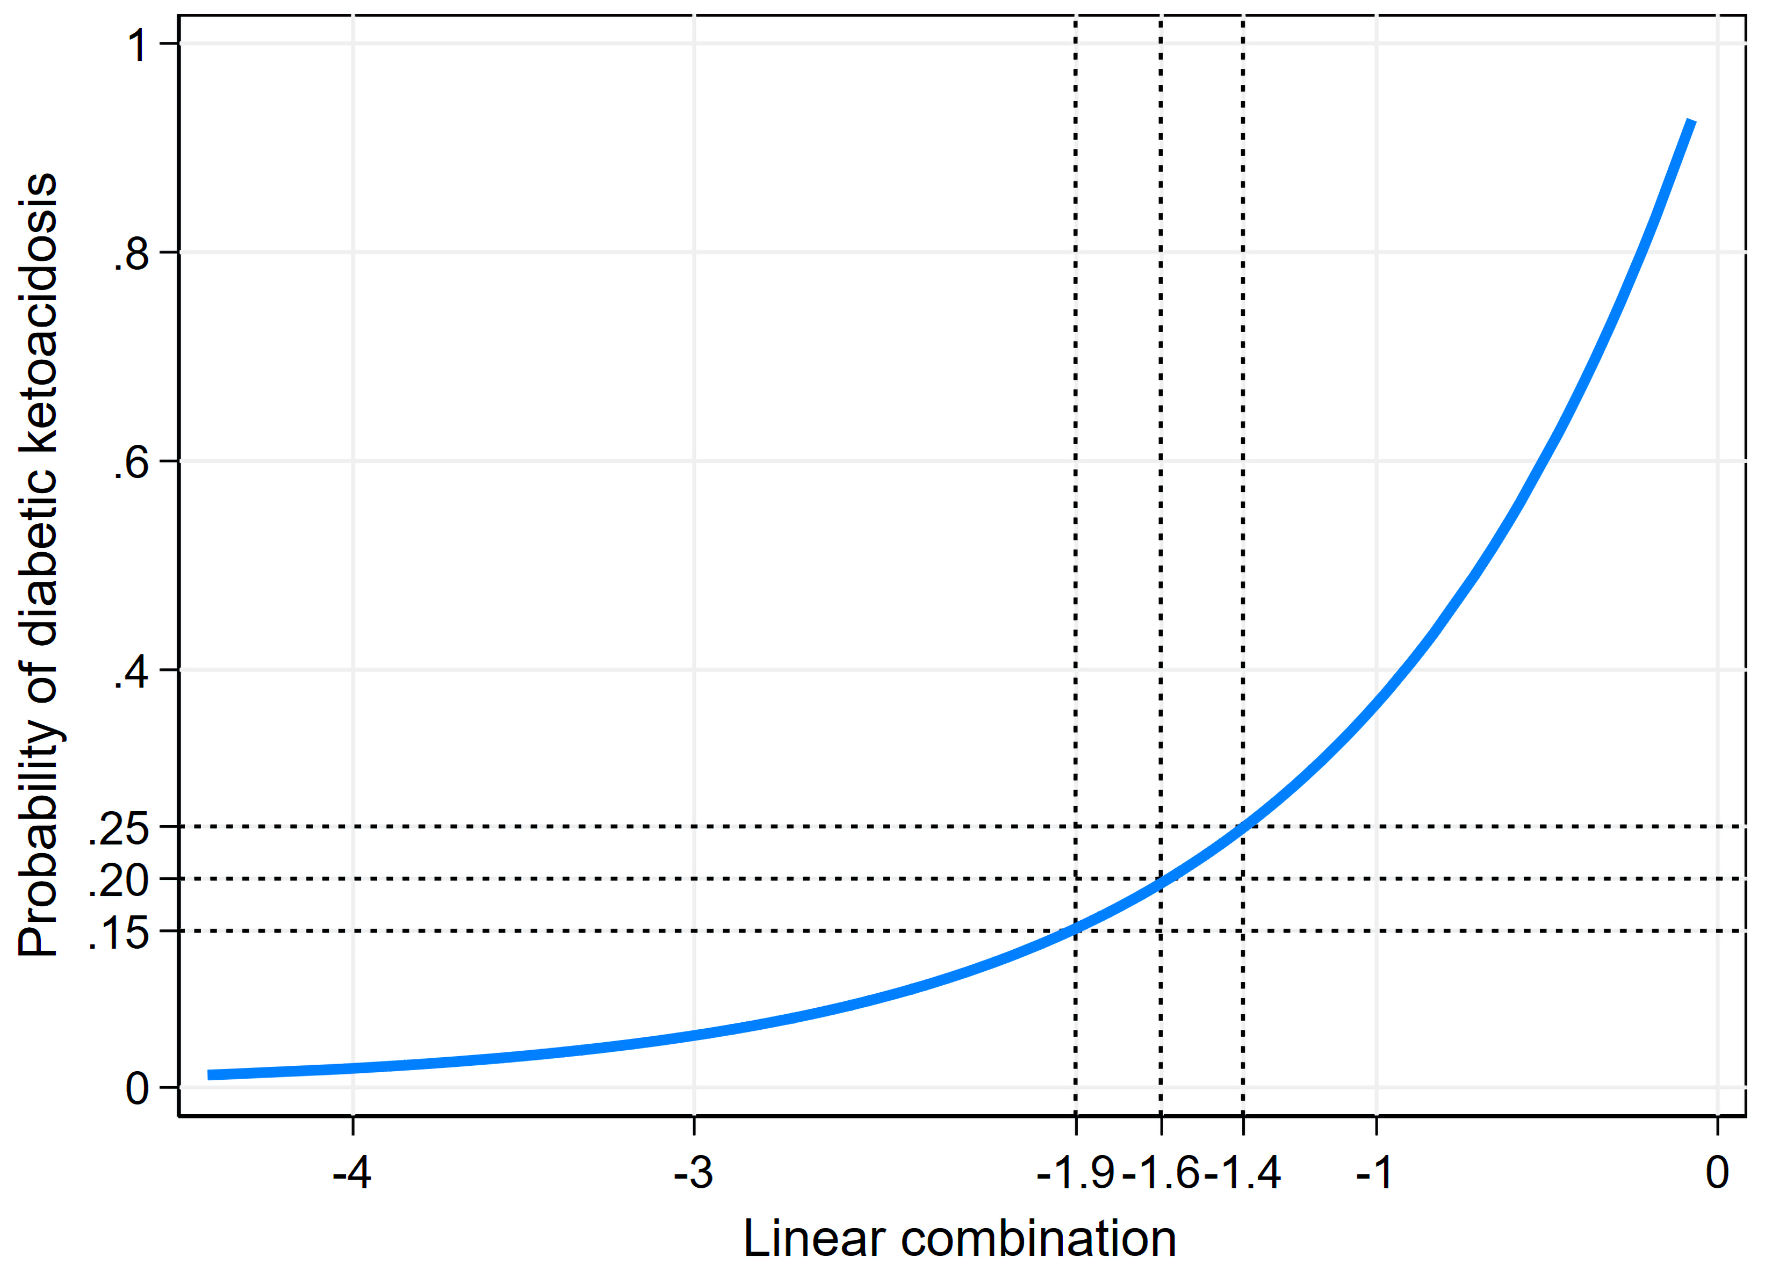
| Probability > 15% | 50 (18.2%) | 67 (24.5%) | 117 | 89.3% | 78.1% | 42.7% | 96.2% |
| Probability ≤ 15% | 6 (2.2%) | 151 (55.1%) | 157 | ||||
| Probability > 19.4% | 43 (15.7%) | 42 (15.3%) | 85 | 76.8% | 80.7% | 50.6% | 93.1% |
| Probability ≤ 19.4% | 13 (4.7%) | 176 (64.3%) | 189 | ||||
| Probability > 25% | 38 (13.9%) | 25 (9.1%) | 63 | 67.9% | 88.5% | 60.3% | 91.5% |
| Probability ≤ 25% | 18 (6.6%) | 193 (70.4%) | 211 | ||||