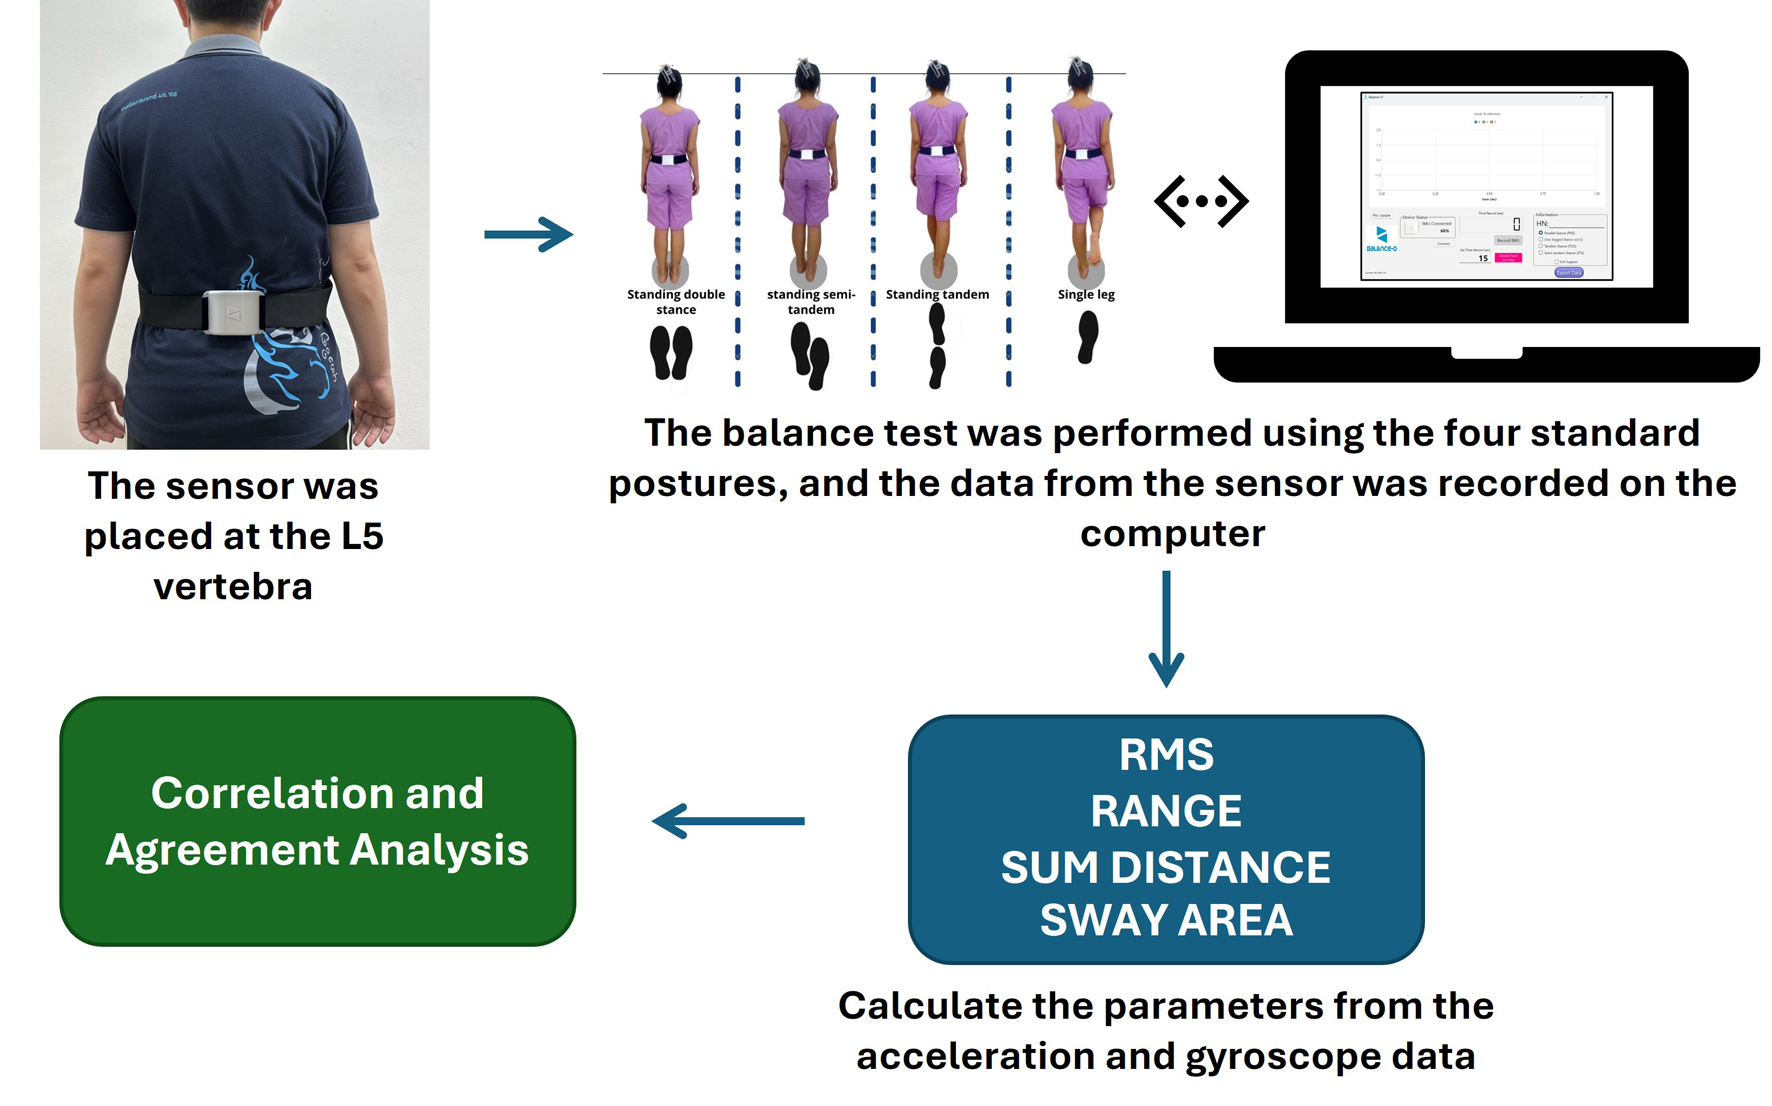
↓ Figure 1. The diagram for the experimental
procedure.
| Journal of Clinical Medicine Research, ISSN 1918-3003 print, 1918-3011 online, Open Access |
| Article copyright, the authors; Journal compilation copyright, J Clin Med Res and Elmer Press Inc |
| Journal website https://jocmr.elmerjournals.com |
Original Article
Volume 17, Number 4, April 2025, pages 200-207
Evaluating Postural Sway in the Elderly Using Inertial Measurement Units: A Study on Center of Mass Measurements via Accelerometers and Gyroscopes
Figures
Tables
| Characteristic | Mean ± SD | Min - Max |
|---|---|---|
| BMI: body mass index; SD: standard deviation. | ||
| Male/female, N (%) | 58 (50.90%)/56 (49.10%) | |
| Age (years) | 65.90 ± 6.60 | 60.00 - 84.00 |
| Weight (kg) | 57.40 ± 9.40 | 38.00 - 90.00 |
| Height (cm) | 158.80 ± 7.70 | 145.00 - 175.00 |
| BMI (kg/m2) | 22.80 ± 3.80 | 15.80 - 40.00 |
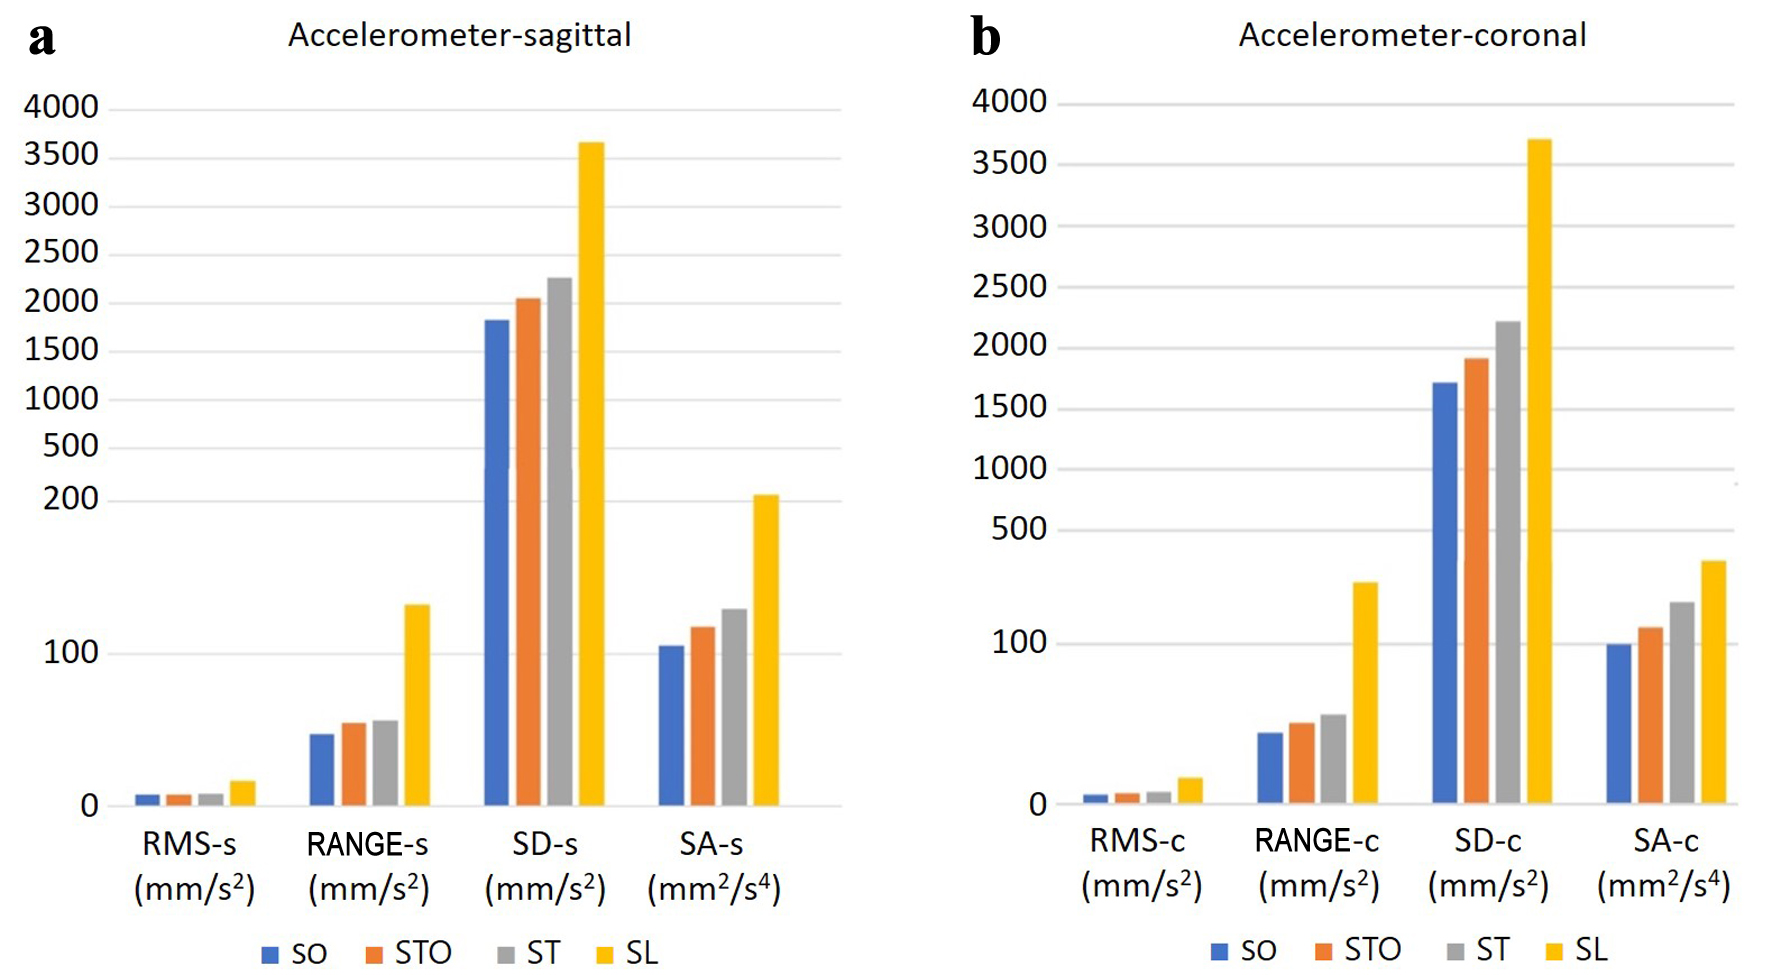
| Sensor variable-plane | SO | STO | TO | SL |
|---|---|---|---|---|
| Mean ± SD (min - max) | Mean ± SD (min - max) | Mean ± SD (min - max) | Mean ± SD (min - max) | |
| SO: standing in a double stance; STO: semi-tandem stance; TO: tandem stance; SL: single-leg stance; RMS: root mean square of magnitude; RANGE: summation of the range of signals; SA: sway area; SD: summation of distance; AP: anteroposterior; ML: mediolateral. | ||||
| RMS-AP | 6.79 ± 1.56 (4.14 - 14.73) | 7.59 ± 2.39 (4.79 - 25.31) | 8.31 ± 2.32 (4.49 - 17.50) | 16.43 ± 8.44 (6.99 - 43.68) |
| RANGE-AP | 47.49 ± 22.84 (27.30 - 217.04) | 54.61 ± 36.99 (30.23 - 340.39) | 56.41 ± 18.85 (27.64 - 126.31) | 132.22 ± 88.60 (43.84 - 513.53) |
| SD-AP | 1,827.48 ± 442.49 (155.36 - 4,125.70) | 2,051.46 ± 539.91 (1,247.46 - 5,208.08) | 2,265.73 ± 675.61 (128.78 - 4,718.57) | 3,664.93 ± 1,697.59 (263.45 - 10,243.82) |
| SA-AP | 105.44 ± 23.84 (9.64 - 216.12) | 117.38 ± 29.28 (75.57 - 287.88) | 129.16 ± 37.58 (7.45 - 270.44) | 203.91 ± 95.40 (16.64 - 562.37) |
| RMS-ML | 6.42 ± 1.26 (3.98 - 11.74) | 7.15 ± 2.32 (3.98 - 26.42) | 8.13 ± 2.24 (4.61 - 21.80) | 16.92 ± 9.16 (6.79 - 50.78) |
| RANGE-ML | 44.34 ± 18.19 (23.00 - 162.58) | 51.20 ± 36.15 (23.00 - 368.64) | 55.70 ± 20.72 (27.48 - 164.75) | 138.77 ± 95.19 (41.48 - 463.85) |
| SD-ML | 1,715.77 ± 371.94 (172.02 - 3,150.02) | 1,920.74 ± 476.83 (1,041.54 - 5,113.17) | 2,220.84 ± 638.73 (151.54 - 6,118.31) | 3,715.43 ± 1,062.16 (224.74 - 10,440.58) |
| SA-ML | 99.93 ± 20.21 (10.87 - 183.46) | 110.64 ± 26.26 (63.68 - 285.77) | 126.48 ± 35.79 (8.49 - 344.33) | 205.56 ± 88.28 (14.72 - 575.24) |
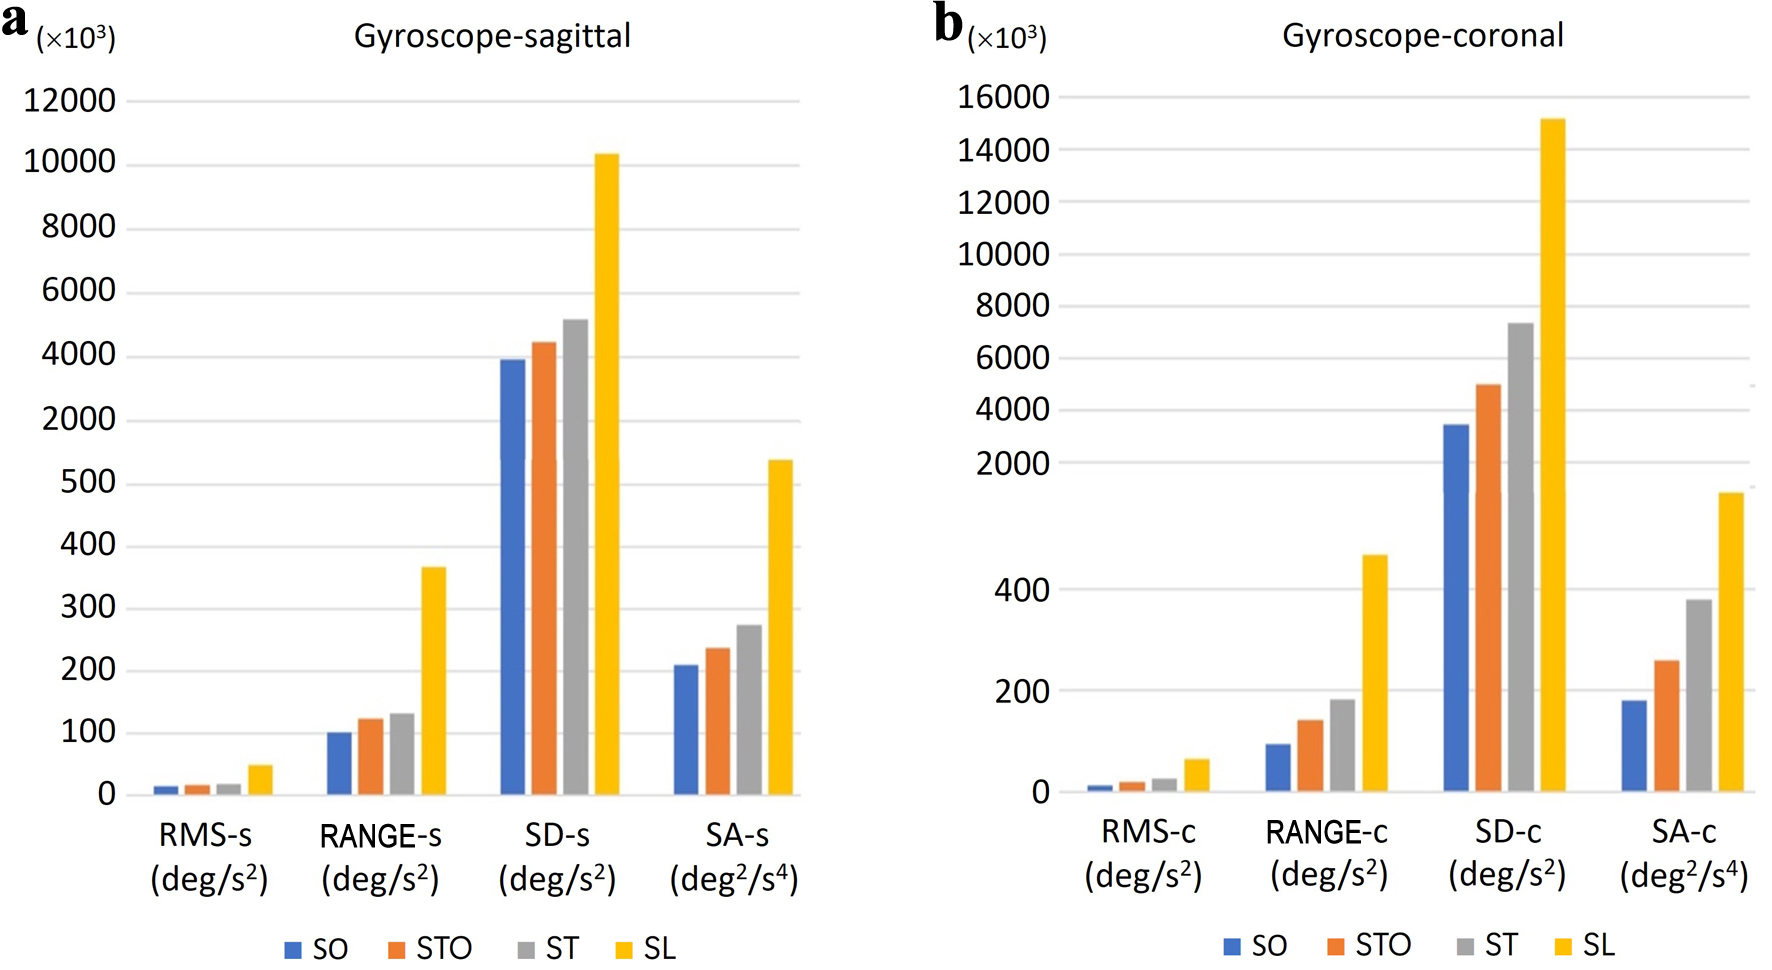
| Sensor variable-plane | SO | STO | TO | SL |
|---|---|---|---|---|
| Mean ± SD (min - max) | Mean ± SD (min - max) | Mean ± SD (min - max) | Mean ± SD (min - max) | |
| ST: standing in a double stance; STO: semi-tandem stance; TO: tandem stance; SL: single-leg stance; RMS: root mean square of magnitude; RANGE: summation of the range of signals; SA: sway area; SD: summation of distance; AP: anteroposterior; ML: mediolateral. | ||||
| RMS-AP | 13.76 ± 6.60 (6.60 - 37.87) | 15.89 ± 7.80 (6.60 - 57.53) | 18.08 ± 7.53 (7.38 - 49.57) | 48.52 ± 38.48 (13.33 - 221.85) |
| RANGE-AP | 100.68 ± 77.87 (35.78 - 428.28) | 123.64 ± 106.13 (35.78 - 809.96) | 131.41 ± 79.71 (404.35 - 479.31) | 368.33 ± 314.66 (91.81 - 2,030.45) |
| SD-AP | 3,927.88 ± 1,702.50 (278.63 - 10,457.95) | 4,480.53 ± 1,812.35 (1,965.70 - 11,185.88) | 5,176.23 ± 2,027.73 (309.03 - 14,579.99) | 10,358.00 ± 5,467.50 (1,805.89 - 29,778.82) |
| SA-AP | 209.19 ± 91.48 (15.20 - 549.83) | 237.03 ± 96.96 (108.02 - 604.03) | 274.22 ± 109.74 (16.39 - 755.50) | 542.40 ± 288.58 (98.16 - 1,608.70) |
| RMS-ML | 12.31 ± 6.84 (5.91 - 52.28) | 18.07 ± 14.11 (5.91 - 116.08) | 25.48 ± 13.57 (7.41 - 88.73) | 64.98 ± 39.69 (16.49 - 193.58) |
| RANGE-ML | 94.32 ± 90.73 (33.13 - 665.48) | 141.74 ± 166.90 (36.20 - 1,265.98) | 182.92 ± 115.91 (43.99 - 720.27) | 467.52 ± 324.89 (124.74 - 1,944.65) |
| SD-ML | 3,452.58 ± 1,618.41 (212.47 - 13,451.28) | 4,989.07 ± 2,760.91 (1,712.87 - 19,905.53) | 7,346.36 ± 3,819.67 (566.10 - 25,711.87) | 15,186.71 ± 7,620.50 (1,418.84 - 42,005.72) |
| SA-ML | 180.95 ± 81.34 (11.95 - 681.07) | 258.82 ± 140.16 (93.46 - 1,024.37) | 378.90 ± 195.82 (29.87 - 1,339.51) | 778.13 ± 391.17 (76.09 - 2,170.28) |
| Sensor variable | Correlation coefficient | |
|---|---|---|
| r | P-value | |
| RMS: root mean square of magnitude; RANGE: summation of the range of signals; SA: sway area; SD: summation of distance; AP: anteroposterior; ML: mediolateral. | ||
| RMS-AP | 0.81 | < 0.001 |
| RMS-ML | 0.86 | < 0.001 |
| RANGE-AP | 0.82 | < 0.001 |
| RANGE-ML | 0.84 | < 0.001 |
| SD-AP | 0.79 | < 0.001 |
| SD-ML | 0.85 | < 0.001 |
| SA-AP | 0.79 | < 0.001 |
| SA-ML | 0.85 | < 0.001 |
| Sensor variable | ICC | |||
|---|---|---|---|---|
| ICC(2,1) | Lower 95% | Upper 95% | P-value | |
| ICC: intraclass correlation coefficient; RMS: root mean square of magnitude; RANGE: summation of the range of signals; SA: sway area; SD: summation of distance; AP: anteroposterior; ML: mediolateral. | ||||
| RMS-AP | 0.58 | 0.55 | 0.65 | < 0.001 |
| RMS-ML | 0.54 | 0.45 | 0.62 | < 0.001 |
| RANGE-AP | 0.64 | 0.56 | 0.70 | < 0.001 |
| RANGE-ML | 0.60 | 0.52 | 0.67 | < 0.001 |
| SD-AP | 0.63 | 0.56 | 0.70 | < 0.001 |
| SD-ML | 0.50 | 0.39 | 0.59 | < 0.001 |
| SA-AP | 0.65 | 0.58 | 0.71 | < 0.001 |
| SA-ML | 0.52 | 0.42 | 0.60 | < 0.001 |