Figures
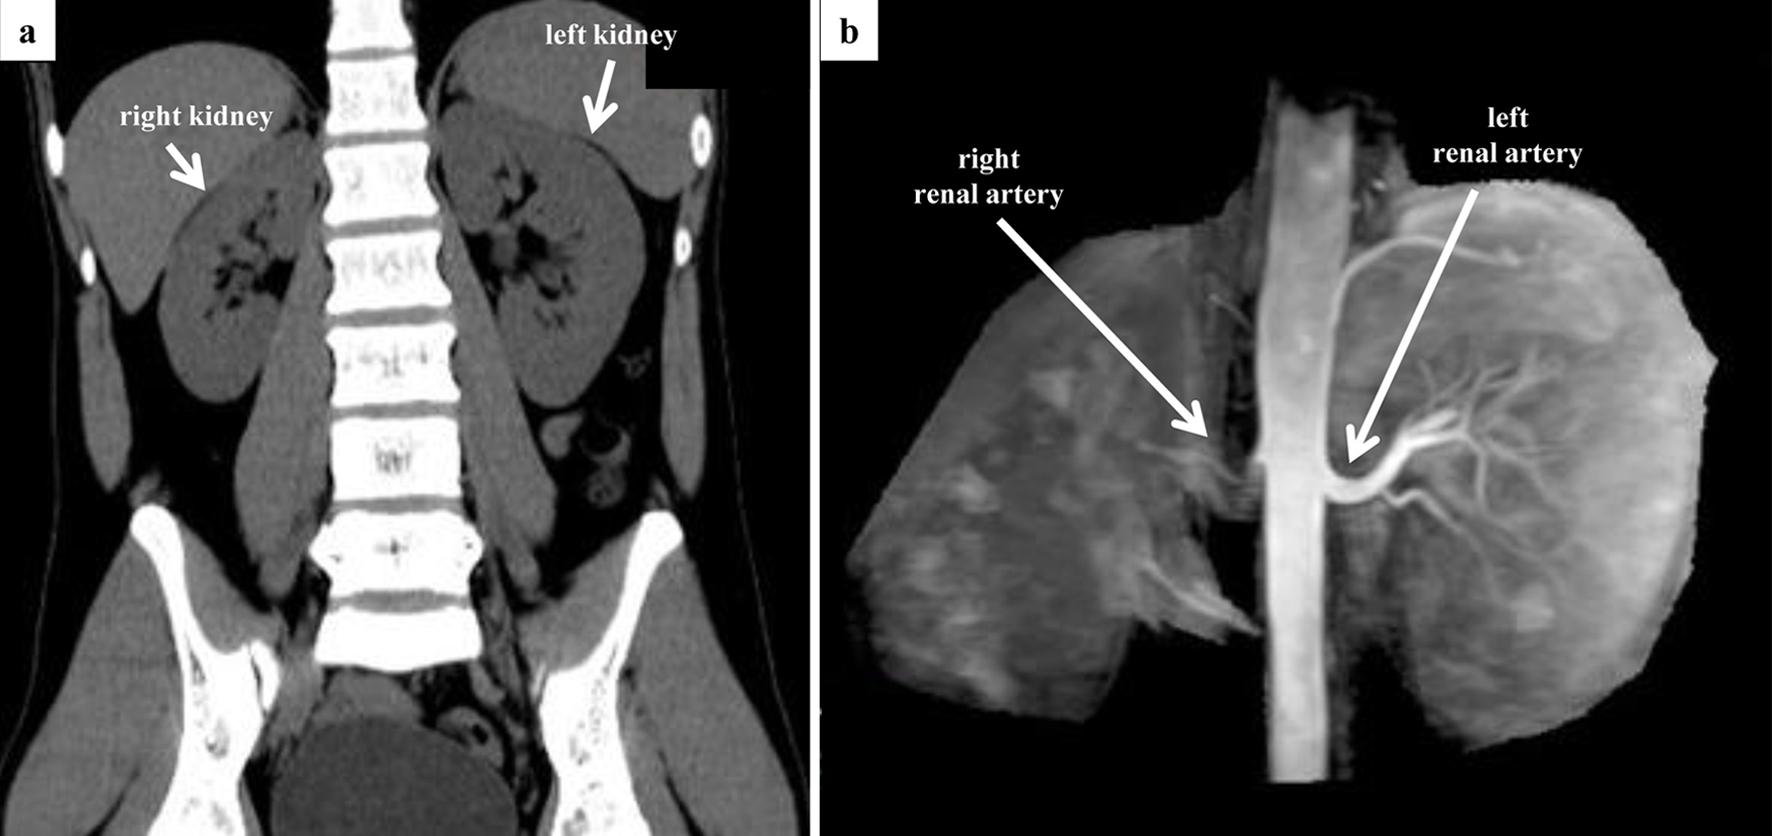
↓ Figure 1. Preoperative CT and MRA evaluation.
(a) Coronal view of abdominal CT. There is a difference in the size of the left and right kidney (right,
10.4 × 4.0 cm; left, 11.6 × 5.8 cm). No adrenal mass was observed. (b) Non-contrast-enhanced
MRA. Although the entrance of the right renal artery is visible, visualization of the right renal artery
itself is poor. CT: computed tomography; MRA: magnetic resonance angiography.
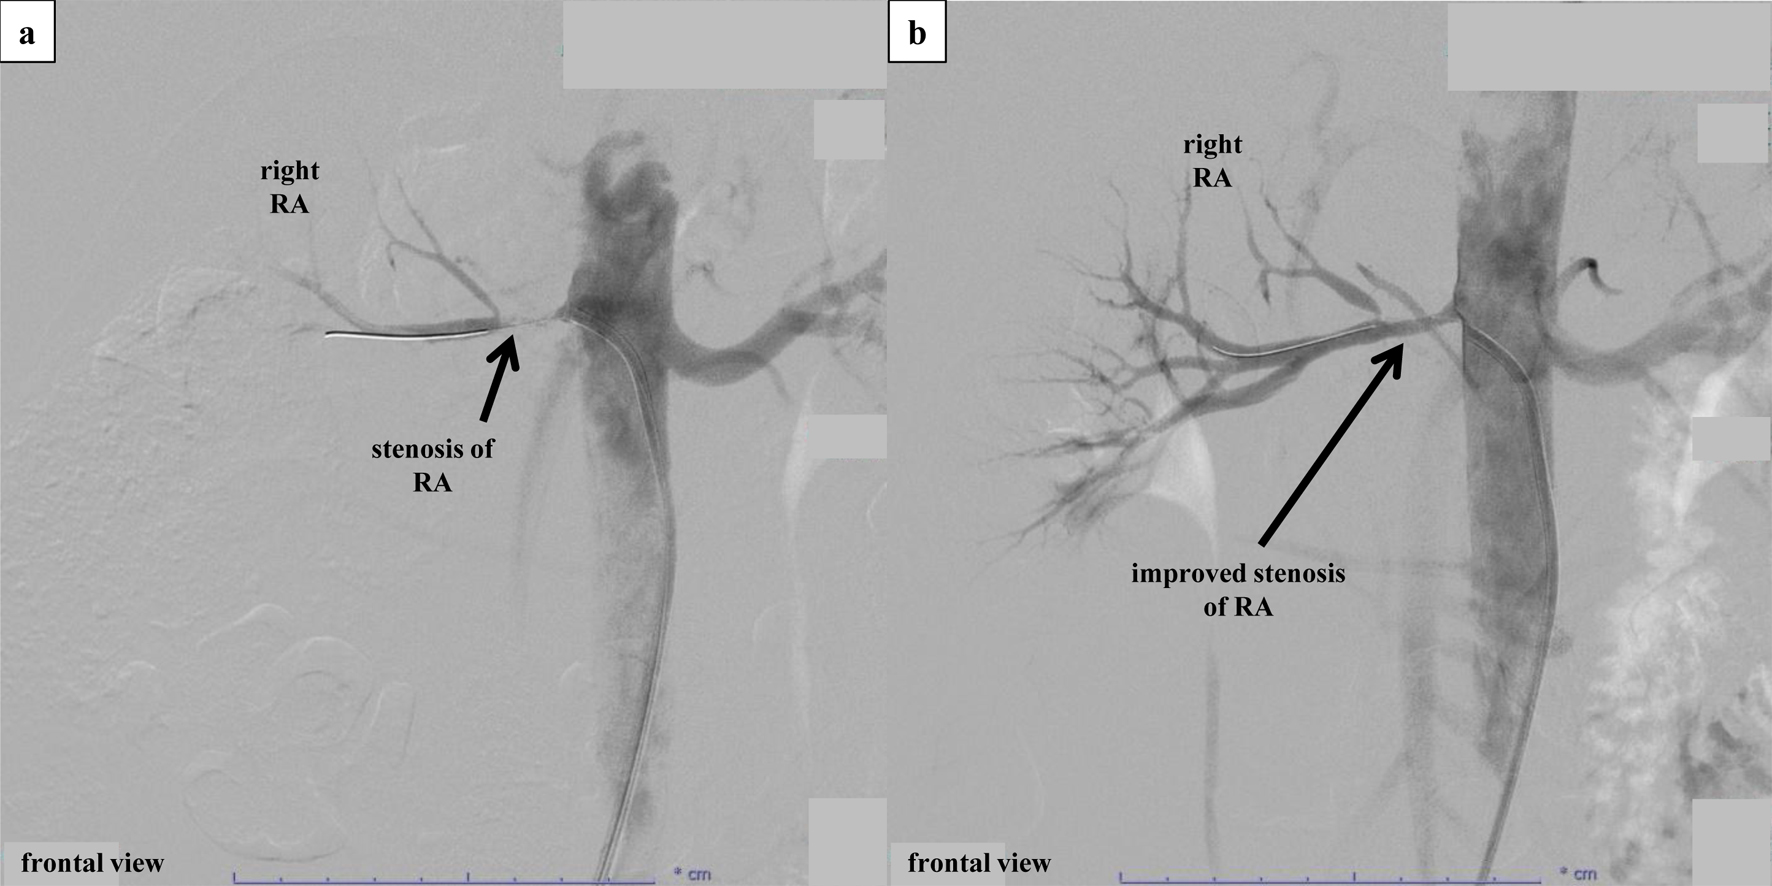
↓ Figure 2. Percutaneous selective renal
angiography and PTRA. (a) Percutaneous selective renal angiography before PTRA. Renal angiography was
performed by approaching the renal artery from the right femoral artery. After performing contrast
imaging of the left renal artery using a 6-French Mach 1® RDC1 catheter, severe stenosis
at the ostium of the right renal artery was confirmed. Subsequently, PTRA was performed at the culprit
location, and contrast imaging after insertion of an Aguru® wire (0.014 mm/180 cm)
revealed a diffuse stenosis approximately 1.5 cm from the renal artery ostium. The lesion was observed
using IVUS (Fig. 3a) before performing balloon angioplasty. After balloon angioplasty using a
Sterling® (4.0 × 15 mm) catheter, a partial dissection-like lesion was observed
while observing the culprit location via IVUS. Afterward, long inflation was performed on the entire
stenosis using an NSE PTA® (4.0 × 40 mm) catheter. However, dilation to a low
pressure of 3 atm was the limit due to the sensation of back pain in the patient. (b) Percutaneous
selective renal angiography after PTRA. Although the dissection remained visible on IVUS (Fig. 3b), the
right renal artery improved from 99% stenosis to 50% stenosis. IVUS: intravascular ultrasound; PTRA:
percutaneous transluminal renal angioplasty.
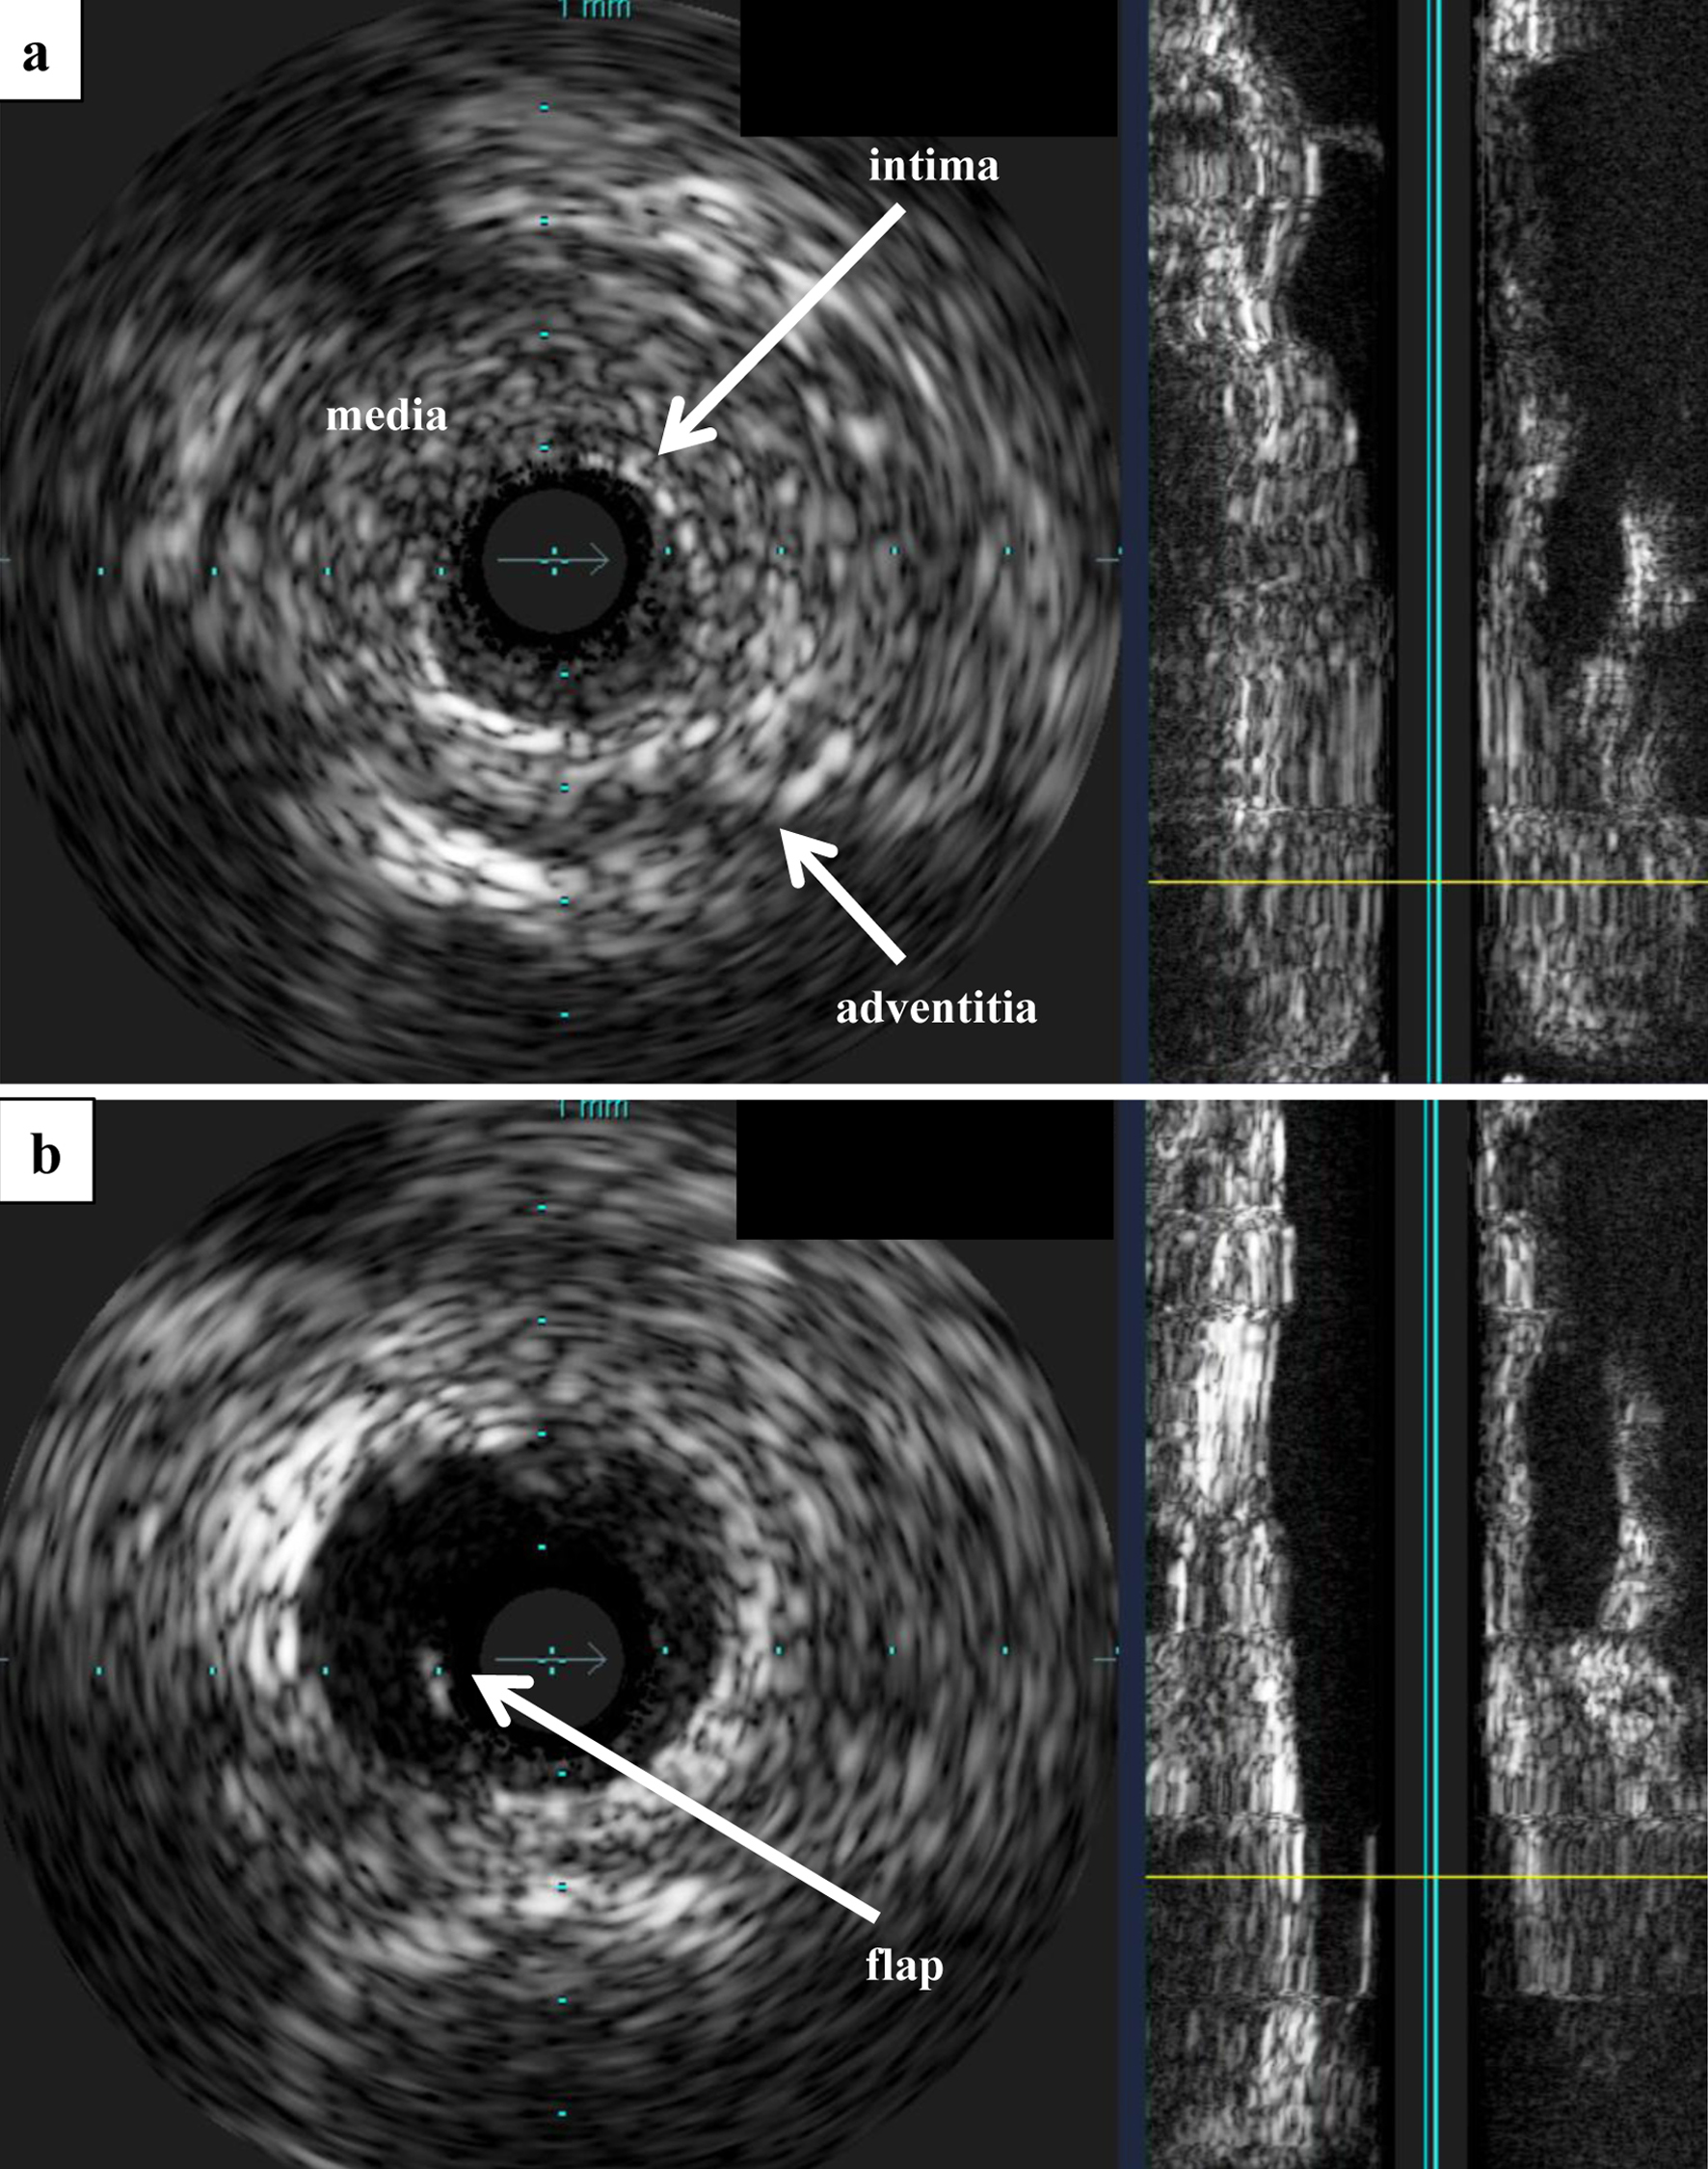
↓ Figure 3. IVUS. (a) IVUS before PTRA.
Observation of the lesion using Eagle Eye® IVUS revealed no calcification, and the
three-layered structure of the tunica intima, tunica media, and tunica adventitia was unclear and
concentrically thickened. (b) IVUS after PTRA. After balloon angioplasty, a flap that appeared to be
partially dissected was observed. IVUS: intravascular ultrasound; PTRA: percutaneous transluminal renal
angioplasty.
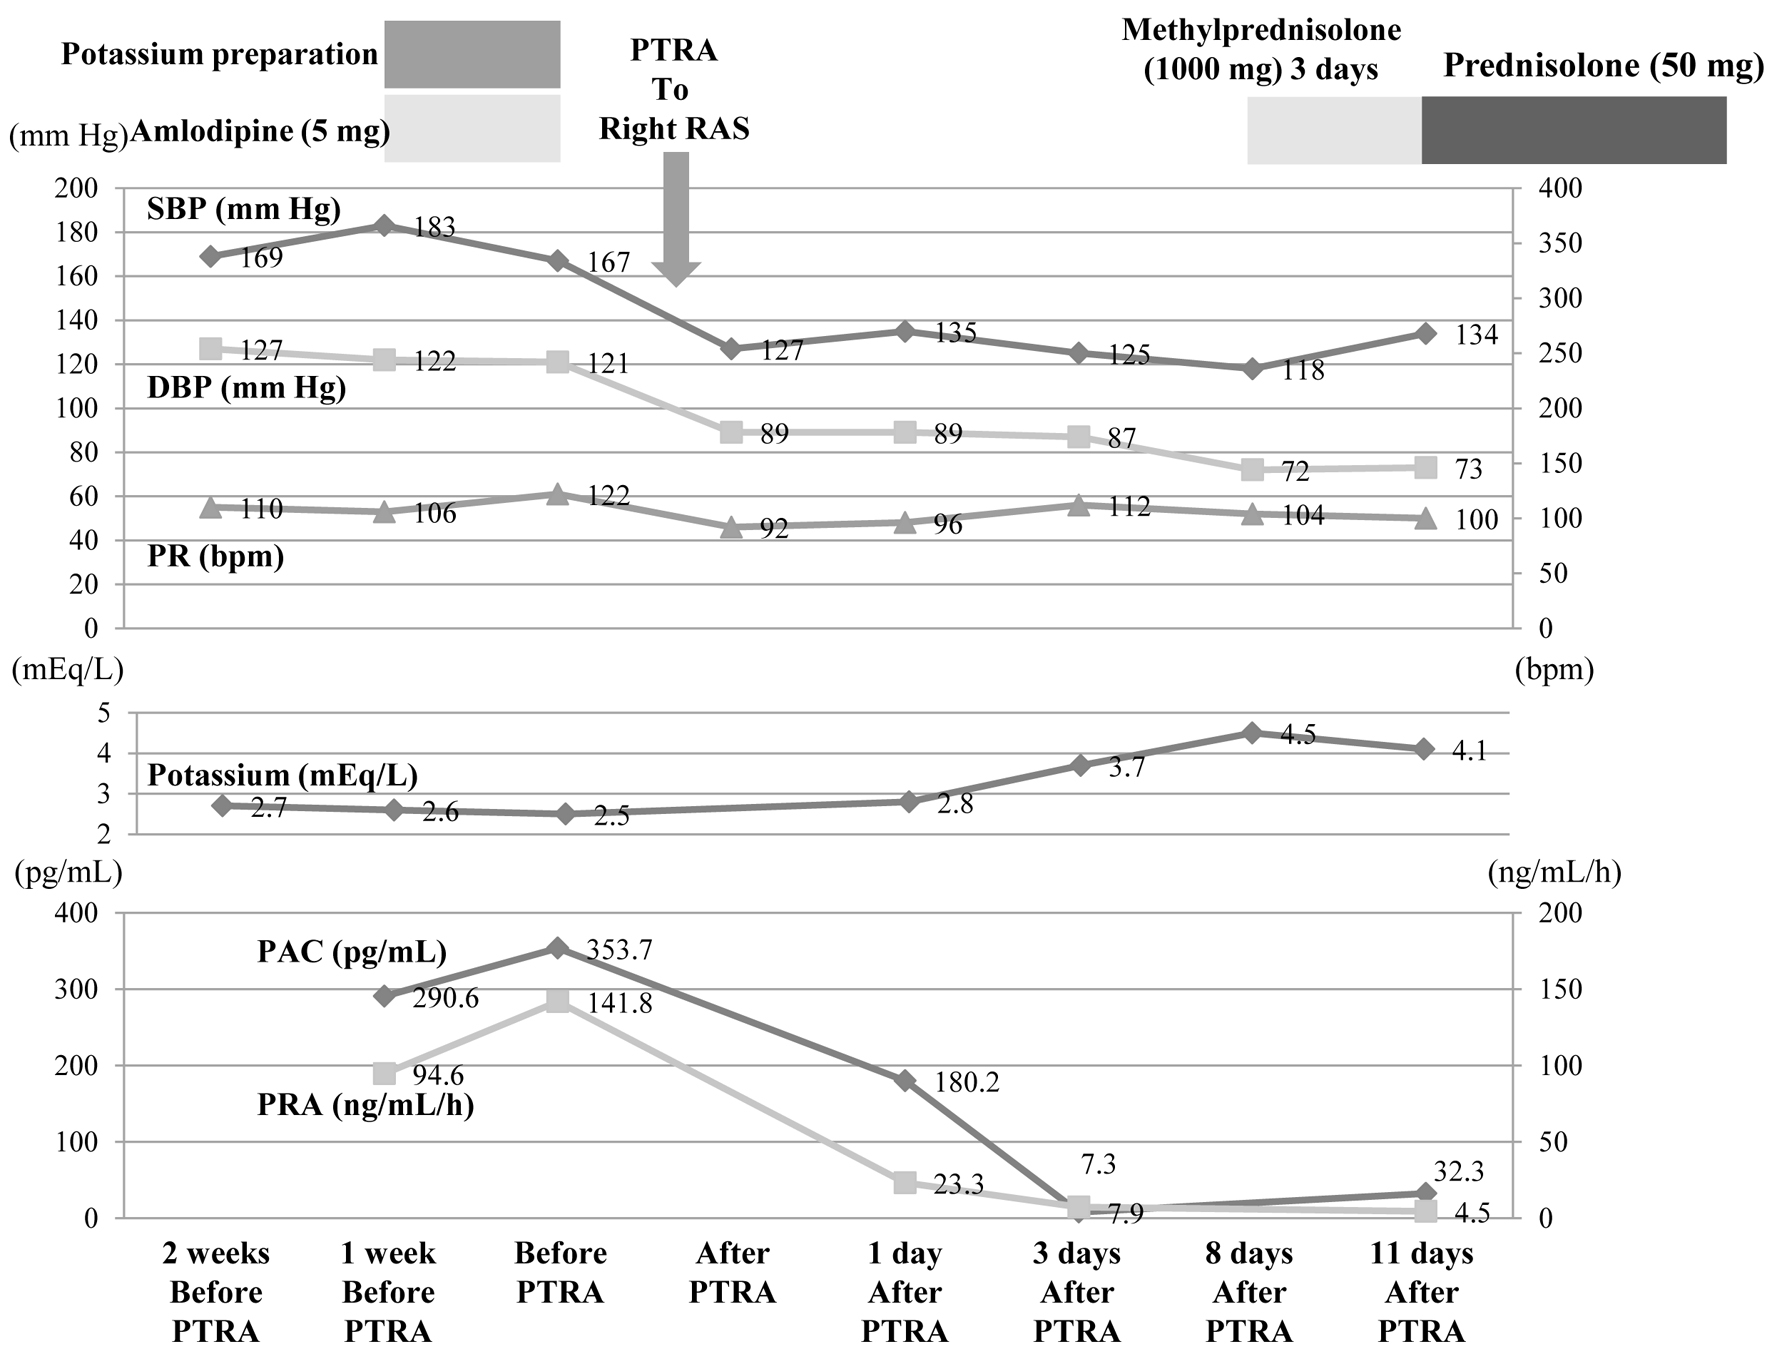
↓ Figure 4. After PTRA was performed, SBP, DBP,
PRA, and PAC decreased markedly, and potassium normalized. These changes have been maintained since
then. DBP: diastolic blood pressure; PAC: plasma aldosterone concentration; PR: pulse rate; PRA: plasma
renin activity; PTRA: percutaneous transluminal renal angioplasty; RAS: renal artery stenosis; SBP:
systolic blood pressure.
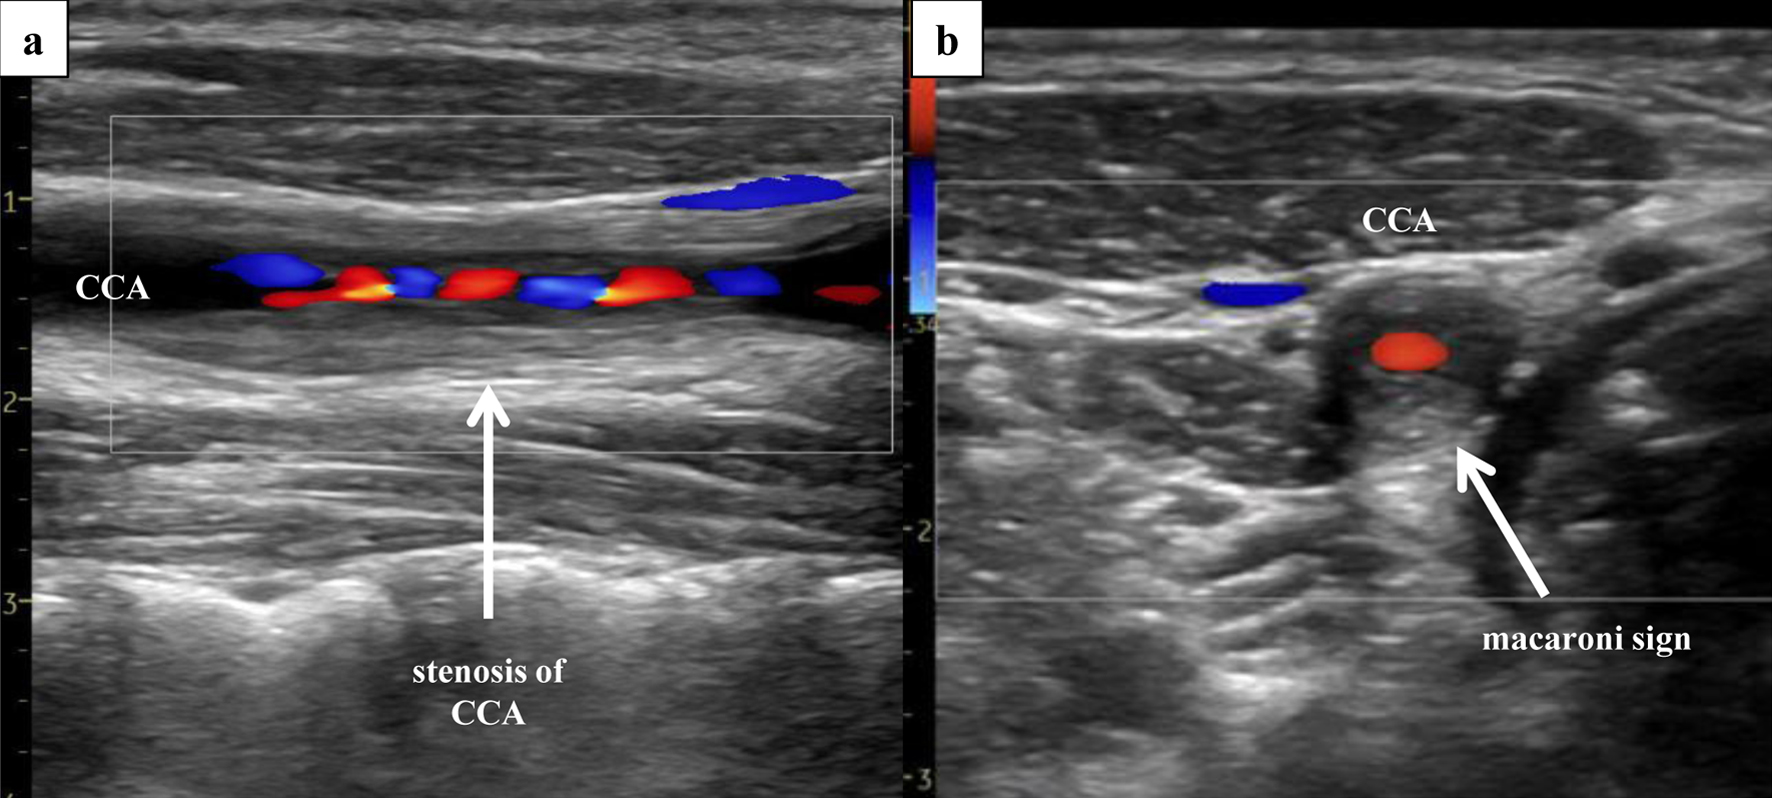
↓ Figure 5. Right ultrasonography of the CCA.
Ultrasonography of the CCA, performed 3 days after PTRA, revealed severe stenosis (area method, 97%;
NASCET method, 66%; PSV, 310 cm/s) of the right CCA, with presence of the “macaroni sign”.
(a) Sagittal section (Doppler). (b) Coronal section (Doppler). CCA: common carotid artery; PSV: peak
systolic velocity; PTRA: percutaneous transluminal renal angioplasty.
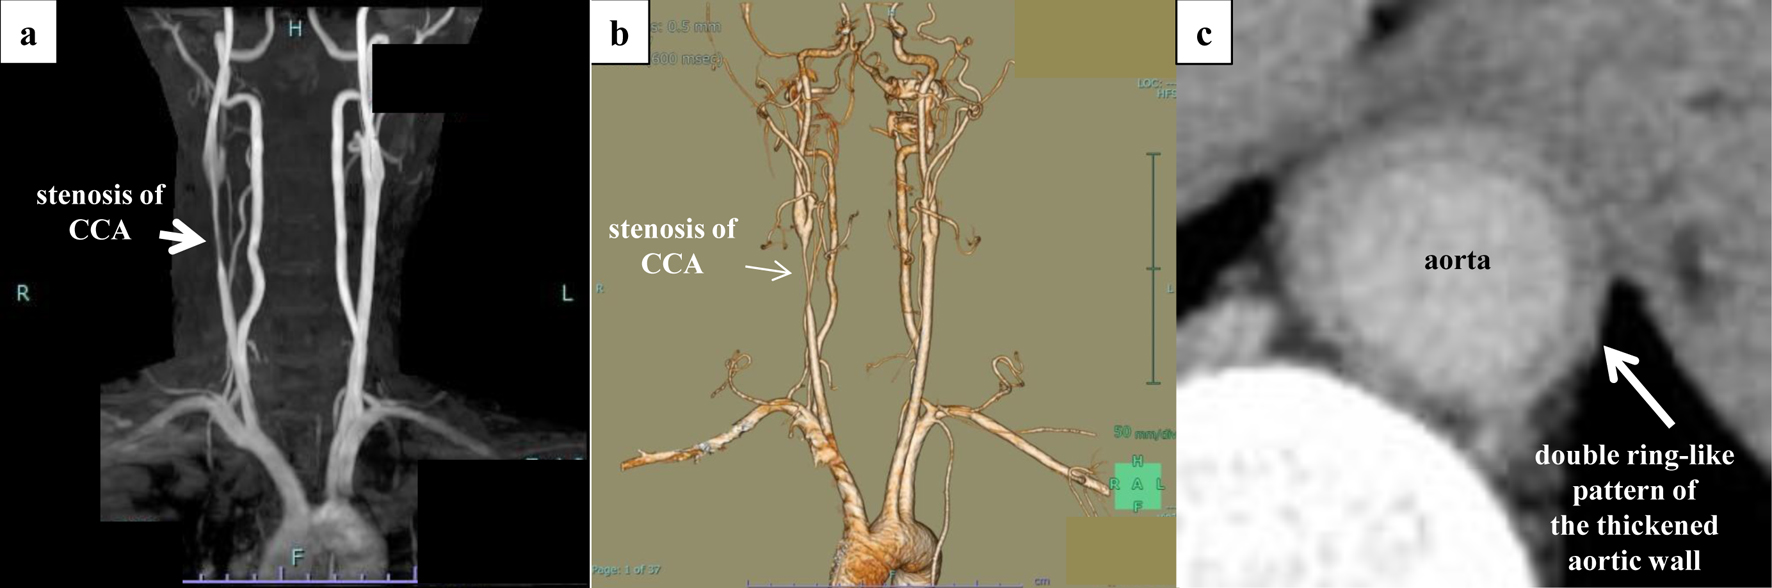
↓ Figure 6. Aortic findings on
non-contrast-enhanced MRA and contrast-enhanced CT. Severe stenosis of the right common carotid artery
and inflammation within the wall of the descending aorta were confirmed. (a) Non-contrast-enhanced MRA.
(b) Three-dimensional contrast-enhanced CT. (c) Late-phase CT shows a double ring-like pattern of the
thickened aortic wall. CT: computed tomography; MRA: magnetic resonance angiography.