Journal of Clinical Medicine Research, ISSN 1918-3003 print, 1918-3011 online, Open Access
Article copyright, the authors; Journal compilation copyright, J Clin Med Res and Elmer Press Inc
Journal website https://jocmr.elmerjournals.com

Original Article

Volume 17, Number 4, April 2025, pages 187-199


Comparative Evaluation of Risk of Death in Mechanically Ventilated Patients With COVID-19 and Influenza: A Population-Based Cohort Study

Figure

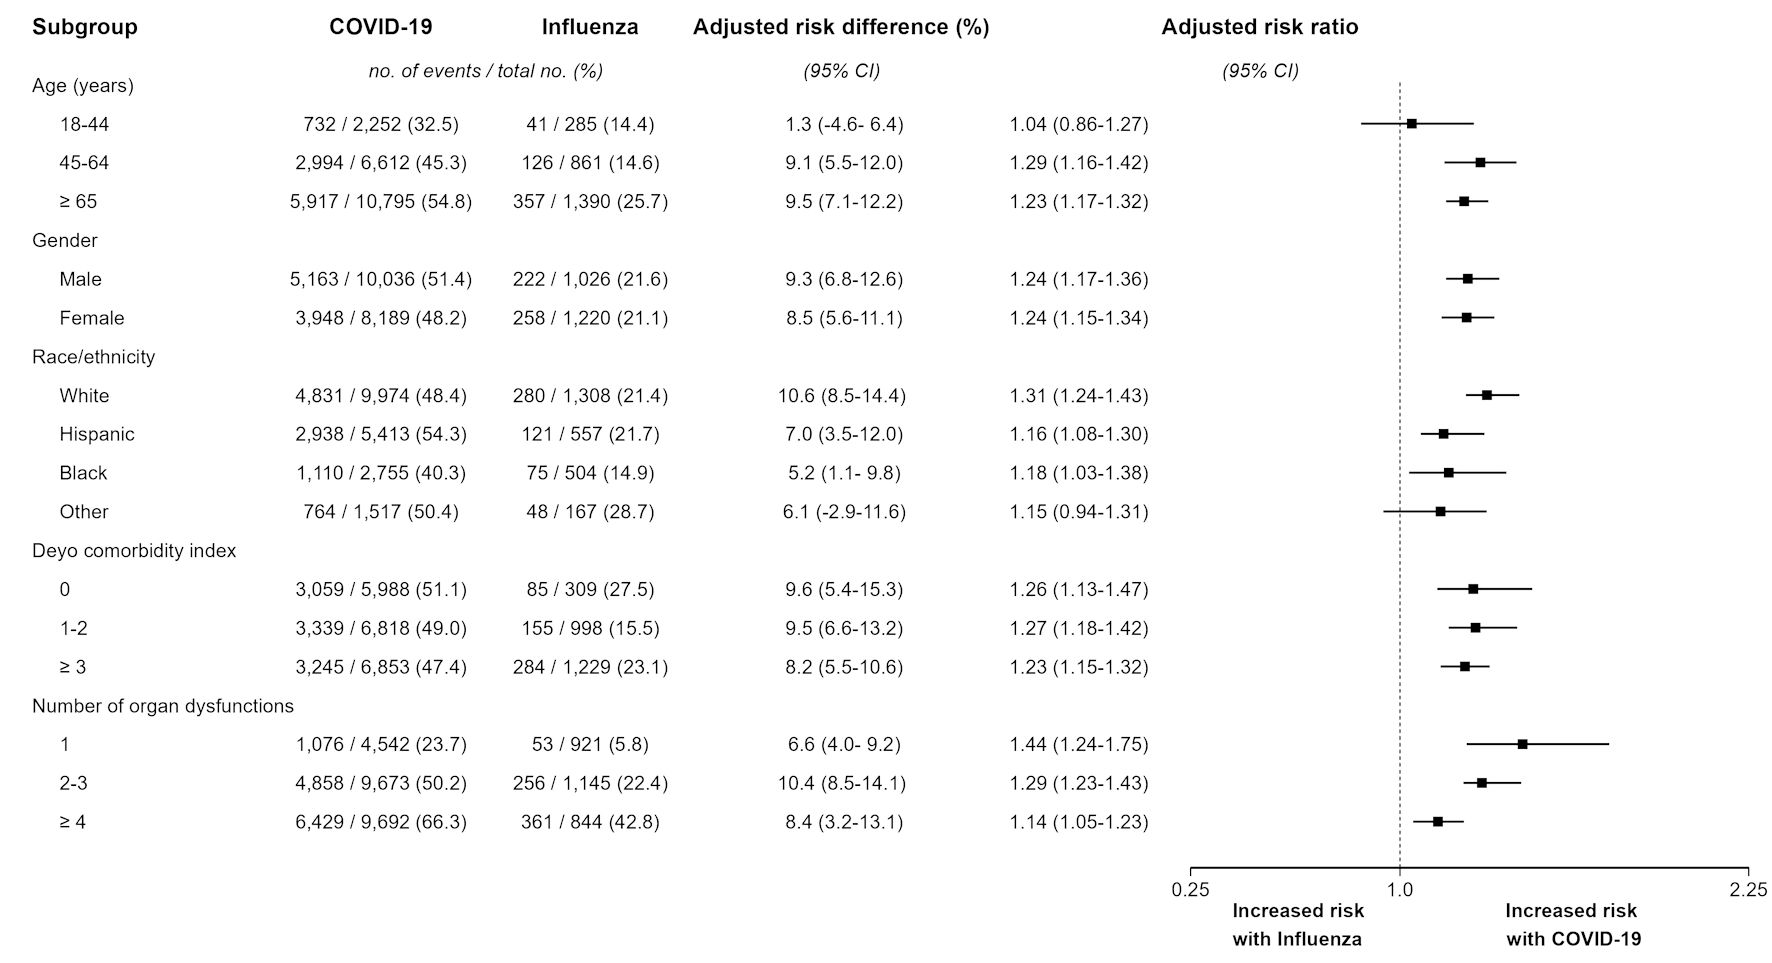
↓  Figure 1. Subgroup analysis of comparative short-term mortality among mechanically ventilated hospitalizations with COVID-19 and influenza. Analyses were conducted using overlap propensity score weighting. Adjusted risk ratio represents the risk of short-term mortality among mechanically ventilated hospitalizations with COVID-19 compared to those with influenza. Adjusted risk difference represents the absolute difference in short-term mortality among mechanically ventilated hospitalizations with COVID-19 compared to those with influenza, expressed as percentage. Non-parametric bootstrap 95% confidence intervals (CIs) were determined using 10,000 bootstrap samples and the percentile method. The width of the CIs was not adjusted for multiplicity and should not be used to infer definite effects. COVID-19: coronavirus disease 2019.
Figure 1.

Tables

↓  Table 1. The Characteristics and Outcomes of Mechanically Ventilated Hospitalizations With COVID-19 and Influenza
 
Variables COVID-19a Influenzaa P value
N = 19,659 N = 2,536
aThe parenthesized figures represent percents, except for the Deyo comorbidity index and number of organ dysfunctions; percentage figures may not add to 100 due to rounding. bThe State of Texas suppresses gender data of hospitalizations with HIV infection, alcohol use, and substance use. cMean (standard deviation). dPost-acute care facilities include long-term acute care hospitals, inpatient rehabilitation, skilled nursing facilities, and nursing homes. COVID-19: coronavirus disease 2019; HIV: human immunodeficiency virus; ECMO: extracorporeal membrane oxygenation; Do-not-resuscitate: a do-not-resuscitate state.
Age, years 0.9212
  18 - 44 2,252 (11.5) 285 (11.2)
  45 - 64 6,612 (33.6) 861 (34.0)
  ≥ 65 10,795 (54.9) 1,390 (54.8)
Gender
  Female 8,189 (41.7) 1,220 (48.1) < 0.0001
  Male 10,036 (51.1) 1,026 (40.6)
  Suppressedb 1,434 (7.3) 290 (11.4)
Race/ethnicity < 0.0001
  White 9,974 (50.7) 1,308 (51.6)
  Hispanic 5,413 (27.5) 557 (22.0)
  Black 2,755 (14.0) 504 (19.9)
  Other 1,517 (7.7) 167 (6.6)
Health insurance < 0.0001
  Private 8,597 (43.7) 1,085 (42.8)
  Medicare 6,909 (35.1) 846 (33.4)
  Medicaid 1,383 (7.0) 238 (9.4)
  Uninsured 1,688 (8.6) 297 (11.7)
  Other 869 (4.4) 57 (2.2)
  Missing 213 (1.1) 13 (0.5)
Deyo comorbidity indexc 2.04 (2.03) 2.53 (1.91) < 0.0001
Comorbid conditions
  Diabetes 8,341 (42.4) 990 (39.0) 0.0011
  Liver disease 1,125 (5.7) 136 (5.4) 0.5386
  Malignancy 1,272 (6.5) 145 (5.7) 0.1216
  Congestive heart failure 6,639 (33.8) 1,231 (48.5) < 0.0001
  Chronic lung disease 5,597 (28.5) 1,463 (57.7) < 0.0001
  Myocardial infarction 2,998 (15.3) 475 (18.7) < 0.0001
  Peripheral vascular disease 715 (3.6) 107 (4.2) 0.1304
  Dementia 1,509 (7.7) 163 (6.4) 0.0197
  Peptic ulcer disease 303 (1.5) 33 (1.3) 0.4320
  Hemiplegia/paraplegia 535 92.7) 46 (1.8) 0.0073
  HIV 99 (0.5) 18 (0.7) 0.1882
  Cerebrovascular disease 1,684 (8.6) 161 (6.3) 0.0001
  Chronic renal disease 4,994 (25.4) 588 (23.2) 0.0163
  Rheumatological disease 614 (3.1) 101 (4.0) 0.0154
  Obesity 6,605 (33.6) 781 (30.8) 0.0049
  Tobacco use 1,938 (9.9) 564 (22.2) < 0.0001
  Alcohol use 745 (3.8) 121 (4.8) 0.0145
  Substance use 767 (3.9) 176 (6.9) < 0.0001
Number of organ dysfunctionsc 2.60 (1.37) 2.13 (1.27) < 0.0001
Hemodialysis 1,493 (7.6) 114 (4.5) < 0.0001
ECMO 63 (0.3) 2 (0.07) 0.0369
Do-not-resuscitate 6,513 (33.1) 483 (19.0) < 0.0001
Palliative care 4,348 (22.1) 318 (12.5) < 0.0001
Teaching hospital 5,093 (25.9) 684 (27.0) 0.2348
Hospital admission period
  Fourth quarter 2021 5,646 (28.7) 137 (5.4) < 0.0001
  First quarter 2022 7,792 (39.6) 305 (12.0) < 0.0001
  Second quarter 2022 716 (3.6) 261 (10.3) < 0.0001
  Third quarter 2022 2,267 (11.5) 101 (4.0) < 0.0001
  Fourth quarter 2022 1,281 (6.5) 1,230 (48.5) < 0.0001
  First quarter 2023 1,957 (10.0) 502 (19.8) < 0.0001
Hospital disposition
  In- hospital mortality 7,968 (40.5) 342 (13.5) < 0.0001
  Hospice 1,675 (8.5) 182 (7.2) 0.0259
  Home 5,837 (29.7) 1,459 (57.5) < 0.0001
  Post-acute care facilityd 3,892 (19.8) 488 (19.2) 0.4749
  Leave against medical advice 287 (1.5) 65 (2.6) < 0.0001


↓  Table 2. Adjusted Analyses of the Comparative Short-Term Mortalitya Among Mechanically Ventilated Hospitalizations With COVID-19 Versus Influenza
 
Modelb aRR (95% CI)c aRDd (95% CI)c
aShort-term mortality is the composite of in-hospital death or discharge to hospice. bAll models were adjusted for patients’ sociodemographic characteristics, coexisting conditions, measures of severity of illness, organ support, use of palliative care, do-not-resuscitate status, hospitals’ teaching status, and year and calendar quarter of hospitalization. cNon-parametric bootstrap 95% CIs were determined using 10,000 bootstrap samples. dThe risk difference represents the absolute difference in risk of short-term mortality between mechanically ventilated hospitalizations with COVID-19 vs. those with influenza, expressed as percentage. COVID-19: coronavirus disease 2019; aRR: adjusted risk ratio; CI: confidence interval; aRD: adjusted risk difference.
Overlap propensity score weighting 1.24 (1.18 - 1.30) 8.8 (6.7 - 10.4)
Alternative analyses
  Entropy balance 1.25 (1.19 - 1.33) 9.3 (7.4 - 11.7)
  Hierarchical multivariable logistic regression 1.23 (1.22 - 1.34) 8.8 (8.3 - 12.0)