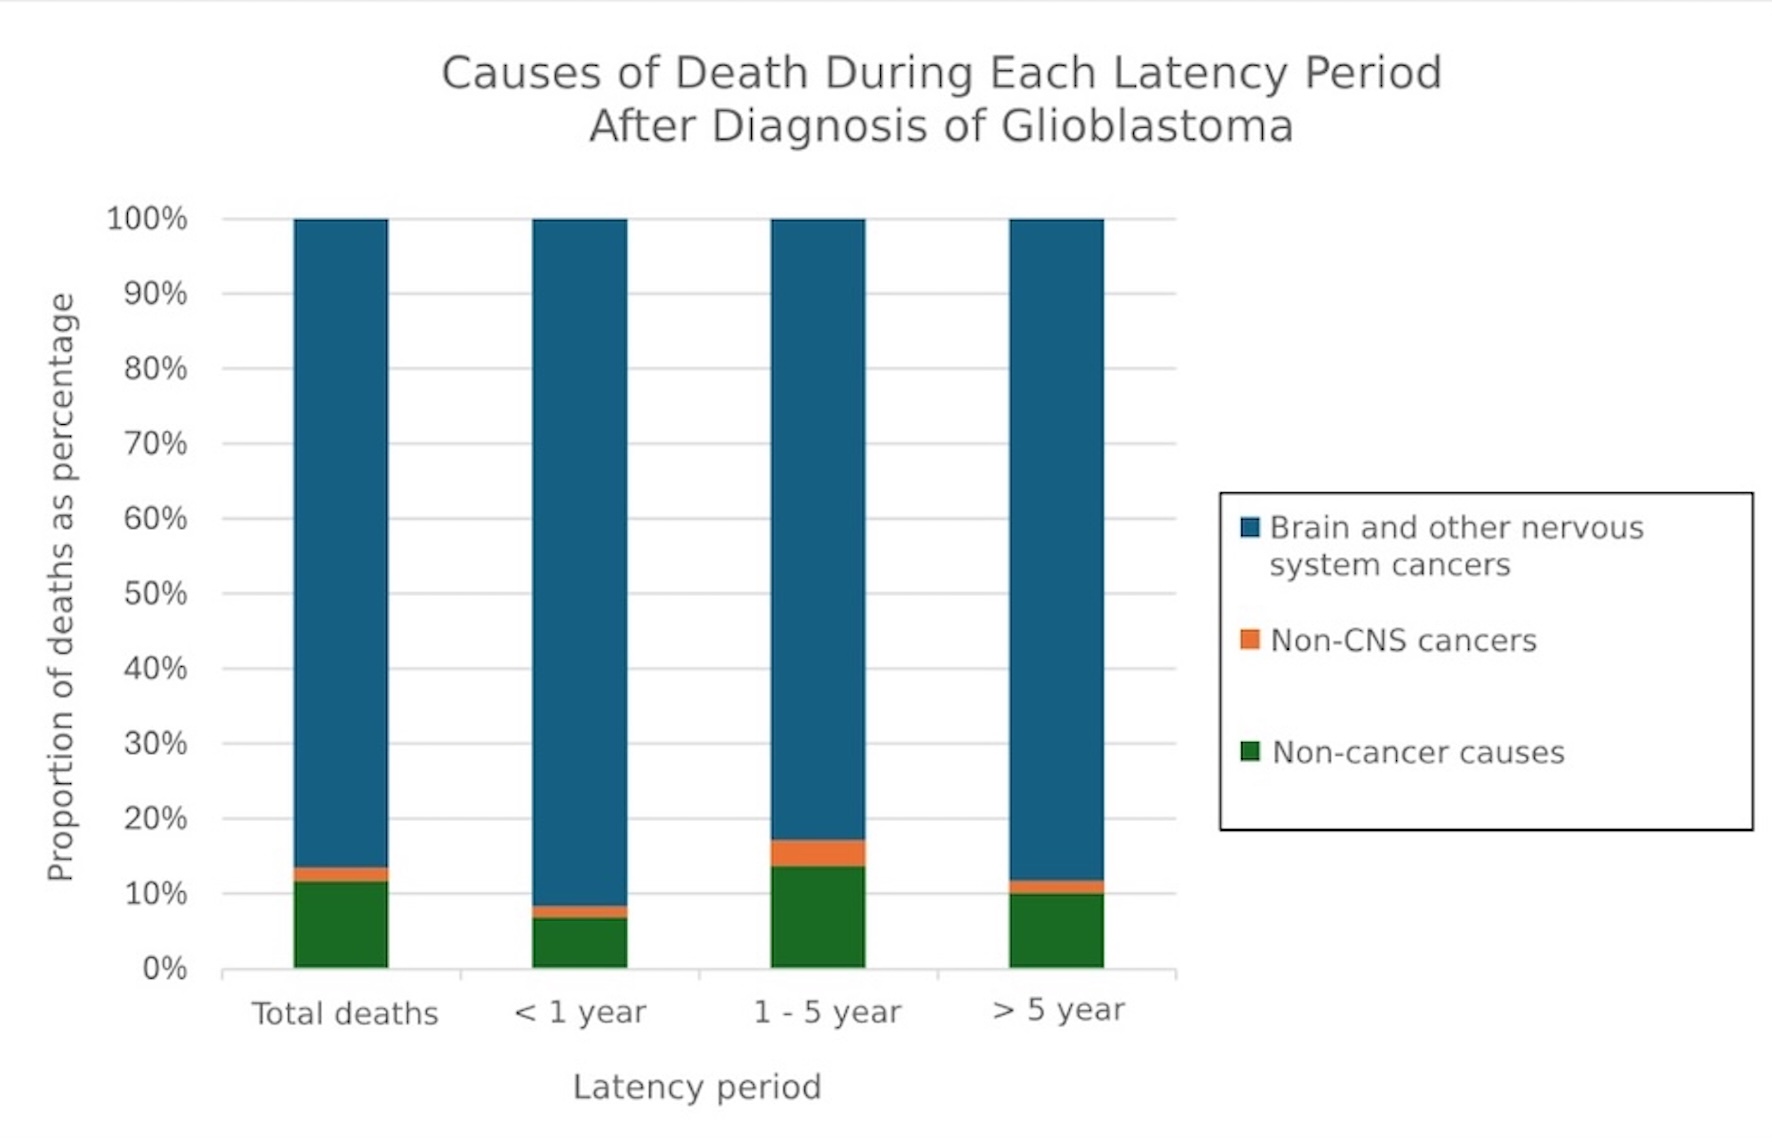
↓ Figure 1. Causes of death after glioblastoma
diagnosis graded by latency period. CNS: central nervous system.
| Journal of Clinical Medicine Research, ISSN 1918-3003 print, 1918-3011 online, Open Access |
| Article copyright, the authors; Journal compilation copyright, J Clin Med Res and Elmer Press Inc |
| Journal website https://jocmr.elmerjournals.com |
Original Article
Volume 17, Number 4, April 2025, pages 208-222
Relative, Conditional, and Overall Survival and Causes of Death in Patients With Glioblastoma: A Retrospective Longitudinal Cohort Study
Figures
Tables
| Characteristic | Diagnosed cases no. (%) | Deaths no. (%) |
|---|---|---|
| All patients | 45,071 (100) | 40,568 (90.01) |
| Sex | ||
| Male | 26,139 (58.00) | 23,591 (58.15) |
| Female | 18,932 (42.00) | 16,977 (41.85) |
| Race | ||
| White | 40,037 (88.83) | 36,237 (89.32) |
| American Indian/Alaska Native | 191 (0.42) | 165 (0.41) |
| Asian or Pacific Islander | 2,207 (4.90) | 1,857 (4.58) |
| Black | 2,505 (5.56) | 2,231 (5.50) |
| Unknown | 131 (0.29) | 78 (0.19) |
| Age at diagnosis | ||
| < 18 | 497 (1.10) | 404 (1.00) |
| 18 - 44 | 3,936 (8.73) | 3,087 (7.61) |
| 45 - 59 | 13,507 (29.97) | 11,915 (29.37) |
| 60 - 74 | 18,217 (40.42) | 16,572 (40.85) |
| > 75 | 8,914 (19.78) | 8,590 (21.17) |
| Years | No. of patients | Observed survival 95% CI (lower - upper) | Relative survival 95% CI (lower - upper) |
|---|---|---|---|
| *Significant P value less than 0.05. CI: confidence interval. | |||
| Overall | |||
| 1 year | 45,071 | 0.40 (0.396 - 0.405) | 0.41 (0.402 - 0.411) |
| 3 years | 45,071 | 0.10 (0.095 - 0.101) | 0.10 (0.099 - 0.105) |
| 5 years | 45,071 | 0.05 (0.049 - 0.054) | 0.05 (0.052 - 0.057) |
| 3 years after 1-year survival | 16,751 | 0.17 (0.163 - 0.175) | 0.17 (0.168 - 0.18) |
| 3 years after 3 years of survival | 3,499 | 0.43 (0.411 - 0.446) | 0.44 (0.422 - 0.458) |
| 3 years after 5 years of survival | 1,554 | 0.60 (0.575 - 0.627) | 0.62 (0.59 - 0.644) |
| Age < 18 | |||
| 1 year | 497 | 0.55 (0.507 - 0.596) | 0.55 (0.507 - 0.596) |
| 3 years | 497 | 0.21 (0.17 - 0.244) | 0.21 (0.17 - 0.244) |
| 5 years | 497 | 0.16 (0.125 - 0.193) | 0.16 (0.125 - 0.193) |
| 3 years after 1-year survival | 260 | 0.30 (0.246 - 0.361) | 0.30 (0.246 - 0.361) |
| 3 years after 3 years of survival | 87 | 0.73 (0.615 - 0.808) | 0.73 (0.615 - 0.809) |
| 3 years after 5 years of survival | 59 | 0.84 (0.698 - 0.916) | 0.84 (0.699 - 0.916) |
| Age 18 - 44 | |||
| 1 year | 3,936 | 0.71 (0.699 - 0.728) | 0.72 (0.7 - 0.729) |
| 3 years | 3,936 | 0.30 (0.285 - 0.316) | 0.30 (0.287 - 0.317) |
| 5 years | 3,936 | 0.19 (0.179 - 0.207) | 0.20* (0.181 - 0.209) |
| 3 years after 1-year survival | 2,616 | 0.33 (0.312 - 0.35) | 0.33* (0.313 - 0.351) |
| 3 years after 3 years of survival | 953 | 0.55 (0.517 - 0.584) | 0.56* (0.52 - 0.588) |
| 3 years after 5 years of survival | 522 | 0.67 (0.629 - 0.715) | 0.68* (0.633 - 0.719) |
| Age 45 - 59 | |||
| 1 year | 13,507 | 0.55 (0.545 - 0.562) | 0.56 (0.548 - 0.565) |
| 3 years | 13,507 | 0.13 (0.124 - 0.136) | 0.13 (0.126 - 0.139) |
| 5 years | 13,507 | 0.07 (0.06 - 0.069) | 0.07 (0.062 - 0.072) |
| 3 years after 1-year survival | 6,979 | 0.16 (0.146 - 0.164) | 0.16 (0.149 - 0.167) |
| 3 years after 3 years of survival | 1,420 | 0.41 (0.382 - 0.436) | 0.42 (0.39 - 0.445) |
| 3 years after 5 years of survival | 608 | 0.59 (0.544 - 0.628) | 0.60 (0.556 - 0.642) |
| Age 60 - 74 | |||
| 1 year | 18,217 | 0.35 (0.345 - 0.359) | 0.36 (0.35 - 0.365) |
| 3 years | 18,217 | 0.07 (0.063 - 0.071) | 0.07 (0.066 - 0.075) |
| 5 years | 18,217 | 0.03 (0.027 - 0.033) | 0.03 (0.029 - 0.035) |
| 3 years after 1-year survival | 5,893 | 0.12 (0.113 - 0.131) | 0.13 (0.119 - 0.138) |
| 3 years after 3 years of survival | 932 | 0.32 (0.284 - 0.35) | 0.34 (0.301 - 0.37) |
| 3 years after 5 years of survival | 332 | 0.49 (0.43 - 0.547) | 0.52 (0.458 - 0.582) |
| Age > 75 | |||
| 1 year | 8,914 | 0.12 (0.115 - 0.129) | 0.13 (0.121 - 0.136) |
| 3 years | 8,914 | 0.02 (0.013 - 0.019) | 0.02 (0.016 - 0.022) |
| 5 years | 8,914 | 0.01 (0.004 - 0.008) | 0.01* (0.006 - 0.011) |
| 3 years after 1-year survival | 1,003 | 0.07 (0.056 - 0.091) | 0.09 (0.066 - 0.108) |
| 3 years after 3 years of survival | 107 | 0.27 (0.185 - 0.368) | 0.33* (0.223 - 0.446) |
| 3 years after 5 years of survival | 33 | 0.39 (0.215 - 0.558) | 0.48* (0.253 - 0.67) |
| Univariate | Multivariate | |||
|---|---|---|---|---|
| Coefficients 95% CI (lower - upper) | P value | Coefficients 95% CI (lower - upper) | P value | |
| CI: confidence interval. | ||||
| Age | ||||
| 60 - 74 | Reference | |||
| < 18 | 0.51 (0.46 - 0.57) | 0 | 0.52 (0.47 - 0.57) | 0 |
| 18 - 44 | 0.42 (0.4 - 0.43) | 0 | 0.42 (0.4 - 0.44) | 0 |
| 45 - 59 | 0.67 (0.65 - 0.69) | 0 | 0.67 (0.65 - 0.68) | 0 |
| ≥ 75 | 2.09 (2.04 - 2.15) | 0 | 2.1 (2.05 - 2.16) | 0 |
| Race | ||||
| White | Reference | |||
| American Indian/Alaska Native | 0.85 (0.73 - 1) | 0.044 | 0.98 (0.84 - 1.14) | 0.75 |
| Asian or Pacific Islander | 0.81 (0.78 - 0.85) | 0 | 0.86 (0.82 - 0.9) | 0 |
| Black | 0.93 (0.89 - 0.97) | 0.001 | 1.03 (0.98 - 1.07) | 0.24 |
| Unknown | 0.7 (0.56 - 0.87) | 0.002 | 0.83 (0.66 - 1.03) | 0.1 |
| Sex | ||||
| Male | Reference | |||
| Female | 1.02 (1 - 1.04) | 0.05 | 0.95 (0.94 - 0.97) | 0 |
| Deaths by time after diagnosis | Total deaths | |||||||
|---|---|---|---|---|---|---|---|---|
| < 1 year | 1 - 5 years | > 5 years | ||||||
| Observed no. (%) | SMR (95% CI) | Observed no. (%) | SMR (95% CI) | Observed no. (%) | SMR (95% CI) | Observed no. (%) | SMR (95% CI) | |
| *Significant. CI: confidence interval; CNS: central nervous system; COD: cause of death; SMR: standardized mortality ratio. | ||||||||
| All CODs | 25,235 (100) | 55.64* (54.96 - 56.34) | 13,910 (100) | 63.85* (62.8 - 64.92) | 792 (100) | 13.76* (12.81 - 14.75) | 39,937 (100) | 54.79* (54.25 - 55.33) |
| Brain and other nervous system | 21,833 (86.52) | 7,018.98* (6,926.19 - 7,112.72) | 12,746 (91.63) | 6,981.68* (6,861 - 7,103.96) | 656 (82.83) | 1,389.83* (1,285.49 - 1,500.38) | 35,235 (88.23) | 6,515.11* (6,447.26 - 6,583.5) |
| Non-CNS cancers | 427 (1.69) | 3.56* (3.23 - 3.91) | 203 (1.46) | 3.31* (2.87 - 3.79) | 27 (3.41) | 1.78* (1.17 - 2.58) | 657 (1.65) | 3.34* (3.09 - 3.61) |
| Tongue | 1 | 1.93 (0.05 - 10.73) | 0 | 0 (0 - 12.4) | 0 | 0 (0 - 48.7) | 1 | 1.12 (0.03 - 6.24) |
| Oropharynx | 1 | 4.8 (0.12 - 26.73) | 0 | 0 (0 - 29.72) | 0 | 0 (0 - 112.46) | 1 | 2.74 (0.07 - 15.25) |
| Other oral cavity and pharynx | 1 | 2.62 (0.07 - 14.58) | 0 | 0 (0 - 17.86) | 0 | 0 (0 - 77.66) | 1 | 1.57 (0.04 - 8.76) |
| Small intestine | 6 | 22.13* (8.12 - 48.16) | 0 | 0 (0 - 25.48) | 1 | 26.24 (0.66 - 146.2) | 7 | 15.42* (6.2 - 31.77) |
| Colon excluding rectum | 9 | 1.03 (0.47 - 1.96) | 9 | 2.12 (0.97 - 4.02) | 4 | 3.83* (1.04 - 9.81) | 22 | 1.57 (0.98 - 2.38) |
| Rectum and rectosigmoid junction | 2 | 0.98 (0.12 - 3.55) | 1 | 0.9 (0.02 - 5.04) | 1 | 3.54 (0.09 - 19.72) | 4 | 1.17 (0.32 - 2.99) |
| Intrahepatic bile duct | 1 | 0.9 (0.02 - 5.03) | 0 | 0 (0 - 5.79) | 1 | 5.62 (0.14 - 31.3) | 2 | 1.04 (0.13 - 3.76) |
| Gallbladder | 2 | 4.96 (0.6 - 17.9) | 0 | 0 (0 - 17.6) | 0 | 0 (0 - 67.97) | 2 | 3 (0.36 - 10.82) |
| Pancreas | 6 | 0.73 (0.27 - 1.6) | 4 | 0.92 (0.25 - 2.35) | 0 | 0 (0 - 3.26) | 10 | 0.73 (0.35 - 1.35) |
| Lung and bronchus | 38 | 1.05 (0.74 - 1.44) | 15 | 0.82 (0.46 - 1.35) | 4 | 0.93 (0.25 - 2.39) | 57 | 0.97 (0.73 - 1.25) |
| Bones and joints | 2 | 9.16* (1.11 - 33.07) | 2 | 16.18* (1.96 - 58.44) | 0 | 0 (0 - 109.53) | 4 | 10.65* (2.9 - 27.26) |
| Soft tissue including heart | 7 | 8.69* (3.49 - 17.91) | 0 | 0 (0 - 8.01) | 0 | 0 (0 - 30.18) | 7 | 5.04* (2.03 - 10.39) |
| Melanoma of the skin | 3 | 1.56 (0.32 - 4.56) | 1 | 0.97 (0.02 - 5.41) | 0 | 0 (0 - 14.89) | 4 | 1.25 (0.34 - 3.2) |
| Other non-epithelial skin | 2 | 2.85 (0.35 - 10.29) | 0 | 0 (0 - 10.6) | 0 | 0 (0 - 40.35) | 2 | 1.75 (0.21 - 6.33) |
| Breast | 17 | 2.67* (1.55 - 4.27) | 8 | 2.17 (0.94 - 4.28) | 0 | 0 (0 - 3.62) | 25 | 2.26* (1.46 - 3.33) |
| Uterus | 1 | 1.37 (0.03 - 7.63) | 0 | 0 (0 - 8.59) | 0 | 0 (0 - 29.31) | 1 | 0.78 (0.02 - 4.34) |
| Ovary | 6 | 2.48 (0.91 - 5.39) | 2 | 1.47 (0.18 - 5.31) | 1 | 2.74 (0.07 - 15.27) | 9 | 2.17 (0.99 - 4.12) |
| Prostate | 3 | 0.46 (0.1 - 1.35) | 1 | 0.38 (0.01 - 2.1) | 2 | 3.22 (0.39 - 11.61) | 6 | 0.61 (0.23 - 1.34) |
| Urinary bladder | 1 | 0.31 (0.01 - 1.73) | 3 | 2.06 (0.42 - 6.02) | 0 | 0 (0 - 10.07) | 4 | 0.79 (0.22 - 2.03) |
| Kidney and renal pelvis | 3 | 0.98 (0.2 - 2.87) | 2 | 1.25 (0.15 - 4.52) | 0 | 0 (0 - 9.47) | 5 | 0.99 (0.32 - 2.31) |
| Other endocrine including thymus | 8 | 52.24* (22.55 - 102.93) | 9 | 98.41* (45 - 186.81) | 0 | 0 (0 - 153.39) | 17 | 63.28* (36.86 - 101.32) |
| Non-Hodgkin lymphoma | 6 | 1.37 (0.5 - 2.98) | 1 | 0.49 (0.01 - 2.7) | 0 | 0 (0 - 7.37) | 7 | 1.01 (0.41 - 2.08) |
| Myeloma | 1 | 0.41 (0.01 - 2.31) | 1 | 0.85 (0.02 - 4.72) | 0 | 0 (0 - 12.46) | 2 | 0.51 (0.06 - 1.86) |
| Acute myeloid leukemia | 1 | 0.5 (0.01 - 2.78) | 0 | 0 (0 - 3.55) | 0 | 0 (0 - 13.95) | 1 | 0.3 (0.01 - 1.68) |
| Chronic myeloid leukemia | 1 | 4.59 (0.12 - 25.56) | 0 | 0 (0 - 37.18) | 0 | 0 (0 - 148.59) | 1 | 2.92 (0.07 - 16.29) |
| Other myeloid/monocytic leukemia | 1 | 5.88 (0.15 - 32.74) | 1 | 12.29 (0.31 - 68.47) | 0 | 0 (0 - 170.42) | 2 | 7.32 (0.89 - 26.44) |
| Miscellaneous malignant cancer | 297 | 32.48* (28.89 - 36.39) | 138 | 30.30* (25.46-35.8) | 11 | 9.76* (4.87 - 17.47) | 446 | 30.09* (27.36 - 33.01) |
| Deaths by time after diagnosis | Total deaths | |||||||
|---|---|---|---|---|---|---|---|---|
| < 1 year | 1 - 5 years | > 5 years | ||||||
| Observed no. (%) | SMR (95% CI) | Observed no. (%) | SMR (95% CI) | Observed no. (%) | SMR (95% CI) | Observed no. (%) | SMR (95% CI) | |
| *Significant. CI: confidence interval; COD: cause of death; HIV: human immunodeficiency virus; no.: number of glioblastoma patients who died due to each cause of death; SMR: standardized mortality ratio. | ||||||||
| All CODs | 25,235 (100) | 55.64* (54.96 - 56.34) | 13,910 (100) | 63.85* (62.8 - 64.92) | 792 (100) | 13.76* (12.81 - 14.75) | 39,937 (100) | 54.79* (54.25 - 55.33) |
| Brain and other nervous system | 21,833 (86.52) | 7,018.98* (6,926.19 - 7,112.72) | 12,746 (91.63) | 6,981.68* (6,861 - 7,103.96) | 656 (82.83) | 1,389.83* (1,285.49 - 1,500.38) | 35,235 (88.23) | 6,515.11* (6,447.26 - 6,583.5) |
| Non-CNS cancers | 427 (1.69) | 3.56* (3.23 - 3.91) | 203 (1.46) | 3.31* (2.87 - 3.79) | 27 (3.41) | 1.78* (1.17 - 2.58) | 657 (1.65) | 3.34* (3.09 - 3.61) |
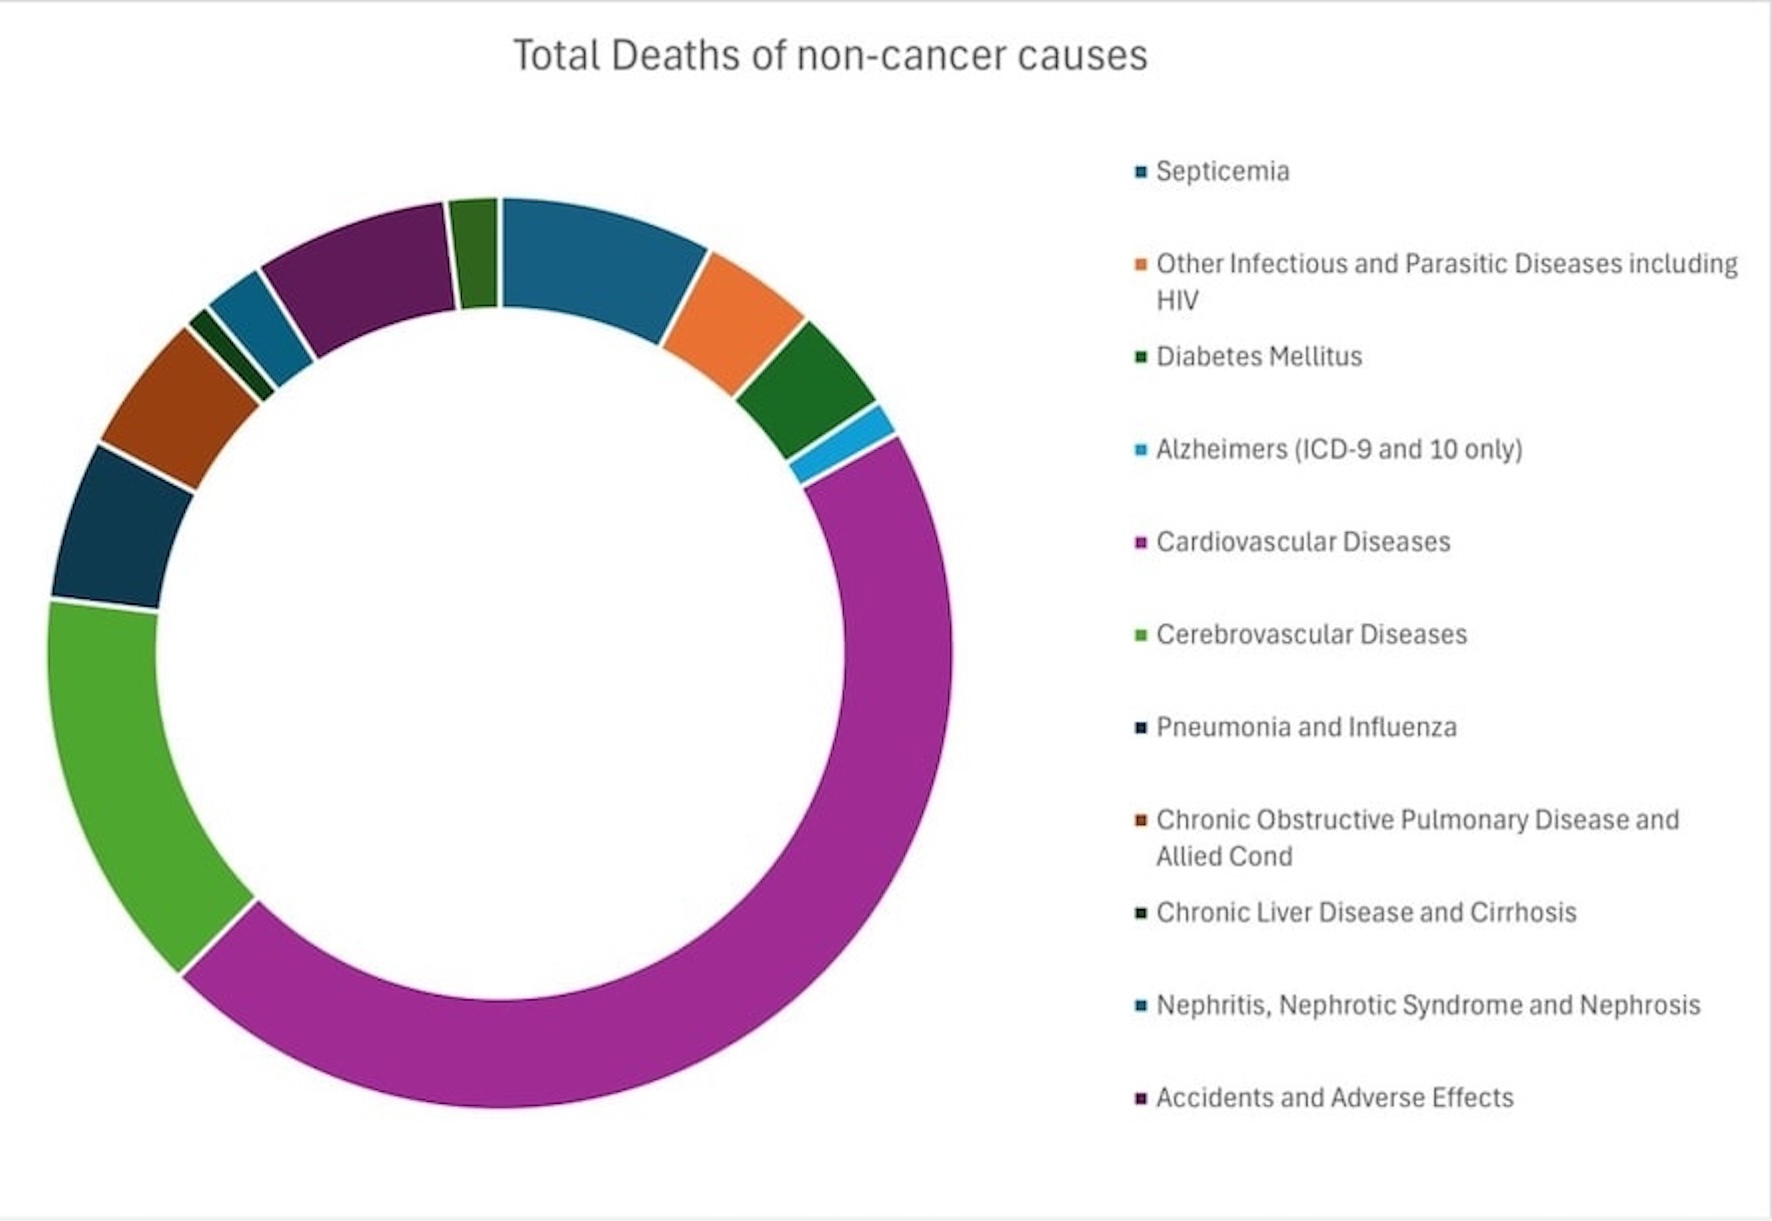
| Non-cancer causes | 2,975 (11.79) | 9.00* (8.68 - 9.33) | 961 (6.91) | 6.21* (5.83 - 6.62) | 109 (13.76) | 2.60* (2.14 - 3.14) | 4,045 (10.13) | 7.68* (7.44 - 7.92) |
| Septicemia | 65 (0.26) | 9.94* (7.67 - 12.67) | 26 (0.19) | 8.13* (5.31 - 11.91) | 4 (0.51) | 4.67* (1.27 - 11.95) | 95 (0.24) | 8.97* (7.26 - 10.96) |
| Other infectious and parasitic diseases, including HIV | 35 (0.14) | 7.26* (5.06 - 10.09) | 14 (0.10) | 4.86* (2.66 - 8.15) | 4 (0.13) | 1.41 (0.04 - 7.84) | 50 (0.13) | 5.94* (4.41 - 7.83) |
| Diabetes mellitus | 37 (0.15) | 2.49* (1.76 - 3.44) | 6 (0.04) | 0.8 (0.29 - 1.73) | 3 (0.38) | 1.54 (0.32 - 4.51) | 46 (0.12) | 1.89* (1.39 - 2.52) |
| Alzheimer’s (ICD-9 and 10 only) | 13 (0.5) | 1.15 (0.61 - 1.96) | 3 (0.02) | 0.79 (0.16 - 2.32) | 1 (0.13) | 0.78 (0.02 - 4.34) | 17 (0.04) | 1.04 (0.6 - 1.66) |
| Cardiovascular diseases | 427 (1.69) | 3.47* (3.15 - 3.81) | 120 (0.86) | 2.22* (1.84 - 2.65) | 22 (2.78) | 1.57 (0.98 - 2.38) | 569 (1.42) | 2.97* (2.73 - 3.23) |
| Cerebrovascular diseases | 133 (0.53) | 5.77* (4.83 - 6.84) | 37 (0.27) | 3.92* (2.76 - 5.41) | 9 (1.14) | 3.56* (1.63 - 6.76) | 179 (0.45) | 5.11* (4.39 - 5.92) |
| Pneumonia and influenza | 50 (0.20) | 5.51* (4.09 - 7.26) | 16 (0.12) | 4.35* (2.48 - 7.06) | 4 (0.51) | 4.02* (1.09 - 10.29) | 70 (0.18) | 5.09* (3.97 - 6.43) |
| Chronic obstructive pulmonary disease and allied conditions | 50 (0.20) | 1.73* (1.29 - 2.29) | 10 (0.07) | 0.75 (0.36 - 1.39) | 3 (0.38) | 0.86 (0.18 - 2.51) | 63 (0.16) | 1.38* (1.06 - 1.77) |
| Chronic liver disease and cirrhosis | 9 (0.4) | 1.23 (0.56 - 2.33) | 1 (0.01) | 0.21 (0.01 - 1.17) | 0 (0) | 0 (0 - 2.9) | 10 (0.03) | 0.75 (0.36 - 1.38) |
| Nephritis, nephrotic syndrome and nephrosis | 23 (0.9) | 2.83* (1.8 - 4.25) | 3 (0.02) | 0.82 (0.17 - 2.38) | 2 (0.25) | 2.03 (0.25 - 7.33) | 28 (0.07) | 2.19* (1.46 - 3.17) |
| Accidents and adverse effects | 48 (0.19) | 2.91* (2.15 - 3.86) | 32 (0.23) | 3.05* (2.09 - 4.3) | 6 (0.76) | 1.95 (0.72 - 4.24) | 86 (0.22) | 2.86* (2.29 - 3.54) |
| Suicide and self-inflicted injury | 18 (0.07) | 3.33* (1.98 - 5.27) | 5 (0.04) | 1.3 (0.42 - 3.03) | 2 (0.25) | 1.84 (0.22 - 6.66) | 25 (0.06) | 2.42* (1.57 - 3.57) |
| Other COD | 2,067 (8.19) | 28.93* (27.7 - 30.2) | 688 (4.95) | 20.28* (18.79 - 21.85) | 52 (6.57) | 5.39* (4.03 - 7.07) | 2,807 (7.03) | 24.40* (23.51 - 25.32) |
| Deaths by time after diagnosis | Total deaths | |||||||
|---|---|---|---|---|---|---|---|---|
| < 1 year | 1 - 5 years | > 5 years | ||||||
| Observed no. | SMR (95% CI) | Observed no. | SMR (95% CI) | Observed no. | SMR (95% CI) | Observed no. | SMR (95% CI) | |
| *Significant. CNS: central nervous system; CI: confidence interval; COD: cause of death; SMR: standardized mortality ratio. | ||||||||
| All CODs | 199 | 1,078.06* (933.47 - 1,238.7) | 178 | 719.51* (617.69 - 833.32) | 10 | 80.32* (38.52 - 147.71) | 387 | 695.44* (627.87 - 768.3) |
| Brain and other nervous system | 175 | 69,250.02* (59,369.76 - 80,304.56) | 162 | 59,108.81* (50,357.04 - 68,944.38) | 8 | 3,776.22* (1,630.3 - 7,440.66) | 345 | 46,708.06* (41,908.84 - 51,906.22) |
| Non-CNS cancers | 2 | 298.42* (36.14 - 1,077.98) | 1 | 124.72* (3.16 - 694.91) | 1 | 149.49* (3.78 - 832.9) | 4 | 186.83* (50.91 - 478.37) |
| Non-cancer causes | 22 | 125.45* (78.62 - 189.94) | 15 | 63.39* (35.48 - 104.55) | 1 | 8.64 (0.22 - 48.16) | 38 | 72.01* (50.96 - 98.84) |
| Other COD | 22 | 204.81* (128.36 - 310.09) | 14 | 96.30* (52.65 - 161.58) | 1 | 28.39 (0.72 - 158.17) | 37 | 128.47* (90.45 - 177.07) |
| Deaths by time after diagnosis | Total deaths | |||||||
|---|---|---|---|---|---|---|---|---|
| < 1 year | 1 - 5 years | > 5 years | ||||||
| Observed no. | SMR (95% CI) | Observed no. | SMR (95% CI) | Observed no. | SMR (95% CI) | Observed no. | SMR (95% CI) | |
| Significant P value less than 0.05. CI: confidence interval; CNS: central nervous system; COD: cause of death; HIV: human immunodeficiency virus; SMR: standardized mortality ratio. | ||||||||
| All CODs | 1,018 | 178.09* (167.31 - 189.37) | 1,759 | 201.55* (192.24 - 211.19) | 231 | 35.24* (30.84 - 40.09) | 3,008 | 143.24* (138.17 - 148.45) |
| Brain and other nervous system | 892 | 13,968.74* (13,066.97 - 14,916.35) | 1,624 | 16,662.90* (15,862.25 - 17,493.49) | 202 | 2,606.53* (2,259.46 - 2,991.84) | 2,718 | 11,381.13* (10,957.24 - 11,817.21) |
| Non-CNS cancers | 15 | 19.95* (11.17 - 32.91) | 27 | 21.37* (14.08 - 31.09) | 7 | 5.44* (2.19 - 11.2) | 49 | 14.83* (10.97 - 19.61) |
| Non-cancer causes | 111 | 22.65* (18.63 - 27.28) | 108 | 14.66* (12.03 - 17.7) | 22 | 4.24* (2.66 - 6.42) | 241 | 13.80* (12.12 - 15.66) |
| Septicemia | 1 | 19.06 (0.48 - 106.22) | 2 | 23.20* (2.81 - 83.8) | 0 | 0 (0 - 47.55) | 3 | 13.87* (2.86 - 40.54) |
| Other infectious and parasitic diseases, including HIV | 2 | 9.96* (1.21 - 35.99) | 0 | 0 (0 - 13.99) | 0 | 0 (0 - 26.11) | 2 | 3.3 (0.4 - 11.93) |
| Diabetes mellitus | 0 | 0 (0 - 28.35) | 1 | 4.67 (0.12 - 26.04) | 0 | 0 (0 - 18.48) | 1 | 1.84 (0.05 - 10.25) |
| Cardiovascular diseases | 2 | 2.38 (0.29 - 8.6) | 8 | 5.88* (2.54 - 11.58) | 1 | 0.82 (0.02 - 4.54) | 11 | 3.21* (1.6 - 5.74) |
| Cerebrovascular diseases | 3 | 24.52* (5.06 - 71.67) | 2 | 10.21* (1.24 - 36.89) | 5 | 30.17* (9.8 - 70.4) | 10 | 20.67* (9.91 - 38) |
| Pneumonia and influenza | 1 | 16.59 (0.42 - 92.42) | 3 | 31.62* (6.52 - 92.41) | 0 | 0 (0 - 47.06) | 4 | 17.13* (4.67 - 43.85) |
| Chronic obstructive pulmonary disease and allied conditions | 0 | 0 (0 - 70.67) | 1 | 10.7 (0.27 - 59.64) | 0 | 0 (0 - 27.75) | 1 | 3.59 (0.09 - 20) |
| Chronic liver disease and cirrhosis | 1 | 5.03 (0.13 - 28) | 0 | 0 (0 - 11.21) | 0 | 0 (0 - 11.9) | 1 | 1.19 (0.03 - 6.65) |
| Nephritis, nephrotic syndrome and nephrosis | 1 | 23.18 (0.59 - 129.17) | 1 | 14.1 (0.36 - 78.56) | 0 | 0 (0 - 57.98) | 2 | 11.26* (1.36 - 40.66) |
| Accidents and adverse effects | 2 | 1.37 (0.17 - 4.93) | 4 | 1.88 (0.51 - 4.81) | 4 | 3.35 (0.91 - 8.58) | 10 | 2.09* (1 - 3.84) |
| Suicide and self-inflicted Injury | 1 | 1.7 (0.04 - 9.46) | 0 | 0 (0 - 4.34) | 1 | 2.07 (0.05 - 11.54) | 2 | 1.04 (0.13 - 3.76) |
| Other COD | 97 | 84.69* (68.68 - 103.31) | 86 | 51.26* (41 - 63.3) | 11 | 9.86* (4.92 - 17.64) | 194 | 49.25* (42.57 - 56.69) |
| Deaths by time after diagnosis | Total deaths | |||||||
|---|---|---|---|---|---|---|---|---|
| < 1 year | 1 - 5 years | > 5 years | ||||||
| Observed no. | SMR (95% CI) | Observed no. | SMR (95% CI) | Observed no. | SMR (95% CI) | Observed no. | SMR (95% CI) | |
| *Significant P value less than 0.05. CI: confidence interval; CNS: central nervous system; COD: cause of death; SMR: standardized mortality ratio. | ||||||||
| All CODs | 5,514 | 91.06* (88.67 - 93.49) | 5,854 | 105.85* (103.16 - 108.6) | 338 | 16.37* (14.67 - 18.21) | 11,706 | 85.75* (84.2 - 87.32) |
| Brain and other nervous system | 4,908 | 6,990.19* (6,795.98 - 7,188.54) | 5,398 | 8,538.69* (8,312.41 - 8,769.57) | 282 | 1,296.23* (1,149.34 - 1,456.69) | 10,588 | 6,822.78* (6,693.43 - 6,953.99) |
| Non-CNS cancers | 87 | 5.04* (4.04 - 6.22) | 82 | 5.03* (4 - 6.24) | 12 | 1.86 (0.96 - 3.26) | 181 | 4.52* (3.89 - 5.23) |
| Non-cancer causes | 519 | 12.18* (11.16 - 13.28) | 374 | 9.75* (8.79 - 10.79) | 44 | 3.14* (2.28 - 4.22) | 937 | 9.87* (9.25 - 10.52) |
| Septicemia | 12 | 15.12* (7.81 - 26.4) | 10 | 13.09* (6.28 - 24.07) | 2 | 6.3 (0.76 - 22.74) | 24 | 12.80* (8.2 - 19.04) |
| Other infectious and parasitic diseases including HIV | 10 | 6.59* (3.16 - 12.12) | 9 | 7.19* (3.29 - 13.66) | 1 | 2.92 (0.07 - 16.27) | 20 | 6.43* (3.93 - 9.93) |
| Diabetes mellitus | 4 | 1.87 (0.51 - 4.78) | 1 | 0.5 (0.01 - 2.77) | 2 | 2.48 (0.3 - 8.95) | 7 | 1.41 (0.57 - 2.91) |
| Cardiovascular diseases | 61 | 4.25* (3.25 - 5.46) | 46 | 3.55* (2.6 - 4.74) | 9 | 1.84 (0.84 - 3.49) | 116 | 3.60* (2.98 - 4.32) |
| Cerebrovascular diseases | 35 | 18.64* (12.98 - 25.92) | 14 | 8.00* (4.37 - 13.43) | 2 | 2.74 (0.33 - 9.88) | 51 | 11.70* (8.71 - 15.39) |
| Pneumonia and influenza | 6 | 8.22* (3.02 - 17.9) | 3 | 4.31 (0.89 - 12.61) | 2 | 6.85 (0.83 - 24.75) | 11 | 6.41* (3.2 - 11.46) |
| Chronic obstructive pulmonary disease and allied conditions | 5 | 2.45 (0.79 - 5.71) | 2 | 0.93 (0.11 - 3.37) | 1 | 0.91 (0.02 - 5.07) | 8 | 1.51 (0.65 - 2.98) |
| Chronic liver disease and cirrhosis | 2 | 0.76 (0.09 - 2.74) | 1 | 0.44 (0.01 - 2.43) | 0 | 0 (0 - 5.54) | 3 | 0.54 (0.11 - 1.57) |
| Nephritis, nephrotic syndrome and nephrosis | 4 | 5.51 (1.5 - 14.1) | 2 | 2.83 (0.34 - 10.22) | 0 | 0 (0 - 11.46) | 6 | 3.42* (1.25 - 7.44) |
| Accidents and adverse effects | 8 | 1.61 (0.7 - 3.18) | 13 | 3.15* (1.68 - 5.39) | 1 | 0.95 (0.02 - 5.29) | 22 | 2.17* (1.36 - 3.28) |
| Suicide and self-inflicted injury | 5 | 2.3 (0.75 - 5.37) | 0 | 0 (0 - 2.08) | 1 | 2.38 (0.06 - 13.26) | 6 | 1.37 (0.5 - 2.99) |
| Other COD | 367 | 42.86* (38.59 - 47.48) | 273 | 35.01* (30.98 - 39.42) | 23 | 7.81* (4.95 - 11.72) | 663 | 34.34* (31.78 - 37.06) |
| Deaths by time after diagnosis | Total deaths | |||||||
|---|---|---|---|---|---|---|---|---|
| < 1 year | 1 - 5 years | > 5 years | ||||||
| Observed no. | SMR (95% CI) | Observed no. | SMR (95% CI) | Observed no. | SMR (95% CI) | Observed no. | SMR (95% CI) | |
| *Significant P value less than 0.05. CI: confidence interval; CNS: central nervous system; COD: cause of death; SMR: standardized mortality ratio. | ||||||||
| All CODs | 10,980 | 59.65* (58.54 - 60.78) | 5,168 | 48.97* (47.65 - 50.33) | 190 | 8.41* (7.26 - 9.7) | 16,338 | 52.34* (51.54 - 53.14) |
| Brain and other nervous system | 9,612 | 5,860.12* (5,743.54 - 5,978.46) | 4,723 | 5,127.27* (4,982.08 - 5,275.63) | 150 | 943.46* (798.52 - 1,107.1) | 14,485 | 5,324.62* (5,238.26 - 5,412.05) |
| Non-CNS cancers | 179 | 2.96* (2.54 - 3.42) | 75 | 2.21* (1.74 - 2.77) | 7 | 1.1 (0.44 - 2.26) | 261 | 2.59* (2.28 - 2.92) |
| Non-cancer causes | 1,189 | 9.76* (9.21 - 10.33) | 370 | 5.24* (4.72 - 5.8) | 33 | 2.06 (1.41 - 2.89) | 1,592 | 7.63* (7.26 - 8.02) |
| Septicemia | 31 | 11.24* (7.64 - 15.95) | 12 | 7.32* (3.78 - 12.78) | 2 | 5.56 (0.67 - 20.08) | 45 | 9.46* (6.9 - 12.65) |
| Other infectious and parasitic diseases, including HIV | 14 | 7.59* (4.15 - 12.73) | 4 | 3.80* (1.04 - 9.74) | 0 | 0 (0 - 20.24) | 18 | 5.85* (3.47 - 9.24) |
| Diabetes mellitus | 17 | 2.43* (1.42 - 3.9) | 3 | 0.76 (0.16 - 2.21) | 1 | 1.3 (0.03 - 7.24) | 21 | 1.79* (1.11 - 2.74) |
| Alzheimer (ICD-9 and 10 only) | 4 | 2.29 (0.62 - 5.86) | 0 | 0 (0 - 2.81) | 1 | 1.57 (0.04 - 8.75) | 5 | 1.35 (0.44 - 3.16) |
| Cardiovascular diseases | 180 | 3.85* (3.31 - 4.46) | 44 | 1.70* (1.23 - 2.28) | 7 | 1.27 (0.51 - 2.62) | 231 | 2.95* (2.59 - 3.36) |
| Cerebrovascular diseases | 46 | 6.04* (4.42 - 8.05) | 17 | 3.82* (2.22 - 6.11) | 2 | 1.8 (0.22 - 6.5) | 65 | 4.93* (3.8 - 6.28) |
| Pneumonia and influenza | 20 | 7.06* (4.31 - 10.91) | 7 | 4.15* (1.67 - 8.56) | 2 | 4.88 (0.59 - 17.63) | 29 | 5.89* (3.94 - 8.45) |
| Chronic obstructive pulmonary disease and allied conditions | 22 | 1.70* (1.06 - 2.57) | 6 | 0.78 (0.29 - 1.69) | 2 | 1.1 (0.13 - 3.98) | 30 | 1.33 (0.9 - 1.9) |
| Chronic liver disease and cirrhosis | 4 | 1.15 (0.31 - 2.95) | 0 | 0 (0 - 1.95) | 0 | 0 (0 - 13.37) | 4 | 0.71 (0.19 - 1.82) |
| Nephritis, nephrotic syndrome and nephrosis | 9 | 2.88* (1.32 - 5.47) | 0 | 0 (0 - 1.97) | 1 | 2.28 (0.06 - 12.7) | 10 | 1.84 (0.88 - 3.38) |
| Accidents and adverse effects | 24 | 4.55* (2.92 - 6.78) | 14 | 4.64* (2.54 - 7.79) | 1 | 1.72 (0.04 - 9.6) | 39 | 4.40* (3.13 - 6.01) |
| Suicide and self-inflicted injury | 11 | 5.65* (2.82 - 10.11) | 4 | 3.82* (1.04 - 9.78) | 0 | 0 (0 - 25.31) | 15 | 4.78* (2.67 - 7.88) |
| Other COD | 807 | 32.84* (30.61 - 35.18) | 259 | 17.19* (15.16 - 19.42) | 14 | 3.66* (2 - 6.13) | 1,080 | 24.85* (23.39 - 26.37) |
| Deaths by time after diagnosis | Total deaths | |||||||
|---|---|---|---|---|---|---|---|---|
| < 1 year | 1 - 5 years | > 5 years | ||||||
| Observed no. | SMR (95% CI) | Observed no. | SMR (95% CI) | Observed no. | SMR (95% CI) | Observed no. | SMR (95% CI) | |
| *Significant P value less than 0.05. CI: confidence interval; CNS: central nervous system; COD: cause of death; no.: number of glioblastoma patients who died due to each cause of death; SMR: standardized mortality ratio. | ||||||||
| All CODs | 7,524 | 37.07* (36.23 - 37.92) | 951 | 19.80 (18.56 - 21.1) | 23 | 3.00* (1.9 - 4.51) | 8,498 | 32.85* (32.16 - 33.56) |
| Brain and other nervous system | 6,246 | 8,899.80* (8,680.44 - 9,123.31) | 839 | 4,875.13* (4,550.79 - 5,216.48) | 14 | 883.76* (483.16 - 1,482.79) | 7,099 | 7,978.62* (7,794.09 - 8,166.42) |
| Non-CNS cancers | 144 | 3.48* (2.93 - 4.09) | 18 | 1.82* (1.08 - 2.88) | 0 | 0 (0 - 3.34) | 162 | 3.09* (2.64 - 3.61) |
| Non-cancer causes | 1,134 | 7.05* (6.64 - 7.47) | 94 | 2.47* (2 - 3.03) | 9 | 1.38 (0.63 - 2.61) | 1,237 | 6.02* (5.69 - 6.37) |
| Septicemia | 21 | 7.17* (4.44 - 10.96) | 2 | 2.83 (0.34 - 10.21) | 0 | 0 (0 - 36.47) | 23 | 6.15* (3.9 - 9.23) |
| Other infectious and parasitic diseases, including HIV | 9 | 7.16* (3.27 - 13.59) | 1 | 3.18 (0.08 - 17.74) | 0 | 0 (0 - 83.7) | 10 | 6.19* (2.97 - 11.39) |
| Diabetes mellitus | 16 | 2.87* (1.64 - 4.66) | 1 | 0.75 (0.02 - 4.18) | 0 | 0 (0 - 22.31) | 17 | 2.40* (1.4 - 3.85) |
| Alzheimer (ICD-9 and 10 only) | 9 | 0.95 (0.43 - 1.8) | 3 | 1.27 (0.26 - 3.7) | 0 | 0 (0 - 6.8) | 12 | 0.97 (0.5 - 1.69) |
| Cardiovascular diseases | 184 | 3.00* (2.59 - 3.47) | 22 | 1.58 (0.99 - 2.4) | 5 | 2.09 (0.68 - 4.88) | 211 | 2.72* (2.37 - 3.11) |
| Cerebrovascular diseases | 49 | 3.65 (2.7 - 4.82) | 4 | 1.32 (0.36 - 3.38) | 0 | 0 (0 - 7.12) | 53 | 3.12* (2.34 - 4.08) |
| Pneumonia and influenza | 23 | 4.21* (2.67 - 6.32) | 2 | 1.66 (0.2 - 6.01) | 0 | 0 (0 - 17.23) | 25 | 3.64* (2.35 - 5.37) |
| Chronic obstructive pulmonary disease and allied conditions | 23 | 1.67* (1.06 - 2.51) | 1 | 0.3 (0.01 - 1.69) | 0 | 0 (0 - 8.38) | 24 | 1.37 (0.88 - 2.04) |
| Chronic liver disease and cirrhosis | 2 | 1.98 (0.24 - 7.14) | 0 | 0 (0 - 14.91) | 0 | 0 (0 - 179.64) | 2 | 1.56 (0.19 - 5.64) |
| Nephritis, nephrotic syndrome and nephrosis | 9 | 2.13 (0.98 - 4.05) | 0 | 0 (0 - 3.6) | 1 | 6.22 (0.16 - 34.64) | 10 | 1.85 (0.89 - 3.4) |
| Accidents and adverse effects | 14 | 2.96* (1.62 - 4.96) | 1 | 0.86 (0.02 - 4.78) | 0 | 0 (0 - 18.45) | 15 | 2.46* (1.38 - 4.06) |
| Suicide and self-inflicted injury | 1 | 1.47 (0.04 - 8.19) | 1 | 6.07 (0.15 - 33.82) | 0 | 0 (0 - 227.31) | 2 | 2.32 (0.28 - 8.39) |
| Other COD | 774 | 20.89 (19.44 - 22.41) | 56 | 6.06* (4.57 - 7.86) | 3 | 1.74 (0.36 - 5.1) | 833 | 17.34* (16.19 - 18.56) |