Journal of Clinical Medicine Research, ISSN 1918-3003 print, 1918-3011 online, Open Access
Article copyright, the authors; Journal compilation copyright, J Clin Med Res and Elmer Press Inc
Journal website https://jocmr.elmerjournals.com

Original Article

Volume 17, Number 4, April 2025, pages 231-239


Phenotypic Variability and Hematological Characterization of β0- and β+-Thalassemia Carriers: A Comparative Study

Figures

Figure 1.
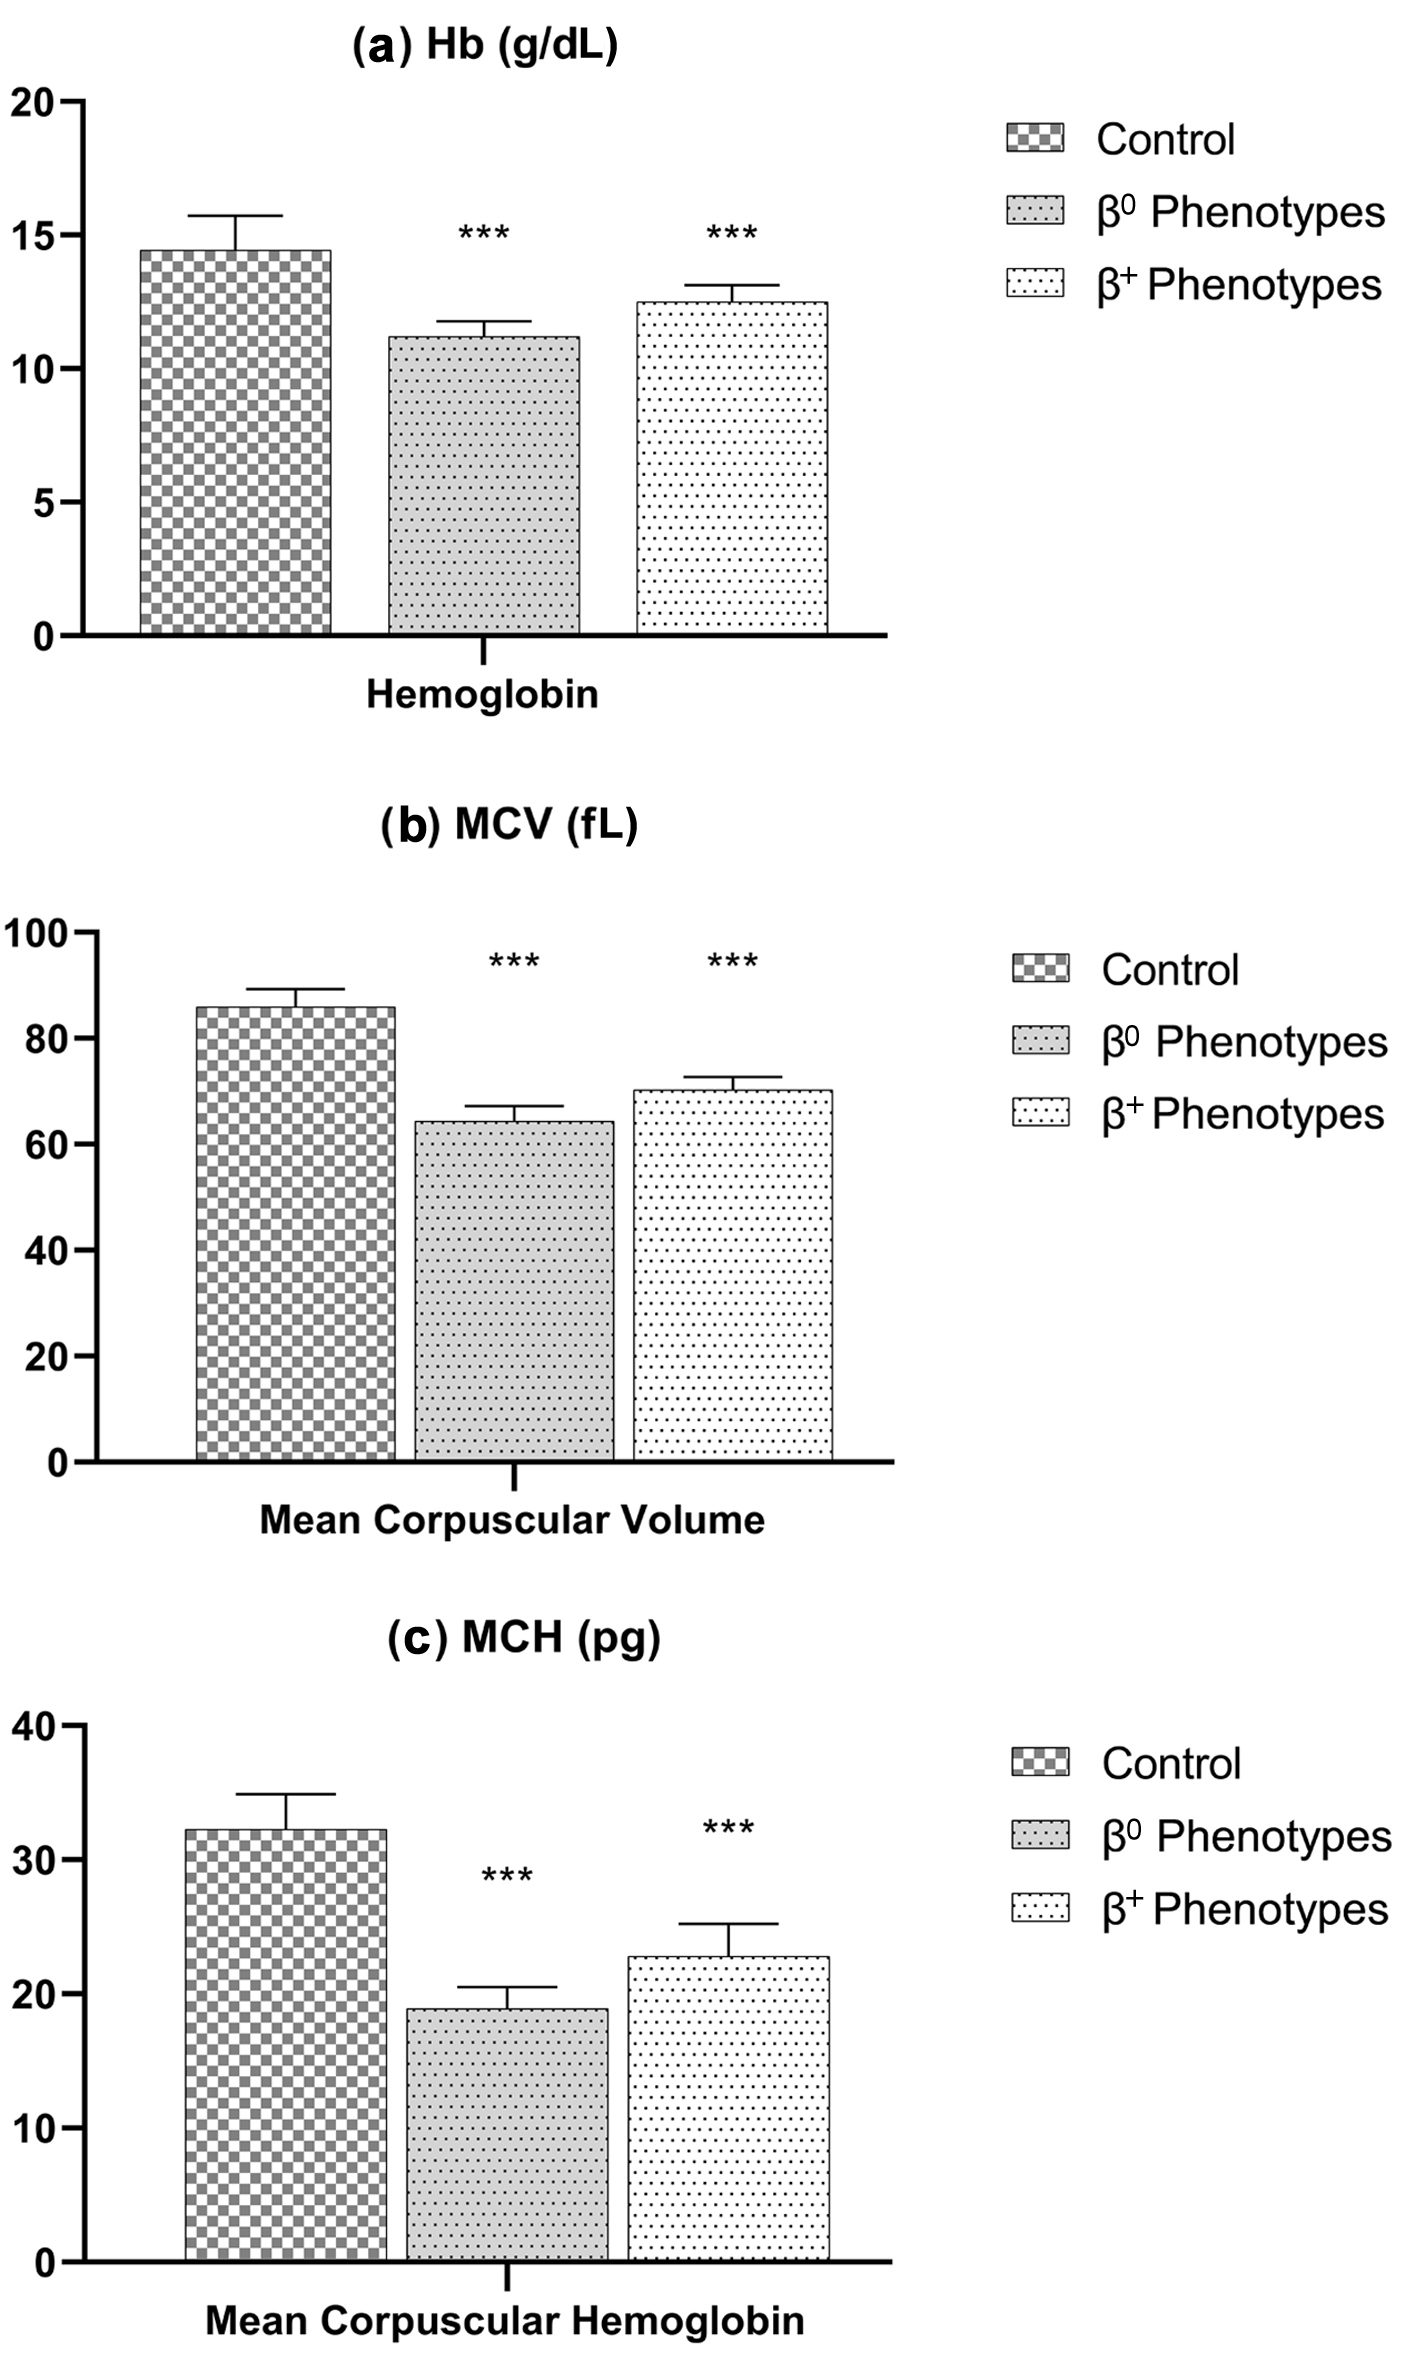
Figure 1. Hematological parameters (a: Hb; b: MCV; c: MCH) among β0- and β+-thalassemia phenotypes. Both thalassemic phenotypes have a significant (P-value < 0.0001) lower hemoglobin, MCV, and MCH compared to the control group. Hb: hemoglobin; MCH: mean corpuscular hemoglobin; MCV: mean corpuscular volume.
Figure 2.
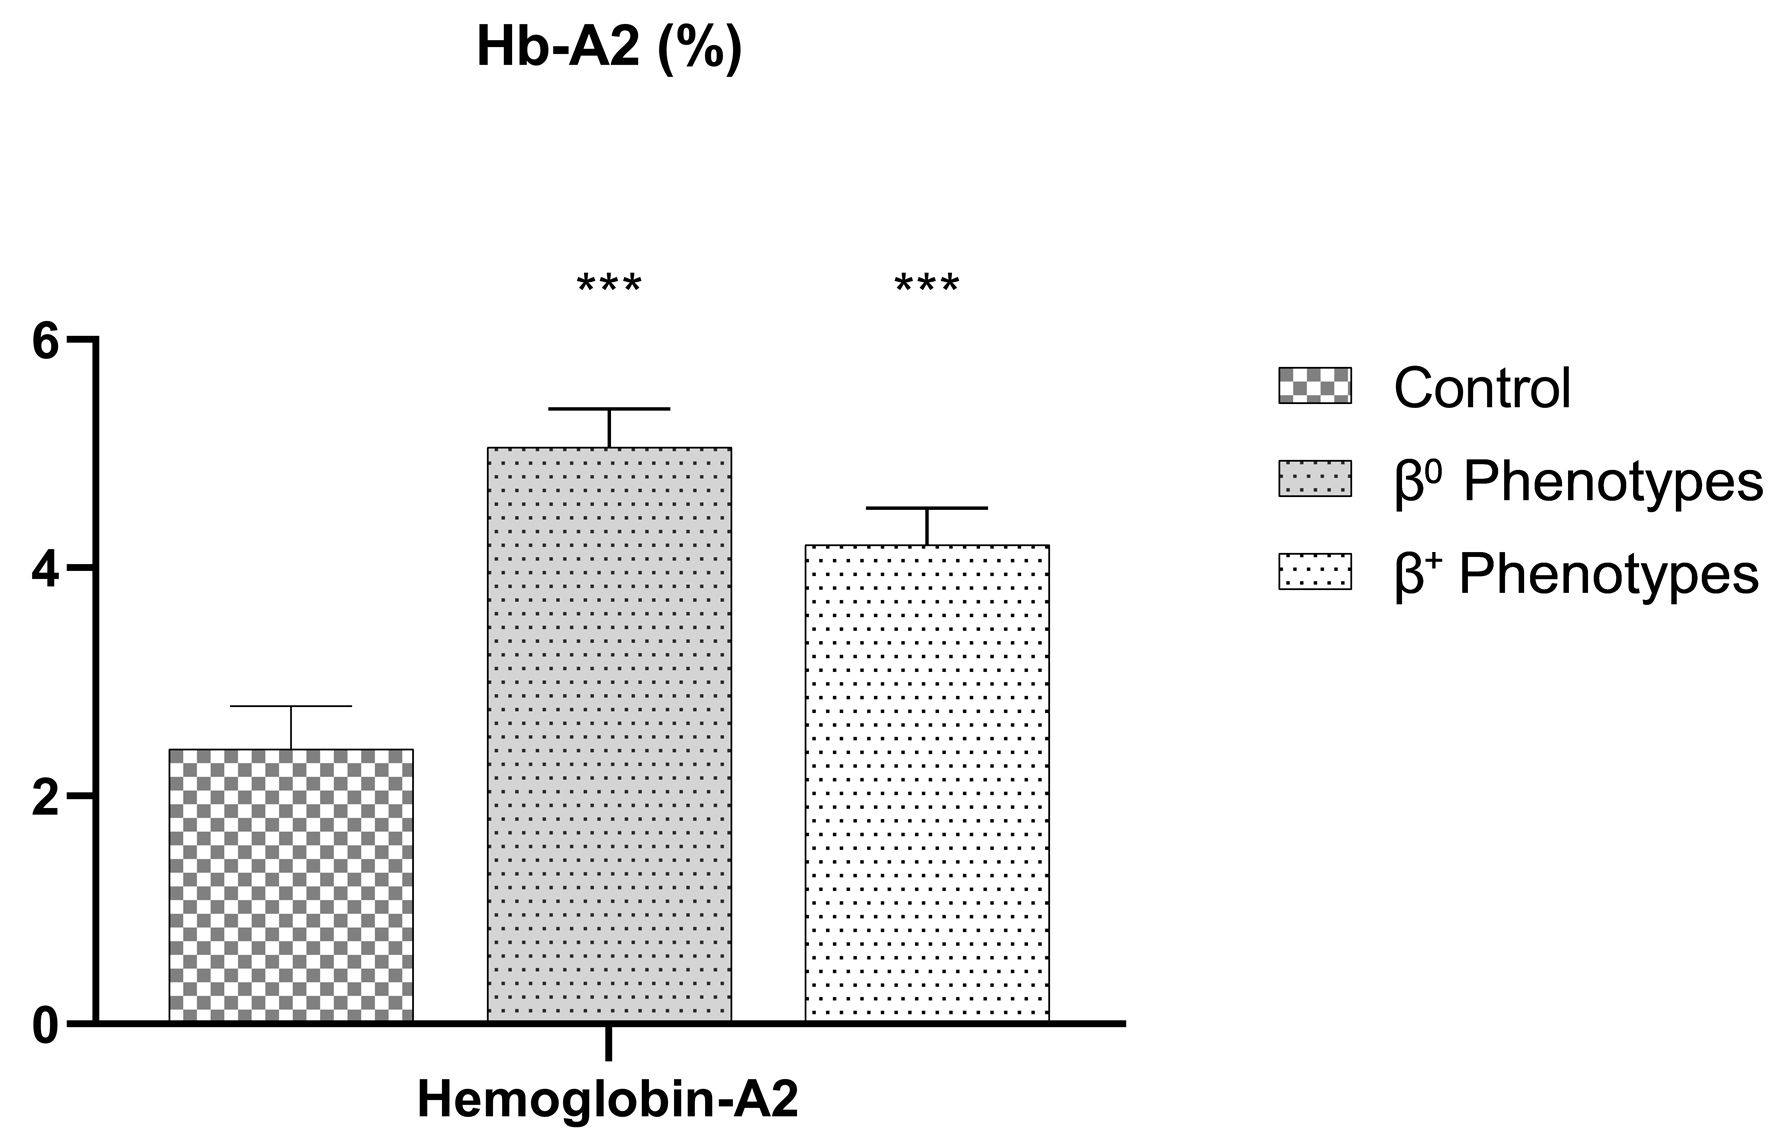
Figure 2. Capillary electrophoresis of Hb-A2 level among β0- and β+-thalassemia phenotypes. Both thalassemic phenotypes have a significant (P-value < 0.0001) higher Hb-A2 compared to the control group. Hb-A2: hemoglobin A2.
Figure 3.
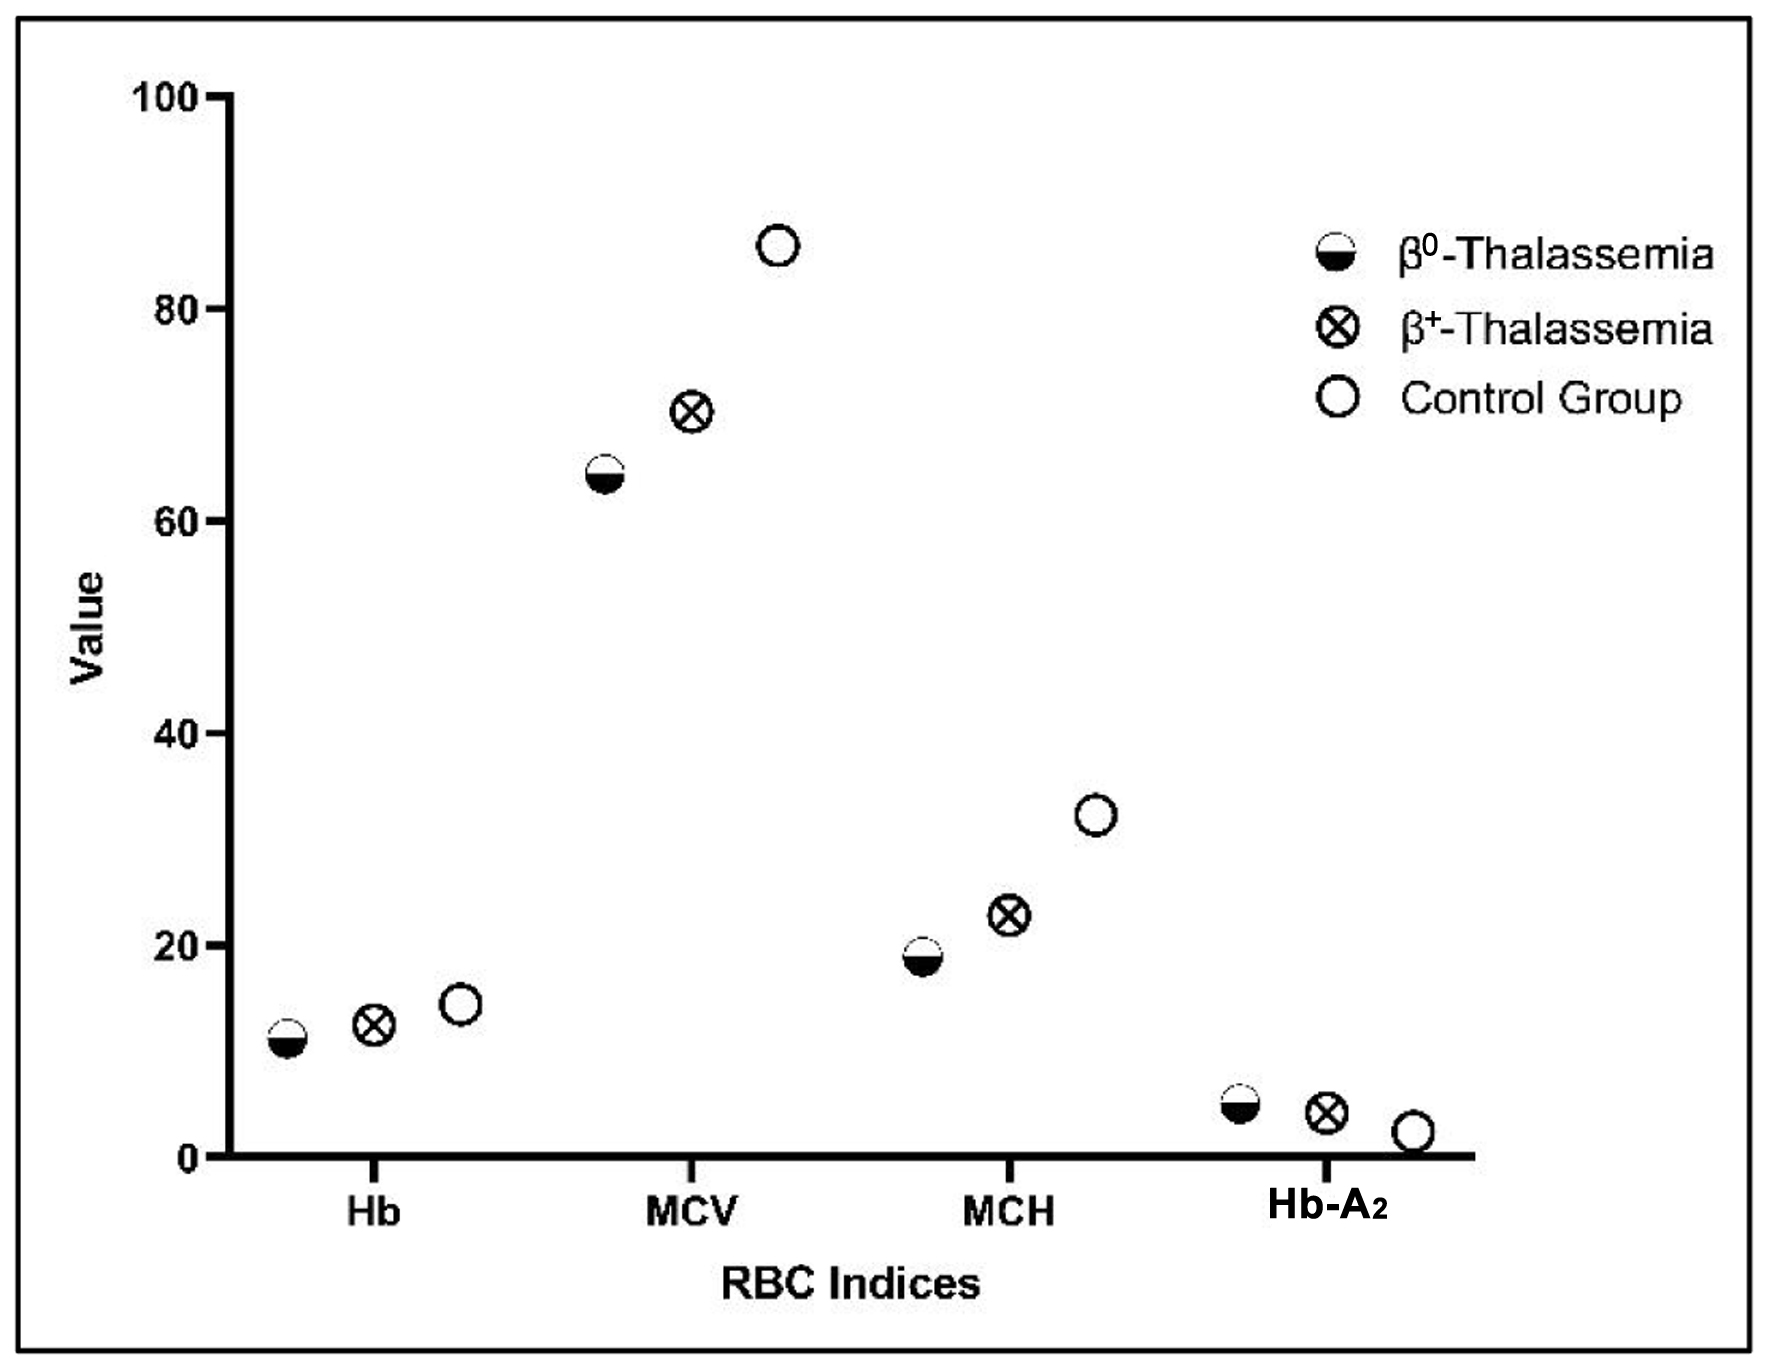
Figure 3. Dot plot comparing Hb, MCV, MCH, and Hb-A2 levels among β0- and β+-thalassemia phenotypes. The dot plot visualizes the differences between the β0-thalassemia and β+-thalassemia phenotypes compared to the control group. Hb: hemoglobin; Hb-A2: hemoglobin A2; MCH: mean corpuscular hemoglobin; MCV: mean corpuscular volume.

Tables

Table 1. Patient Gender and Age Distribution With Hematological Parameters Among β0- and β+-Thalassemia Phenotypes and Control Groups
 
Patient genderAge (Min - Max)Age, median (mean ± SD)Age < 18Age > 18
Hb: hemoglobin; Hb-A2: hemoglobin A2; Hb-F: hemoglobin F; MCH: mean corpuscular hemoglobin; MCV: mean corpuscular volume.
  Male, N = 69 (47.6%)1 - 8021.5 (20.55 ± 18.27)2742
  Female, N = 76 (52.4%)1 - 7421 (22.39 ± 16.46)2848
Variableβ0-thalassemia (N = 64)β+-thalassemia (N = 81)Control group (N = 50)P value
Hematological parameter
  Hb (g/dL)11.2 ± 0.5712.5 ± 0.6214.44 ± 1.29< 0.0001
  Cutoff≤ 11.0 g/dL
  MCV (fL)64.4 ± 2.870.3 ± 2.485.96 ± 3.30< 0.0001
  Cutoff≤ 64.0 fL
  MCH (pg)18.9 ± 1.622.8 ± 2.632.3 ± 2.57< 0.0001
  Cutoff≤ 19.0 pg
Capillary electrophoresis of hemoglobin
  Hb-A (%)93.5 ± 0.9689.5 ± 5.597.55 ± 0.350.074
  Hb-A2 (%)5.06 ± 0.334.2 ± 0.322.41 ± 0.37< 0.0001
  Cutoff≥ 5.00%
  Hb-F (%)2.1 ± 1.91.8 ± 1.60.98 ± 0.890.050


Table 2. Population Distribution in Jordan’s Governorates
 
GovernorateFrequency%
Amman9162.75
Irbid2315.86
Zarqa149.66
Maan42.76
Mafraq32.07
Tafilah32.07
Jerash21.38
Madaba21.38
Aqaba21.38
Balqa10.69


Table 3. β-Thalassemia Variants and Phenotypes (β0 and β+) Distribution
 
Variant nameHGVSType of variantPhenotypeDistributionn%
β0 phenotypes (N = 64) (44.1%)
  IVS 2.1 [G>A]HBB: c.315+1G>ARNA processing/splice junctionβ0Mediterranean, US Blacks2132.8
  IVS 1.1 [G>A]HBB: c.92+1G>ARNA processing/splice junctionβ0Mediterranean1828.1
  Codon 8 [-AA]HBB: c.25_26delAARNA translation/frameshiftβ0Mediterranean812.5
  Codon 5 [-CT]HBB: c.17_18delCTRNA translation/frameshiftβ0Mediterranean710.9
  Codon 39 [C>T]HBB: c.118C>TRNA translation/nonsense codonsβ0Mediterranean710.9
  Codon 6 [-A]HBB: c.20delARNA translation/frameshiftβ0Mediterranean, US Blacks11.6
  IVS 1.130 [G>C]HBB: c.93-1G>CRNA processing/splice junctionβ0Italian, Japanese, UAE11.6
  Codon 44 [-C]HBB: c.135delCRNA translation/frameshiftβ0Kurdish11.6
β+ phenotypes (N = 81) (55.9%)
  IVS 1.6 [T>C]HBB: c.92+6T>CRNA processing/consensus splice sitesβ+Mediterranean2834.6
  IVS 1.110 [G>A]HBB: c.93-21G>ARNA processing/cryptic splice sitesβ+Mediterranean2125.9
  IVS 2.745 [C>G]HBB: c.316-106C>GRNA processing/cryptic splice sitesβ+Mediterranean1619.8
  IVS 1.5 [G>C]HBB: c.92+5G>CRNA processing/consensus splice sitesβ+Asian Indian, SE Asian56.2
  -30 [T>A]HBB: c.-80T>ATranscriptional variants/promoter regulatory elementsβ+Mediterranean, Bulgarian44.9
  -87 [C>G]HBB: c.-137C>GTranscriptional variants/promoter regulatory elementsβ++Mediterranean33.7
  -101 [C>T]HBB: c.-151C>TTranscriptional variants/promoter regulatory elementsβ++ (silent)Mediterranean33.7
  IVS 2.848 [C>A]HBB: c.316-3C>ARNA processing/consensus splice sitesβ+UB Blacks, Egyptian, Iranian11.2


Table 4. Distribution of Hematological Parameters and Hb Analysis Among β0- and β++-Thalassemia Phenotypes
 
NHb (g/dL)P valueMCV (fL)P valueMCH (pg)P valueHb-A (%)P valueHb-A2 (%)P valueHb-F (%)P value
Hb: hemoglobin; Hb-A2: hemoglobin A2; Hb-F: hemoglobin F; MCH: mean corpuscular hemoglobin; MCV: mean corpuscular volume.
β0 phenotypes
  IVS 2.1 [G>A]2111.78 ± 1.64< 0.000163.36 ± 7.59< 0.000120.00 ± 1.39< 0.000192.79 ± 3.75< 0.00015.25 ± 0.86< 0.00012.92 ± 3.980.0007
  IVS 1.1 [G>A]1810.80 ± 1.42< 0.000165.76 ± 5.49< 0.000118.75 ± 1.36< 0.000193.39 ± 3.08< 0.00015.12 ± 0.89< 0.00011.27 ± 2.430.4606
  Codon 8 [-AA]811.89 ± 1.26< 0.000165.49 ± 4.81< 0.000119.27 ± 1.68< 0.000192.72 ± 3.01< 0.00014.62 ± 1.38< 0.00013.03 ± 3.470.0133
  Codon 5 [-CT]711.34 ± 2.58< 0.000169.41 ± 7.70< 0.000119.22 ± 1.97< 0.000193.94 ± 1.450.00155.33 ± 0.46< 0.00010.84 ± 1.690.9958
  Codon 39 [C>T]711.37 ± 1.92< 0.000161.74 ± 4.56< 0.000116.72 ± 1.99< 0.000192.85 ± 4.88< 0.00015.44 ± 0.49< 0.00015.62 ± 4.21< 0.0001
  Codon 6 [-A]110.10 ± 0.00< 0.000163.10 ± 0.00< 0.000115.98 ± 1.86< 0.000194.50 ± 0.000.89015.30 ± 0.00< 0.00010.00 ± 0.00> 0.9999
  IVS 1.130 [G>C]111.20 ± 0.000.004860.40 ± 0.00< 0.000119.96 ± 1.41< 0.000192.82 ± 0.000.27064.70 ± 0.000.00323.10 ± 0.000.9148
  Codon 44 [-C]111.50 ± 0.00< 0.000165.70 ± 0.00< 0.000117.99 ± 1.41< 0.000195.30 ± 0.000.98784.70 ± 0.000.00320.00 ± 0.00> 0.9999
β+ phenotypes
  IVS 1.6 [T>C]2812.6 ± 1.46<0.000170.55 ± 7.02< 0.000121.57 ± 1.39< 0.000188.68 ± 4.77< 0.00013.72 ± 1.38< 0.00012.17 ± 4.270.0086
  IVS 1.110 [G>A]2112.14 ± 1.84<0.000169.01 ± 7.36< 0.000121.00 ± 1.49< 0.000189.67 ± 3.57< 0.00014.71 ± 0.48< 0.00012.31 ± 3.470.0122
  IVS 2.745 [C>G]1611.63 ± 1.93<0.000168.82 ± 4.99< 0.000119.91 ± 1.38< 0.000187.92 ± 2.35< 0.00014.51 ± 0.63< 0.00011.12 ± 2.000.6467
  IVS 1.5 [G>C]512.22 ± 0.53<0.000167.12 ± 4.31< 0.000120.00 ± 1.32< 0.000190.32 ± 0.930.03093.88 ± 0.20< 0.00010.76 ± 0.880.9993
  -30 [T>A]412.60 ± 0.550.025673.75 ± 5.72< 0.000122.38 ± 1.29< 0.000191.11 ± 3.91< 0.00014.14 ± 0.57< 0.00013.1 ± 5.400.0112
  -87 [C>G]313.73 ± 1.170.027173.70 ± 4.85< 0.000122.39 ± 1.32< 0.000189.63 ± 4.500.00034.43 ± 1.35< 0.00012.67 ± 3.320.5068
  -101 [C>T]312.70 ± 1.060.014270.27 ± 8.20< 0.000124.37 ± 1.51< 0.000187.11 ± 7.49< 0.00014.34 ± 0.170.03252.37 ± 4.080.1596
  IVS 2.848 [C>A]112.10 ± 0.00< 0.000169.10 ± 0.00< 0.000120.64 ± 0.58< 0.000191.60 ± 0.000.91014.12 ± 0.000.00050.00 ± 0.00> 0.9999
  Control5014.44 ± 1.2985.96 ± 3.3032.31 ± 2.5797.55 ± 0.352.41 ± 0.3780.98 ± 0.89