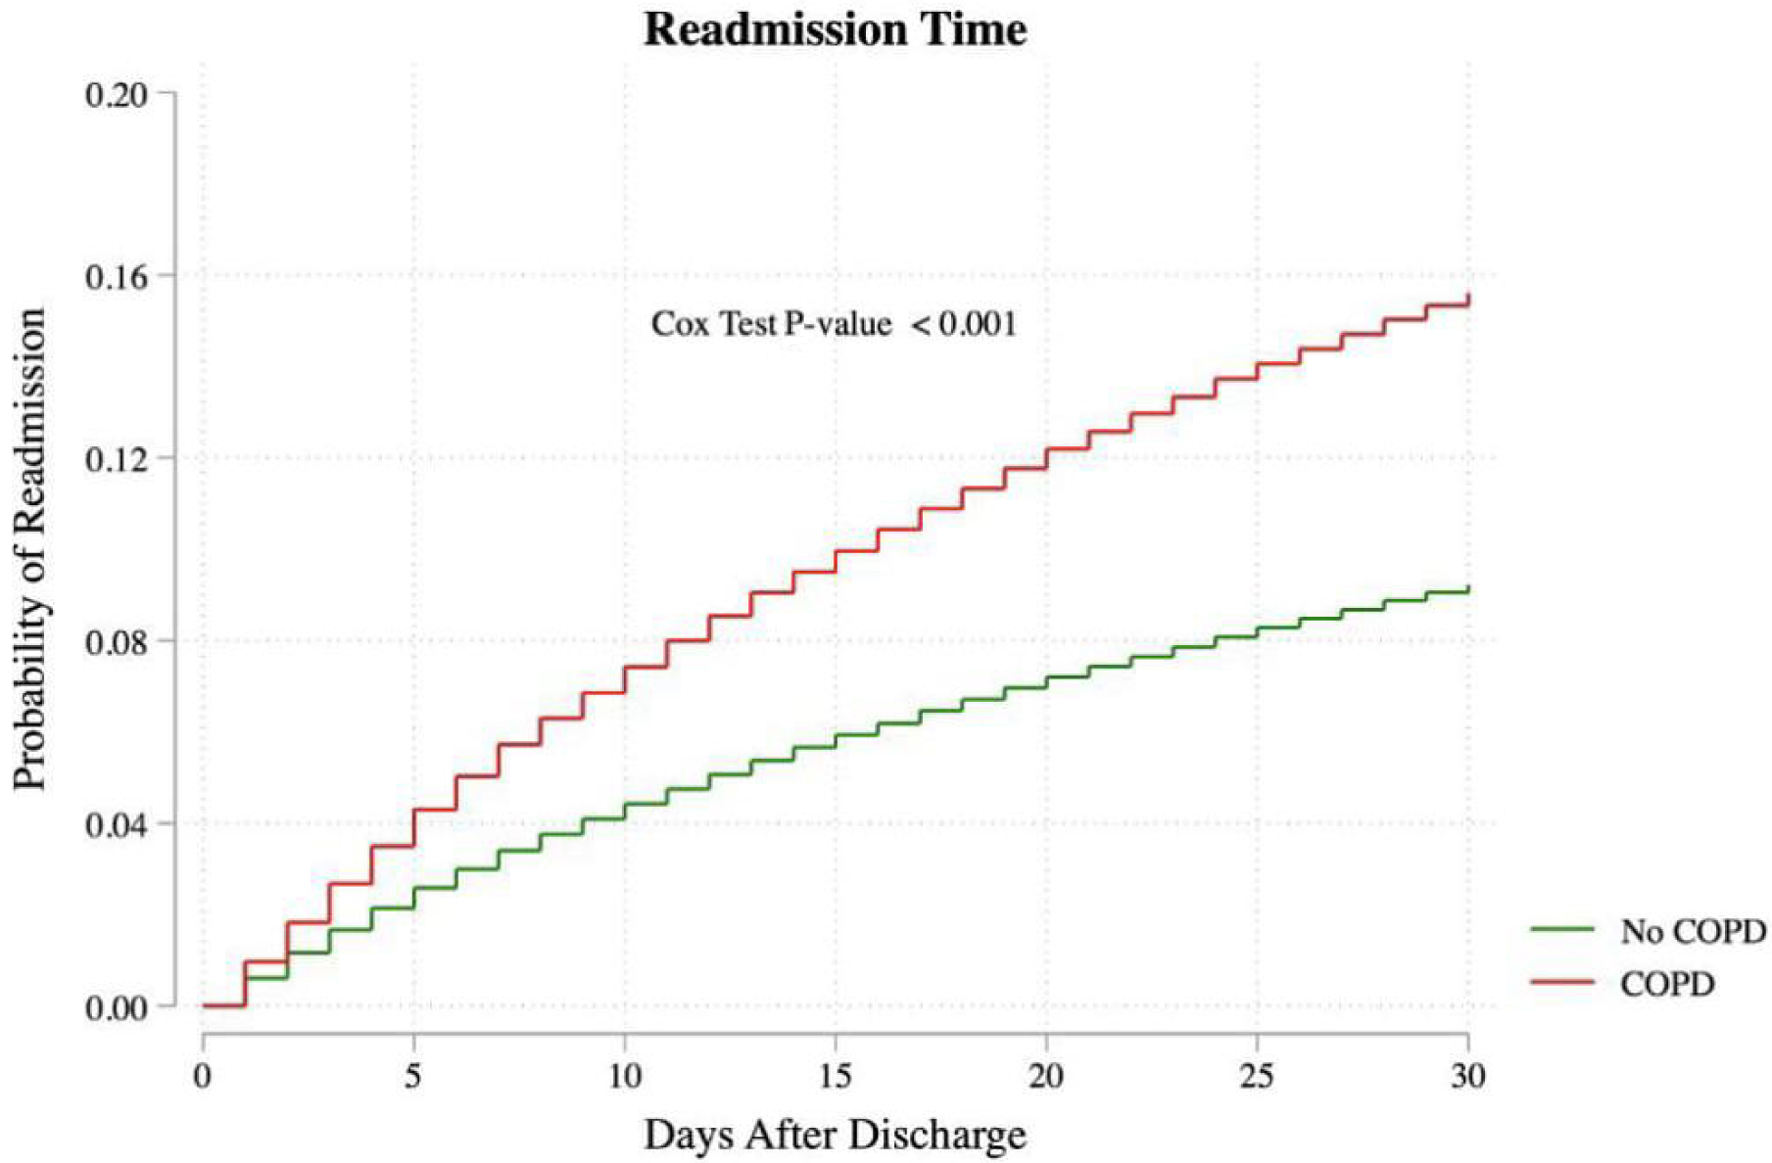
↓ Figure 1. Readmission probability of atrial
fibrillation patients based on the status of COPD presence or not. COPD: chronic obstructive pulmonary
disease.
| Journal of Clinical Medicine Research, ISSN 1918-3003 print, 1918-3011 online, Open Access |
| Article copyright, the authors; Journal compilation copyright, J Clin Med Res and Elmer Press Inc |
| Journal website https://jocmr.elmerjournals.com |
Original Article
Volume 17, Number 6, June 2025, pages 309-319
Impact of Chronic Obstructive Pulmonary Disease Burden on Patients With Atrial Fibrillation: A Nationwide Study
Figures
Tables
| Variable | Patients with atrial fibrillation | P-value | |
|---|---|---|---|
| No COPD | COPD | ||
| COPD: chronic obstructive pulmonary disease; SD: standard deviation; SE: standard error; M: mean. | |||
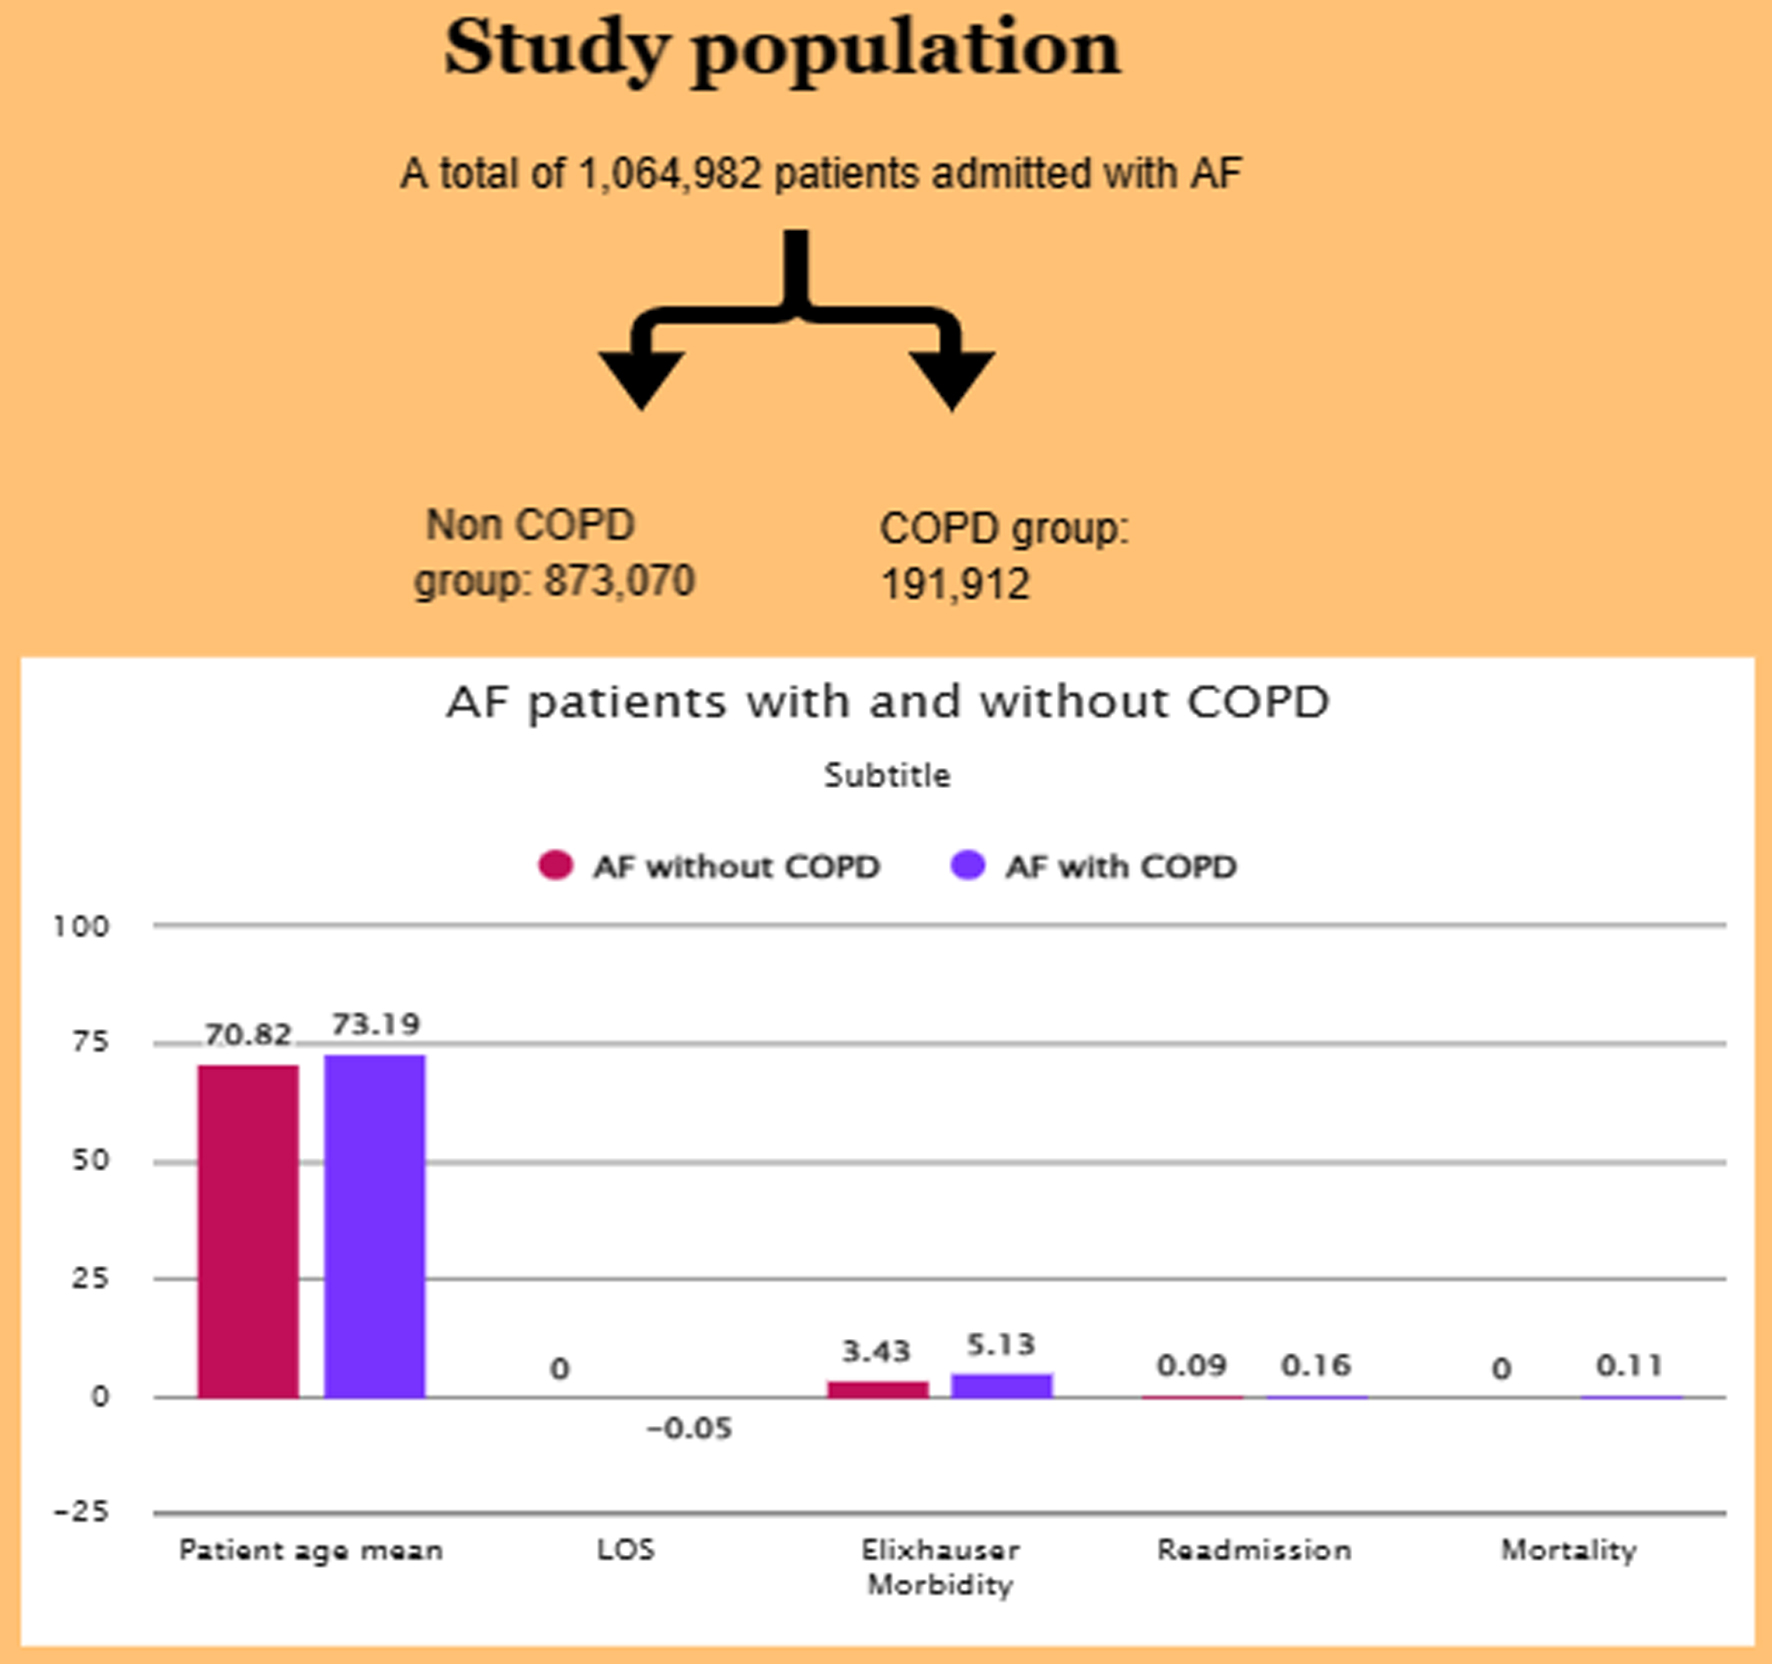
| Indexed admissions, n | 873,070 | 191,912 | |
| Demographics | |||
| Mean age, years (SD) | 70.82 (13.90) | 73.19 (10.44) | < 0.001 |
| Female, % (SE) | 52.94 (0.09) | 52.73 (0.18) | 0.247 |
| Insurance carrier, % (SE) | |||
| Medicare | 70.13 (0.15) | 82.30 (0.18) | < 0.001 |
| Medicaid | 5.75 (0.07) | 6.57 (0.11) | |
| Private insurance | 21.52 (0.13) | 9.57 (0.14) | |
| Self-pay | 2.60 (0.04) | 1.55 (0.05) | |
| Median household income percentile, % (SE) | |||
| 0-25th | 26.64 (0.36) | 33.47 (0.45) | < 0.001 |
| 26-50th | 27.77 (0.29) | 29.99 (0.33) | |
| 51-75th | 25.55 (0.27) | 22.76 (0.31) | |
| 76-100th | 20.03 (0.38) | 13.78 (0.30) | |
| Hospital characteristics | |||
| Bed size, % (SE) | |||
| Small | 18.94 (0.34) | 19.34 (0.39) | 0.064 |
| Medium | 29.66 (0.40) | 29.95 (0.44) | |
| Large | 51.40 (0.47) | 50.71 (0.51) | |
| Urban-rural designation, % (SE) | |||
| Large metropolitan | 51.83 (0.60) | 46.21 (0.64) | < 0.001 |
| Small metropolitan | 37.15 (0.58) | 39.60 (0.63) | |
| Micropolitan | 8.44 (0.21) | 10.97 (0.30) | |
| Non-urban | 2.59 (0.09) | 3.22 (0.13) | |
| Teaching status, % (SE) | |||
| Metropolitan non-teaching | 25.77 (0.36) | 27.18 (0.40) | < 0.001 |
| Metropolitan teaching | 63.20 (0.42) | 58.63 (0.48) | |
| Non-metropolitan nonteaching | 11.03 (0.23) | 14.19 (0.32) | |
| Patient location: NCHS code, % (SE) | |||
| Central counties | 21.85 (0.50) | 18.78 (0.51) | < 0.001 |
| Fringe counties | 27.81 (0.56) | 25.13 (0.55) | |
| Medium metro counties | 22.33 (0.52) | 22.56 (0.56) | |
| Small metro counties | 10.28 (0.32) | 11.53 (0.40) | |
| Micropolitan counties | 9.95 (0.18) | 12.38 (0.26) | |
| Noncore counties | 7.77 (0.17) | 9.63 (0.23) | |
| Type of admission, % (SE) | |||
| Weekday | 77.23 (0.08) | 77.33 (0.14) | 0.557 |
| Weekend | 22.77 (0.08) | 22.67 (0.14) | |
| Length of stay, M (SE) | 3.26 (0.01) | 4.27 (0.02) | < 0.001 |
| Total cost, M (SE) | 8,278 (52.39) | 10,155 (59.12) | < 0.001 |
| Comorbidities, % (SE) | |||
| Cardiac arrhythmias | 77.89 (0.17) | 75.53 (0.20) | < 0.001 |
| Renal failure | 82.13 (0.10) | 75.49 (0.17) | < 0.001 |
| Diabetes | 73.38 (0.10) | 67.12 (0.18) | < 0.001 |
| Do not resuscitate order | 92.54 (0.09) | 89.70 (0.14) | < 0.001 |
| Elixhauser score, M ± SD | 3.43 ± 1.92 | 5.13 ± 1.93 | < 0.001 |
| Primary outcome | |||
| Readmission rate, n (M) | 79,837 (0.09) | 29,424 (0.16) | < 0.001 |
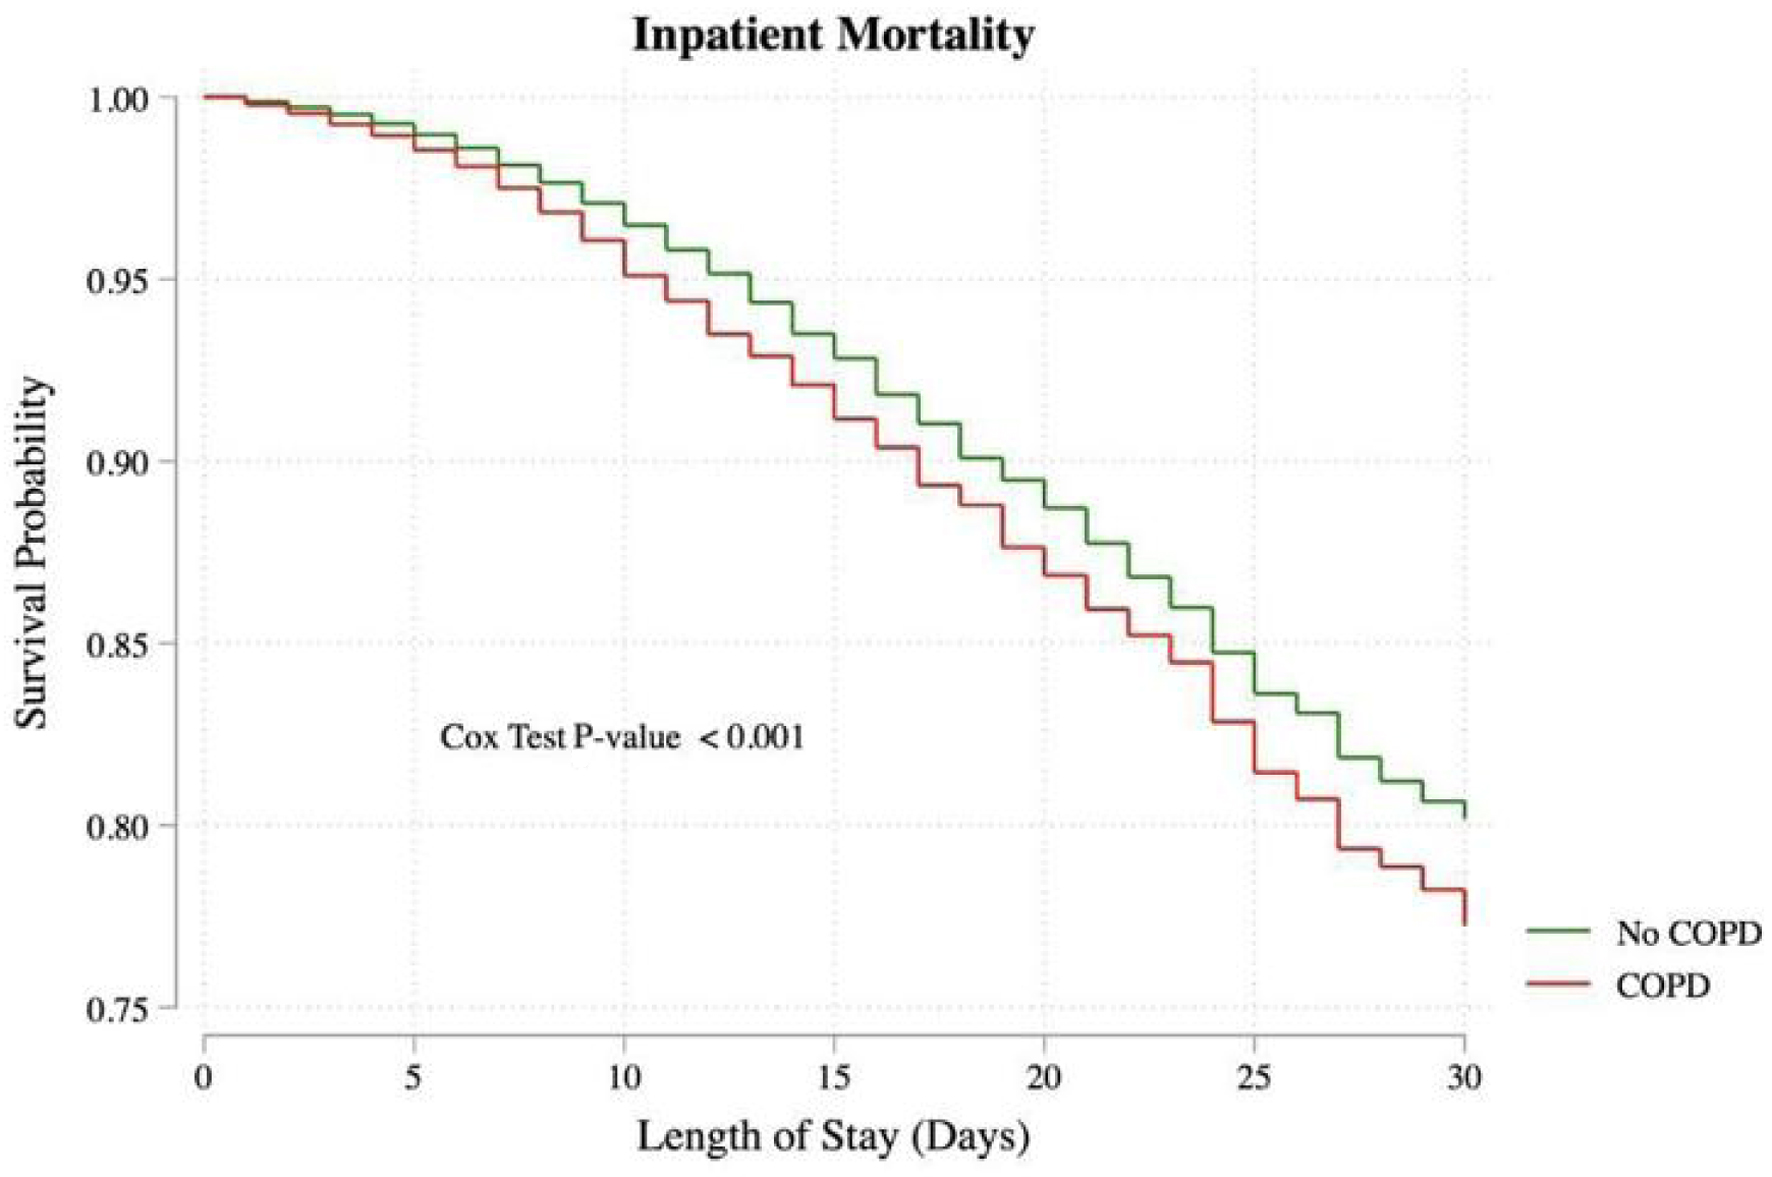
| Death during hospitalization, n (M) | 7,481 (0.01) | 3,270 (0.02) | < 0.001 |
| Patient count (numbers) | ICD-10_I10_dx1 | Corresponding diagnosis |
|---|---|---|
| Patient counts refer to the total number of patients for the entire study year period. COPD: chronic obstructive pulmonary disease. | ||
| Overall (the whole study population) | ||
| 1. 19543.7 | I480 | Paroxysmal atrial fibrillation |
| 2. 11207.64 | I4891 | Unspecified atrial fibrillation |
| 3. 9428.531 | I110 | Hypertensive heart disease with heart failure |
| 4. 8722.494 | I130 | Hypertensive heart and chronic kidney disease with heart failure and stage 1 through 4 chronic kidney disease, or unspecified chronic kidney disease |
| 5. 8129.352 | A419 | Sepsis, unspecified organism |
| 6. 5084.327 | I481 | Persistent atrial fibrillation |
| 7. 3034.057 | I482 | Chronic atrial fibrillation |
| 8. 2938.654 | N179 | Acute kidney failure, unspecified |
| 9. 2719.275 | J441 | Chronic obstructive pulmonary disease with (acute) exacerbation |
| 10. 2683.224 | J189 | Pneumonia, unspecified organism |
| If there was no COPD | ||
| 1. 16092.11 | I480 | Paroxysmal atrial fibrillation |
| 2. 9333.146 | I4891 | Unspecified atrial fibrillation |
| 3. 6433.381 | I110 | Hypertensive heart disease with heart failure |
| 4. 5854.354 | I130 | Hypertensive heart and chronic kidney disease with heart failure and stage 1 through 4 chronic kidney disease, or unspecified chronic kidney disease |
| 5. 5435.661 | A419 | Sepsis, unspecified organism |
| 6. 4199.293 | I481 | Persistent atrial fibrillation |
| 7. 2308.78 | N179 | Acute kidney failure, unspecified |
| 8. 2240.723 | I482 | Chronic atrial fibrillation |
| 9. 2104.674 | I495 | Sick sinus syndrome |
| 10. 1790.016 | I4892 | Unspecified atrial flutter |
| If there was COPD | ||
| 1. 3434.711 | I480 | Paroxysmal atrial fibrillation |
| 2. 3013.305 | I110 | Hypertensive heart disease with heart failure |
| 3. 2868.155 | I130 | Hypertensive heart and chronic kidney disease with heart failure and stage 1 through 4 chronic kidney disease, or unspecified chronic kidney disease |
| 4. 2717.511 | J441 | Chronic obstructive pulmonary disease with (acute) exacerbation |
| 5. 2702.957 | A419 | Sepsis, unspecified organism |
| 6. 1914.565 | I4891 | Unspecified atrial fibrillation |
| 7. 957.3796 | J189 | Pneumonia, unspecified organism |
| 8. 900.3476 | I481 | Persistent atrial fibrillation |
| 9. 837.307 | J9621 | Acute and chronic respiratory failure with hypoxia |
| 10. 813.2898 | I5033 | Acute on chronic diastolic (congestive) heart failure |
| Predictors | Multivariate estimates | |||
|---|---|---|---|---|
| Odds ratio | 95% confidence interval | P-value | ||
| COPD: chronic obstructive pulmonary disease. | ||||
| Readmission | ||||
| COPD | 1.35 | 1.32 | 1.39 | < 0.001 |
| Age at admission | 1.01 | 1.01 | 1.01 | < 0.001 |
| Indicator of sex | 1.05 | 1.02 | 1.07 | < 0.001 |
| Medicare vs. Medicaid | 1.28 | 1.23 | 1.33 | < 0.001 |
| Medicare vs. private insurance | 0.71 | 0.68 | 0.73 | < 0.001 |
| Medicare vs. self-pay | 0.91 | 0.84 | 0.98 | 0.016 |
| 0-25th vs. 26-50th percentile income | 0.92 | 0.90 | 0.95 | < 0.001 |
| 0-25th vs. 51-75th percentile income | 0.85 | 0.83 | 0.88 | < 0.001 |
| 0-25th vs. 76-100th percentile income | 0.83 | 0.80 | 0.86 | < 0.001 |
| Metro nonteaching vs. metro teaching | 0.97 | 0.95 | 0.99 | 0.016 |
| Central vs. small metro counties | 0.93 | 0.87 | 0.98 | 0.007 |
| Central vs. micropolitan counties | 0.87 | 0.82 | 0.92 | < 0.001 |
| Central vs. noncore counties | 0.82 | 0.77 | 0.87 | < 0.001 |
| Cardiac arrhythmias | 0.86 | 0.84 | 0.88 | < 0.001 |
| Renal failure | 1.18 | 1.15 | 1.21 | < 0.001 |
| Do not resuscitate order | 0.94 | 0.90 | 0.97 | 0.001 |
| Elixhauser comorbidity summary | 1.15 | 1.15 | 1.16 | < 0.001 |
| Mortality | ||||
| COPD | 1.03 | 0.96 | 1.11 | 0.411 |
| Age at admission | 1.02 | 1.01 | 1.02 | < 0.001 |
| Elixhauser comorbidity summary | 1.39 | 1.37 | 1.42 | < 0.001 |
| Indicator of sex | 0.72 | 0.68 | 0.77 | < 0.001 |
| Medicare vs. private insurance | 0.76 | 0.66 | 0.87 | < 0.001 |
| 0-25th vs. 26-50th percentile income | 0.84 | 0.77 | 0.91 | < 0.001 |
| 0-25th vs. 51-75th percentile income | 0.78 | 0.71 | 0.85 | < 0.001 |
| 0-25th vs. 76-100th percentile income | 0.70 | 0.64 | 0.78 | < 0.001 |
| Small vs. large bed size hospital | 1.14 | 1.04 | 1.25 | 0.007 |
| Large metro vs. non-metro hospital | 1.45 | 1.10 | 1.92 | 0.009 |
| Cardiac arrhythmias | 0.87 | 0.81 | 0.93 | < 0.001 |
| Diabetes | 0.70 | 0.65 | 0.75 | < 0.001 |
| Do not resuscitate order | 11.50 | 10.65 | 12.42 | < 0.001 |