Figures
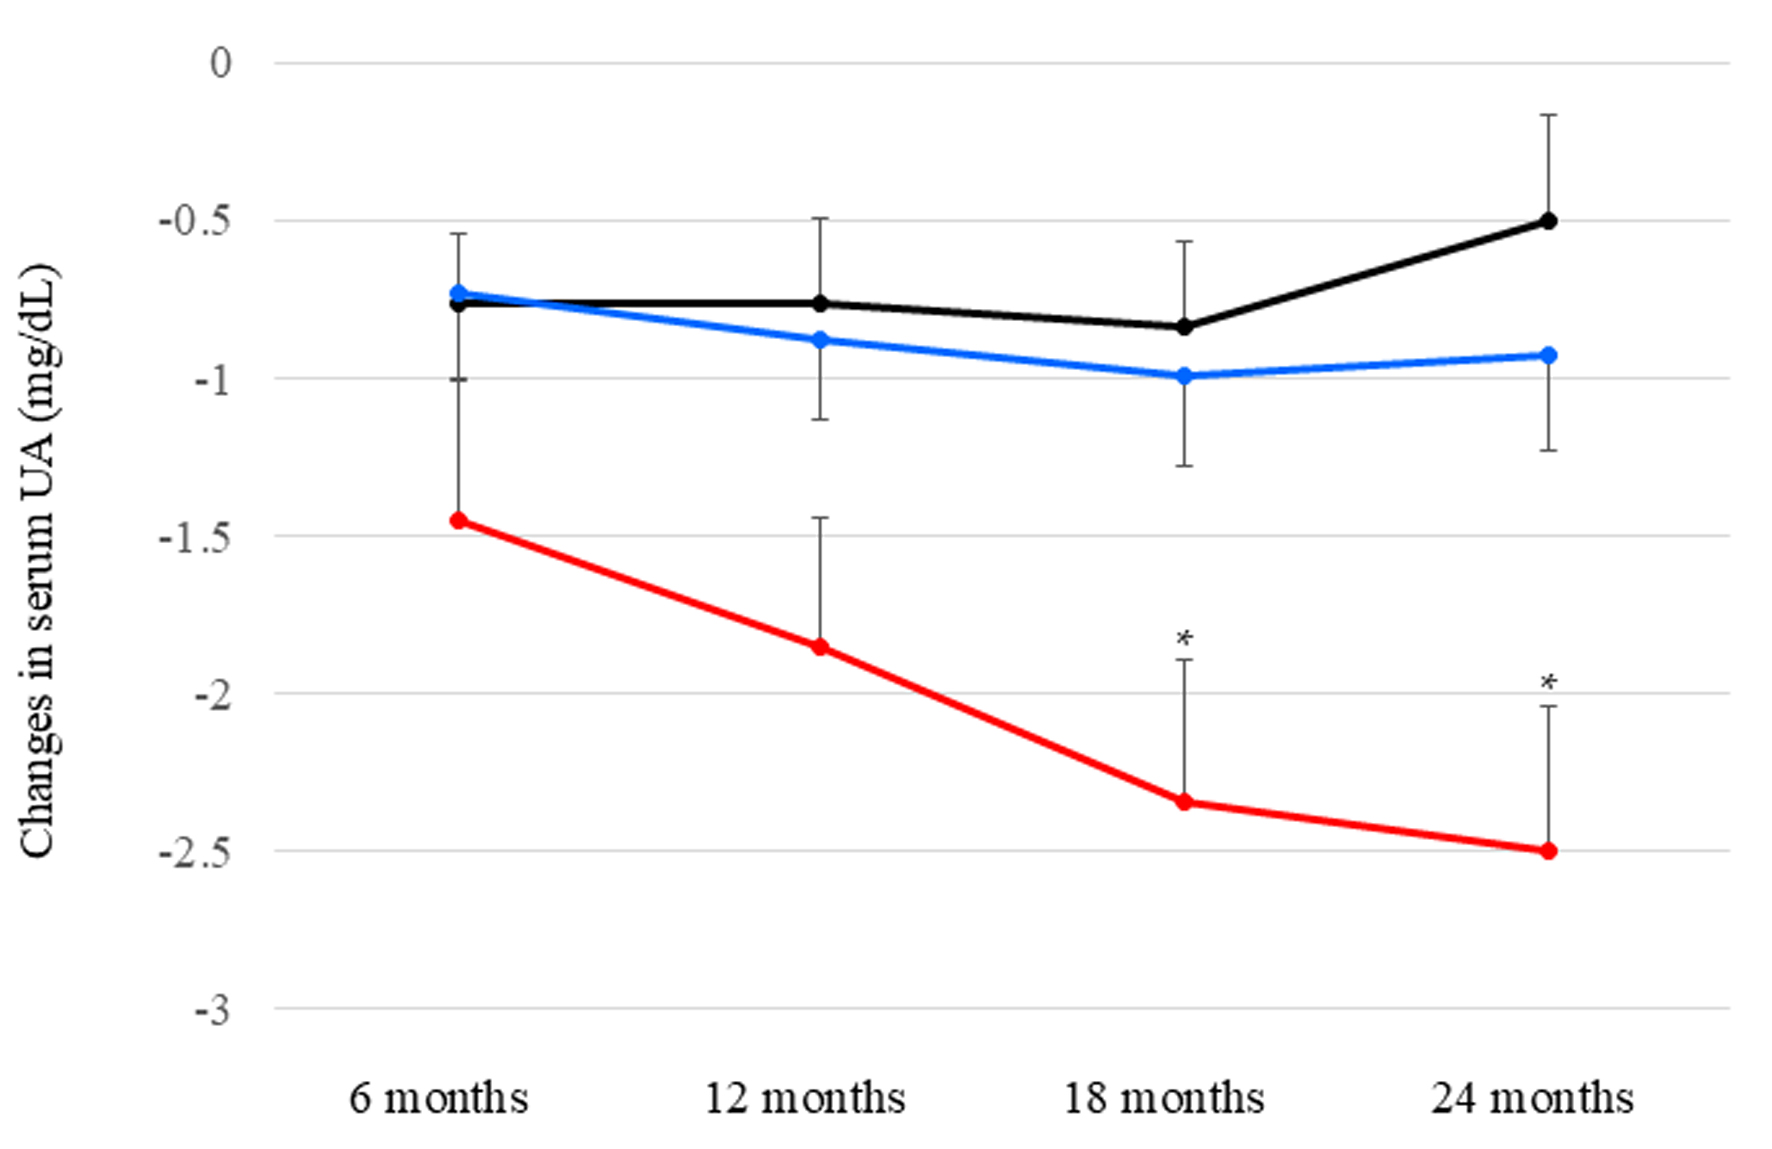
↓ Figure 1. Changes in serum uric acid (UA) as
compared with baseline by each dose of dotinurad. Black, blue, and red circles and error bars indicate
the mean ± standard error of reduced values in serum UA among patients who had taken daily 0.5,
1.0, and 2.0 mg of dotinurad, respectively. *P < 0.05 vs. patients who had taken daily 0.5 and 1.0 mg
of dotinurad.
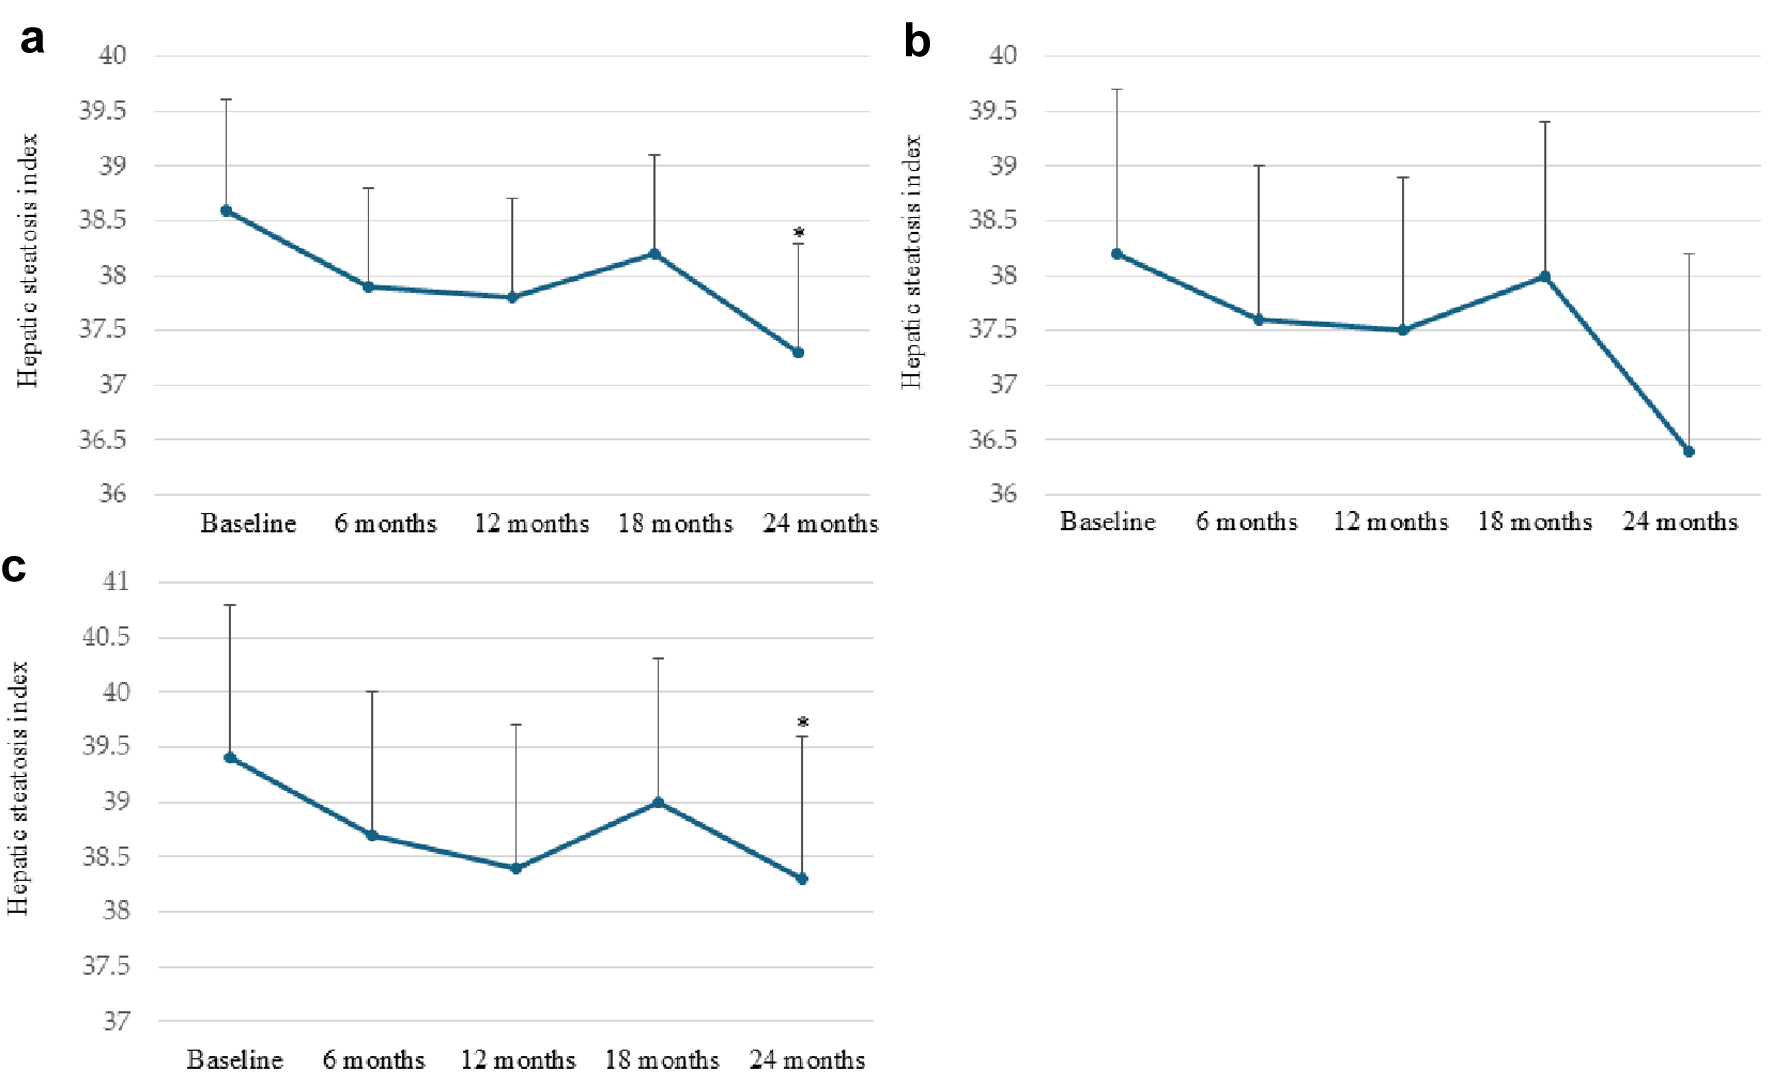
↓ Figure 2. Changes in the hepatic steatosis
index after starting dotinurad in all patients (a), patients naive to uric acid (UA)-lowering drugs (b),
and patients who switched from xanthine oxidase (XO) inhibitors (c). *P < 0.05 vs. baseline. Circles
and error bars indicate the mean ± standard error.
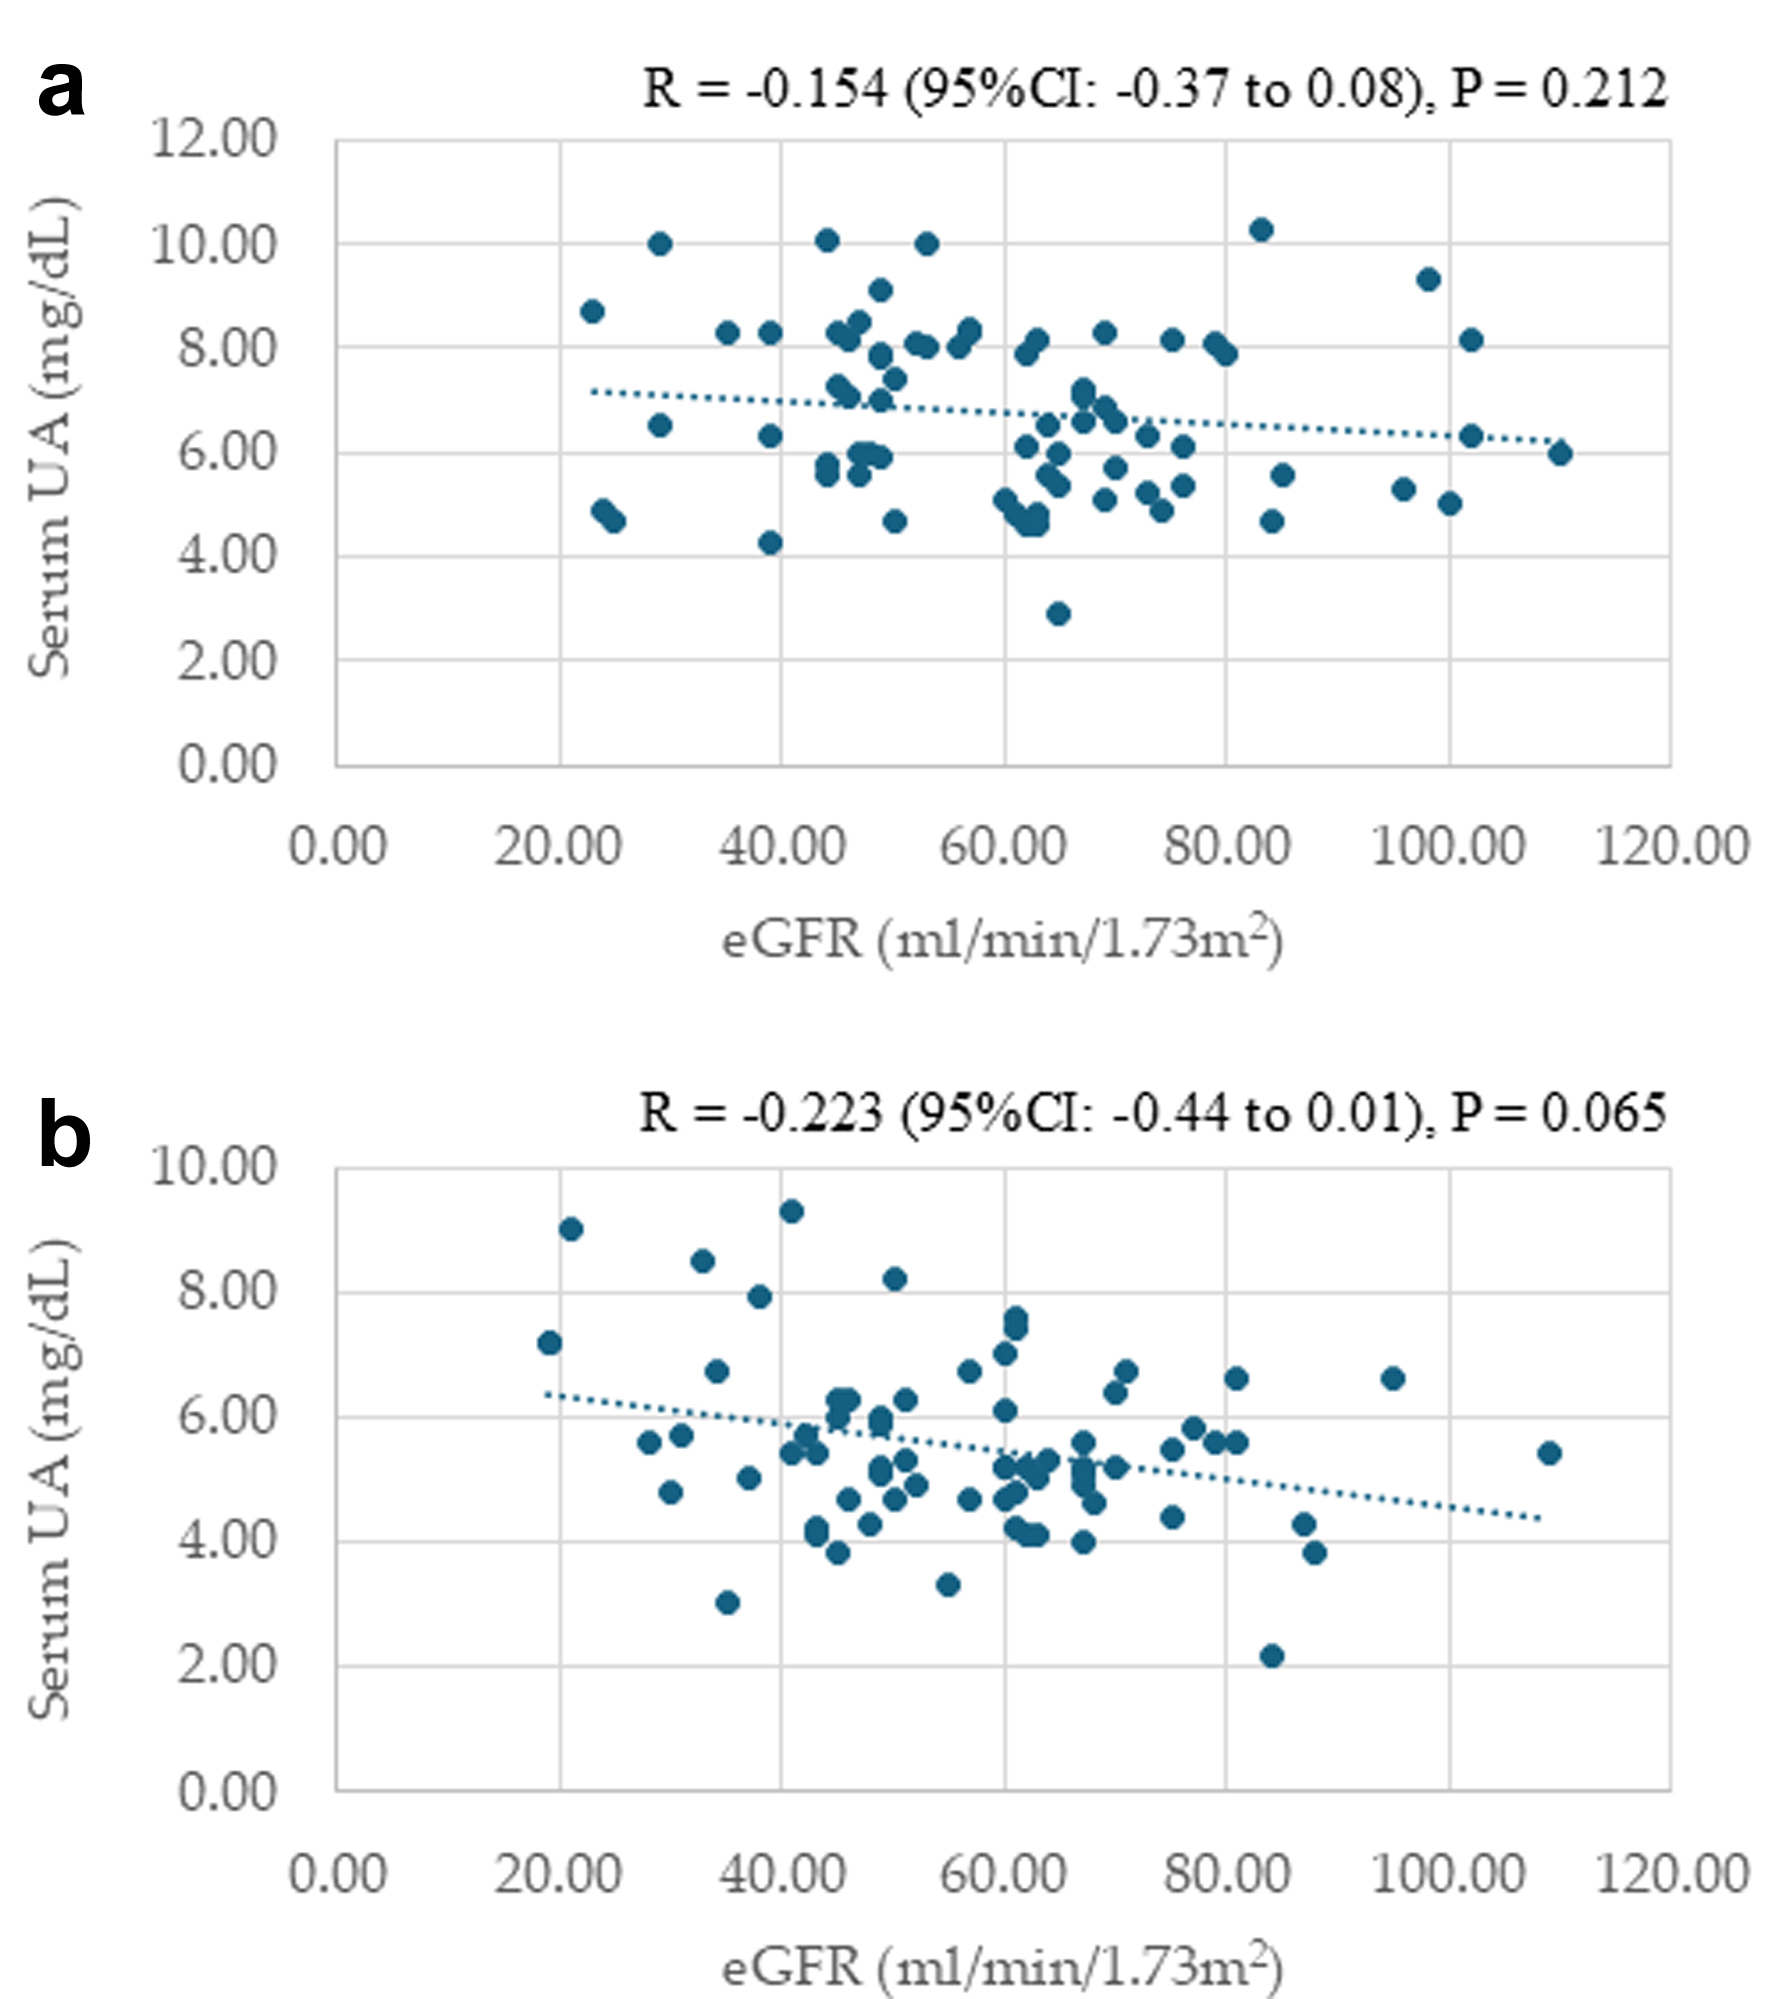
↓ Figure 3. Correlations between serum uric acid
(UA) levels and estimated glomerular filtration rate (eGFR) at baseline (a) and 24 months after starting
dotinurad (b).
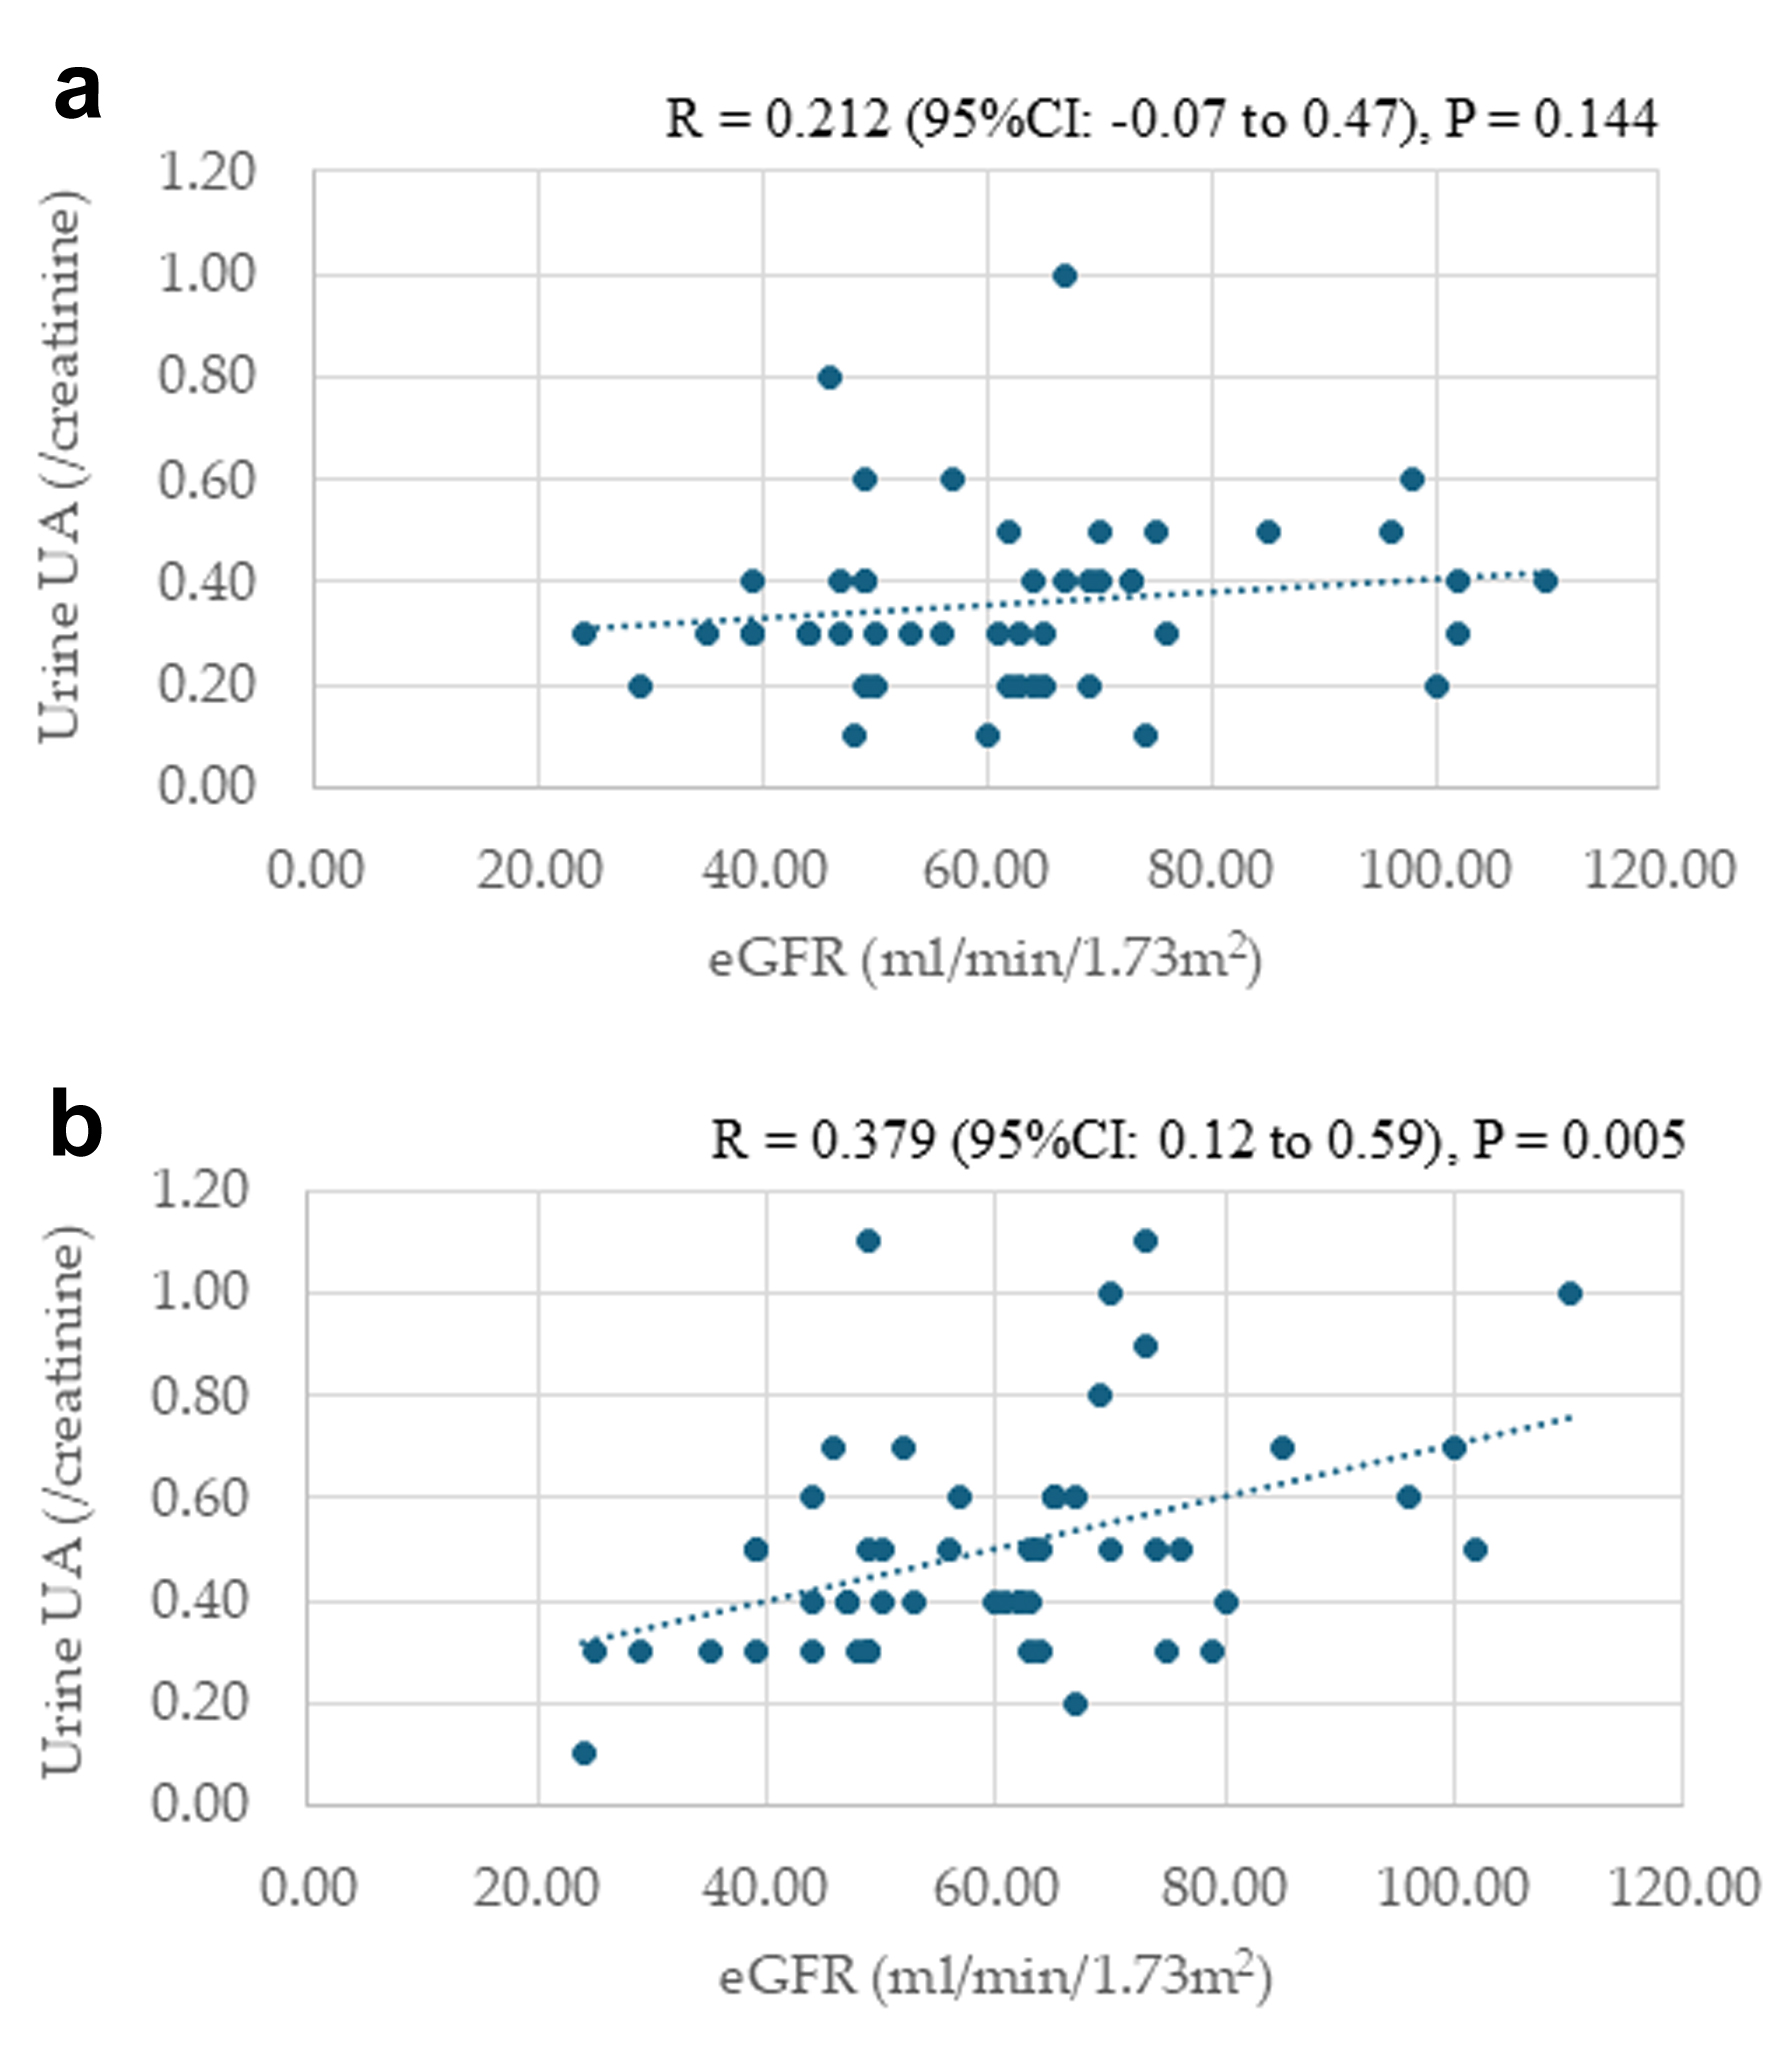
↓ Figure 4. Correlations between urine uric acid
(UA) levels and estimated glomerular filtration rate (eGFR) at baseline (a) and 24 months after starting
dotinurad (b).
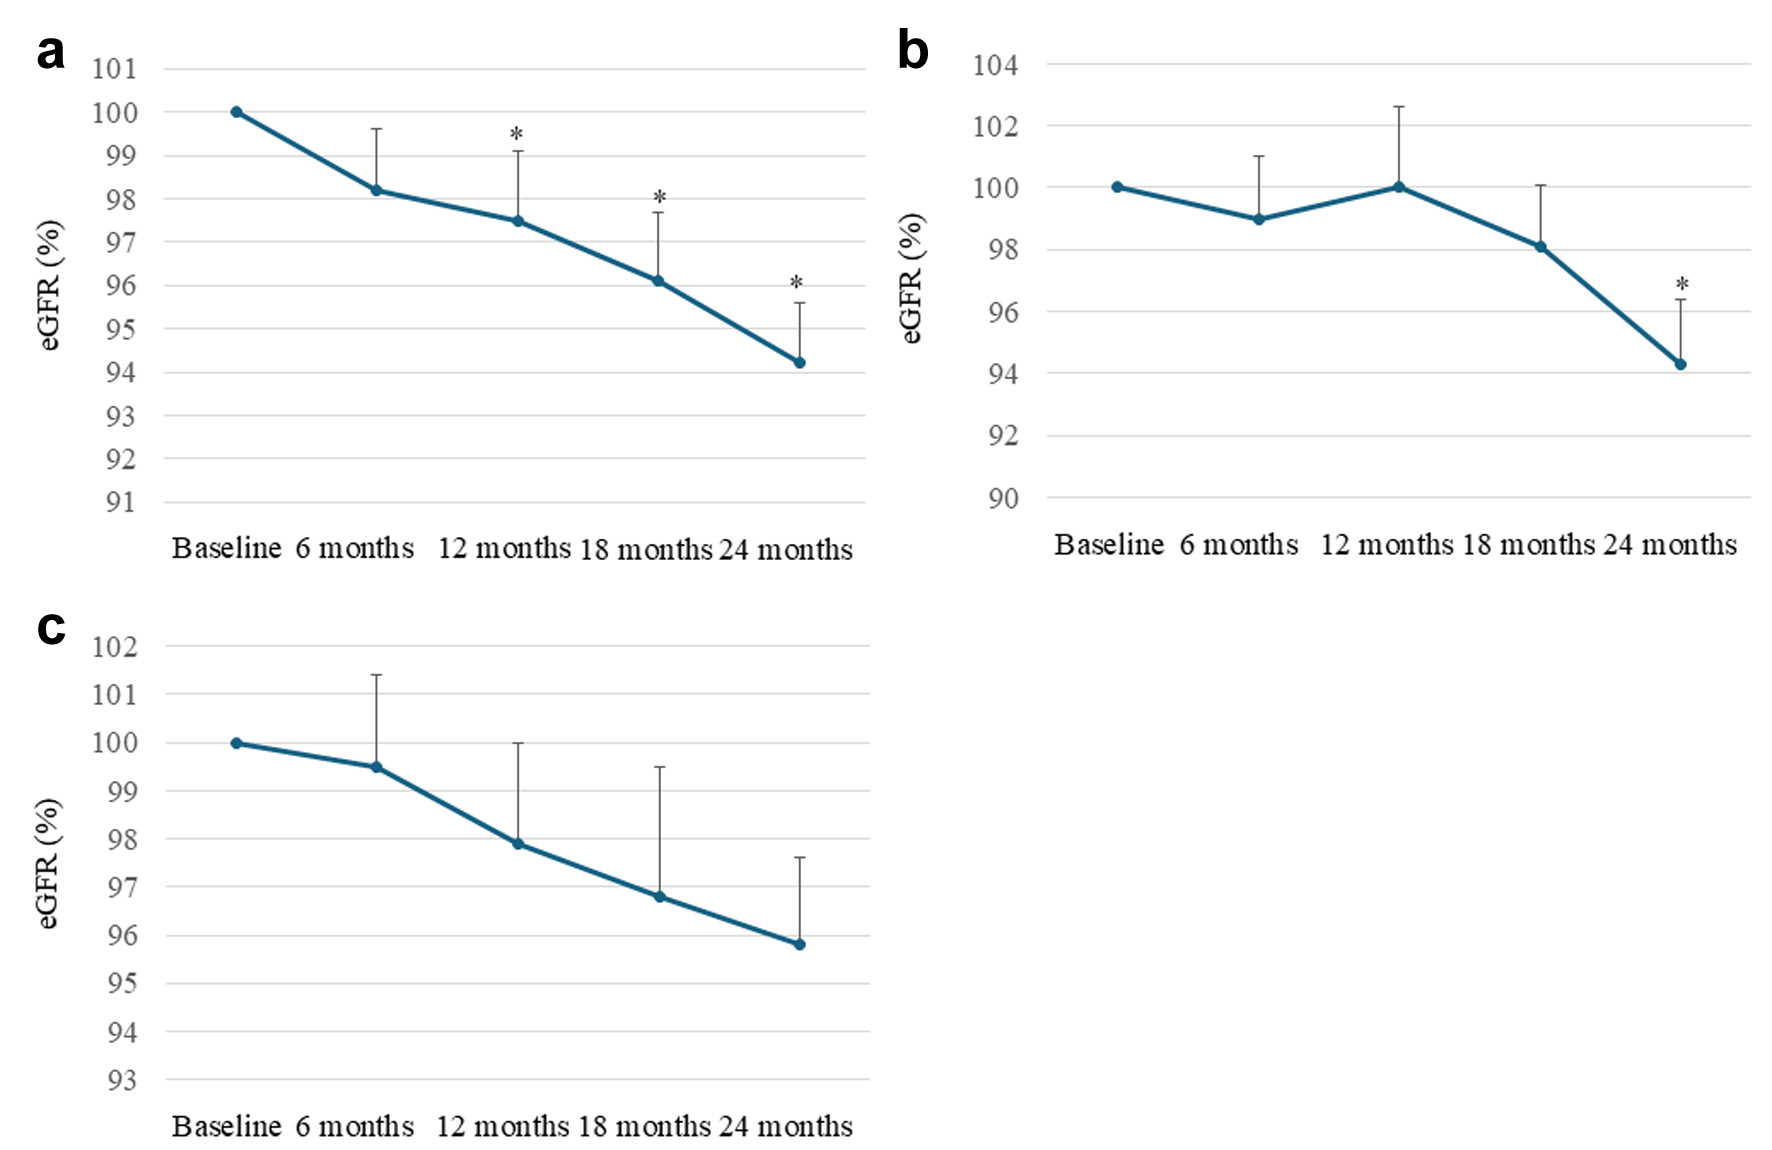
↓ Figure 5. Changes in estimated glomerular
filtration rate (eGFR) after 6, 12, 18, and 24 months from baseline in all patients (a), patients naive
to uric acid (UA)-lowering drugs (b), and patients who switched from xanthine oxidase (XO) inhibitors
(c). We set the baseline data of each patient as 100% and evaluated the changes in eGFR as percent
changes in each observation period. *P < 0.05 vs. baseline. Circles and error bars indicate the mean
± standard error.
Tables
↓ Table 1. Clinical and Laboratory Characteristics of Patients Studied at
Baseline (n = 73)
|
Clinical characteristics |
|
| Presented values indicate mean ± SD. ALT: alanine aminotransferase; AST: aspartate
aminotransferase; GGT: gamma-glutamyl transferase; eGFR: estimated glomerular filtration rate;
HbA1c: hemoglobin A1c; HDL-C: high-density lipoprotein-cholesterol; LDL-C: low-density
lipoprotein-cholesterol; Non-HDL-C: non-high-density lipoprotein-cholesterol; TG: triglyceride; UA:
uric acid. |
| Gender (male/female) |
50/23 |
| Age (years) |
66.1 ± 14.6 |
| Body height (cm) |
162.7 ± 19.9 |
| Body weight (kg) |
76.7 ± 17.4 |
| Body mass index (kg/m2) |
28.3 ± 5.5 |
| Patients with body mass index ≥ 25 kg/m2 (n, %) |
48, 65.8% |
| Systolic blood pressure (mm Hg) |
133.8 ± 20.1 |
| Diastolic blood pressure (mm Hg) |
76.6 ± 12.4 |
| Comorbidities |
|
| Type 2 diabetes |
48, 65.8% |
| Hypertension |
40, 54.8% |
| Dyslipidemia |
44, 60.3% |
| Chronic kidney disease |
50, 70.4% |
| Laboratory characteristics |
Data at baseline |
Normal range |
| Serum UA (mg/dL) |
6.8 ± 1.6 |
< 7 |
| AST (IU/L) |
25.9 ± 9.7 |
13 - 30 |
| ALT (IU/L) |
28.2 ± 19.6 |
Male 10 - 42; Female 7 - 23 |
| GGT (IU/L) |
50.6 ± 49.0 |
Male 13 - 64; Female 9 - 32 |
| HDL-C (mg/dL) |
53.7 ± 15.6 |
< 40 |
| LDL-C (mg/dL) |
100.1 ± 26.8 |
< 140 |
| TG (mg/dL) |
182.6 ± 126.2 |
Non-fasting value < 175 |
| Non-HDL-C (mg/dL) |
130.9 ± 29.7 |
< 170 |
| HbA1c (%) |
6.7 ± 1.6 |
4.9 - 6.0 |
| eGFR (mL/min/1.73 m2) |
61.2 ± 20.4 |
< 60 |
↓ Table 2. Drugs Used for Hyperuricemia Prior to the Initiation of
Dotinurad, and Drugs for Type 2 Diabetes, Hypertension, Dyslipidemia, and Daily Doses of Dotinurad at 24
Months
|
|
n
|
| For hyperuricemia |
|
| Febuxostat |
26 |
| Topiroxostat |
3 |
| Allopurinol |
6 |
| For type 2 diabetes |
|
| Glucagon-like peptide-1 receptor agonists |
18 |
| Sodium glucose co-transporter 2 inhibitors |
31 |
| Metformin |
22 |
| Dipeptidyl peptidase 4 inhibitors |
20 |
| Sulfonylurea |
3 |
| Insulin |
7 |
| Pioglitazone |
7 |
| For hypertension |
|
| Angiotensin II receptor blockers |
30 |
| Calcium channel blockers |
39 |
| For dyslipidemia |
|
| Statins |
49 |
| Peroxisome proliferator-activated receptor alpha agonists
|
17 |
| Daily doses of dotinurad |
|
| 0.5 mg |
23 |
| 1.0 mg |
28 |
| 2.0 mg |
20 |
| 4.0 mg |
2 |
↓ Table 3. Changes in Metabolic Parameters at 6, 12, 18, and 24 Months
After Starting Dotinurad in All Patients
|
|
N
|
Baseline |
After 6 months |
N
|
Baseline |
After 12 months |
N
|
Baseline |
After 18 months |
N
|
Baseline |
After 24 months |
| Presented values indicate mean ± SD. *P < 0.05 vs. baseline values. ALT:
alanine aminotransferase; AST: aspartate aminotransferase; BP: blood pressure; eGFR: estimated
glomerular filtration rate; GGT: gamma-glutamyl transferase; HbA1c: hemoglobin A1c; HDL-C:
high-density lipoprotein-cholesterol; LDL-C: low-density lipoprotein-cholesterol; Non-HDL-C:
non-high-density lipoprotein-cholesterol; TG: triglyceride; UA: uric acid; UACR: urine
albumin/creatinine ratio. |
| Body weight (kg) |
65 |
76.2 ± 17.0 |
75.2 ± 16.3 |
64 |
75.8 ± 17.2 |
75.2 ± 17.1 |
65 |
76.4 ± 17.6 |
75.9 ± 18.0 |
64 |
76.3 ± 17.7 |
75.0 ± 18.0* |
| Systolic BP (mm Hg) |
67 |
133.0 ± 19.8 |
132.5 ± 13.8 |
66 |
132.8 ± 19.9 |
131.3 ± 16.4 |
65 |
132.2 ± 19.3 |
130.6 ± 14.0 |
65 |
133.1 ± 20.2 |
127.9 ± 13.9 |
| Diastolic BP (mm Hg) |
67 |
76.4 ± 12.6 |
76.8 ± 11.0 |
66 |
76.1 ± 12.5 |
74.1 ± 12.5 |
66 |
76.3 ± 12.7 |
75.9 ± 13.0 |
65 |
76.2 ± 12.7 |
73.5 ± 12.8 |
| Serum UA (mg/dL) |
70 |
6.7 ± 1.6 |
5.8 ± 1.2* |
71 |
6.8 ± 1.6 |
5.7 ± 1.0* |
71 |
6.8 ± 1.6 |
5.5 ± 1.2* |
69 |
6.7 ± 1.6 |
5.5 ± 1.4* |
| Urine UA (/creatinine) |
45 |
0.34 ± 0.16 |
0.46 ± 0.26* |
47 |
0.35 ± 0.17 |
0.44 ± 0.24* |
45 |
0.36 ± 0.17 |
0.46 ± 0.20* |
44 |
0.35 ± 0.17 |
0.52 ± 0.23* |
| HbA1c (%) |
65 |
6.7 ± 1.1 |
6.7 ± 0.9 |
67 |
6.7 ± 1.1 |
6.7 ± 0.9 |
67 |
6.7 ± 1.1 |
6.7 ± 0.9 |
64 |
6.7 ± 1.1 |
6.7 ± 0.9 |
| AST (IU/L) |
70 |
26.1 ± 9.9 |
25.0 ± 10.1 |
71 |
26.0 ± 9.9 |
25.1 ± 9.9 |
71 |
26.0 ± 9.9 |
26.5 ± 14.3 |
69 |
25.6 ± 9.1 |
25.1 ± 8.4 |
| ALT (IU/L) |
70 |
28.3 ± 19.9 |
26.1 ± 20.0 |
71 |
28.2 ± 19.8 |
25.3 ± 15.9* |
71 |
28.2 ± 19.8 |
27.1 ± 22.7 |
69 |
27.9 ± 20.0 |
24.6 ± 13.5 |
| GGT (IU/L) |
66 |
51.3 ± 50.0 |
50.0 ± 61.2 |
68 |
51.0 ± 49.2 |
44.0 ± 48.4* |
68 |
51.0 ± 49.2 |
44.7 ± 56.6* |
66 |
48.8 ± 47.1 |
39.7 ± 29.7* |
| TG (mg/dL) |
70 |
182.6 ± 128.3 |
155.9 ± 87.3 |
71 |
183.6 ± 127.7 |
161.7 ± 103.9 |
71 |
183.6 ± 127.7 |
158.9 ± 90.5 |
68 |
183.3 ± 130.5 |
159.1 ± 126.5* |
| HDL-C (mg/dL) |
70 |
53.8 ± 15.6 |
56.6 ± 15.9 |
71 |
53.7 ± 15.8 |
53.4 ± 15.9 |
71 |
53.7 ± 15.8 |
54.5 ± 15.7 |
68 |
53.2 ± 15.3 |
52.7 ± 14.1 |
| LDL-C (mg/dL) |
63 |
98.9 ± 26.5 |
99.8 ± 25.3 |
63 |
98.9 ± 26.5 |
95.9 ± 23.0 |
64 |
99.5 ± 26.7 |
95.7 ± 26.3 |
61 |
99.7 ± 26.1 |
94.7 ± 24.7 |
| Non-HDL-C (mg/dL) |
61 |
130.0 ± 29.7 |
122.9 ± 27.8 |
61 |
130.6 ± 30.6 |
119.8 ± 24.8* |
61 |
130.6 ± 30.6 |
119.1 ± 25.3* |
59 |
131.7 ± 30.4 |
120.3 ± 25.6* |
| eGFR (mL/min/1.73 m2) |
70 |
61.0 ± 18.8 |
59.2 ± 17.5 |
71 |
60.4 ± 19.2 |
58.2 ± 17.7* |
71 |
60.4 ± 19.2 |
57.1 ± 16.7* |
69 |
59.9 ± 18.8 |
56.2 ± 18.0* |
| UACR (/creatinine) |
40 |
227.4 ± 438.3 |
119.3 ± 323.0* |
43 |
300.7 ± 542.4 |
335.0 ± 685.2 |
42 |
259.7 ± 473.9 |
202.6 ± 401.3 |
38 |
267.1 ± 489.8 |
172.2 ± 438.6* |
↓ Table 4. Changes in Metabolic Parameters at 6, 12, 18, and 24 Months
After Starting Dotinurad in Patients Naive to UA-Lowering Drugs
|
|
N
|
Baseline |
After 6 months |
N
|
Baseline |
After 12 months |
N
|
Baseline |
After 18 months |
N
|
Baseline |
After 24 months |
| Presented values indicate mean ± SD. *P < 0.05 vs. baseline values. ALT:
alanine aminotransferase; AST: aspartate aminotransferase; BP: blood pressure; eGFR: estimated
glomerular filtration rate; GGT: gamma-glutamyl transferase; HbA1c: hemoglobin A1c; HDL-C:
high-density lipoprotein-cholesterol; LDL-C: low-density lipoprotein-cholesterol; Non-HDL-C:
non-high-density lipoprotein-cholesterol; TG: triglyceride; UA: uric acid; UACR: urine
albumin/creatinine ratio. |
| Body weight (kg) |
35 |
71.9 ± 17.0 |
71.1 ± 16.2 |
35 |
71.6 ± 17.3 |
71.2 ± 17.1 |
35 |
71.6 ± 17.3 |
71.3 ± 17.6 |
33 |
70.9 ± 17.5 |
69.5 ± 17.6 |
| Systolic BP (mm Hg) |
36 |
133.3 ± 20.2 |
133.9 ± 15.0 |
36 |
133.4 ± 20.4 |
131.8 ± 16.4 |
35 |
132.1 ± 19.1 |
130.5 ± 14.5 |
34 |
133.5 ± 21.0 |
127.9 ± 12.9 |
| Diastolic BP (mm Hg) |
36 |
75.9 ± 13.6 |
77.4 ± 11.4 |
36 |
75.6 ± 13.5 |
73.4 ± 12.8 |
35 |
75.5 ± 13.6 |
76.5 ± 12.3 |
34 |
75.5 ± 13.8 |
72.3 ± 11.1 |
| Serum UA (mg/dL) |
37 |
7.7 ± 1.4 |
5.8 ± 1.1* |
38 |
7.7 ± 1.4 |
5.8 ± 0.9* |
38 |
7.7 ± 1.4 |
5.5 ± 1.2* |
36 |
7.7 ± 1.4 |
5.6 ± 1.5* |
| Urine UA (/creatinine) |
20 |
0.41 ± 0.18 |
0.45 ± 0.23 |
22 |
0.43 ± 0.19 |
0.42 ± 0.22 |
22 |
0.43 ± 0.19 |
0.42 ± 0.21 |
20 |
0.44 ± 0.20 |
0.52 ± 0.23 |
| HbA1c (%) |
35 |
6.8 ± 1.2 |
6.8 ± 0.9 |
36 |
6.8 ± 1.2 |
6.7 ± 0.8 |
36 |
6.8 ± 1.2 |
6.8 ± 0.9 |
34 |
6.9 ± 1.2 |
6.9 ± 0.8 |
| AST (IU/L) |
37 |
25.2 ± 8.6 |
24.6 ± 8.1 |
38 |
25.0 ± 8.5 |
23.9 ± 7.8 |
38 |
25.0 ± 8.5 |
25.1 ± 12.6 |
36 |
24.2 ± 6.6 |
24.1 ± 7.2 |
| ALT (IU/L) |
37 |
25.7 ± 16.7 |
22.9 ± 11.4 |
38 |
25.5 ± 16.5 |
22.3 ± 11.8 |
38 |
25.5 ± 16.5 |
24.1 ± 15.2 |
36 |
24.8 ± 16.7 |
22.4 ± 12.0 |
| GGT (IU/L) |
37 |
45.0 ± 36.8 |
41.4 ± 31.4 |
38 |
44.6 ± 36.3 |
38.9 ± 38.1 |
38 |
44.6 ± 36.3 |
35.4 ± 22.3 |
36 |
40.3 ± 28.6 |
34.7 ± 19.1 |
| TG (mg/dL) |
37 |
192.2 ± 157.3 |
162.2 ± 96.7 |
38 |
194.0 ± 155.5 |
174.0 ± 126.1 |
38 |
194.0 ± 155.5 |
166.4 ± 92.6 |
36 |
193.4 ± 160.0 |
180.6 ± 157.0 |
| HDL-C (mg/dL) |
37 |
51.3 ± 15.8 |
54.9 ± 17.0 |
38 |
51.1 ± 15.6 |
48.6 ± 12.0 |
38 |
51.1 ± 15.6 |
51.5 ± 13.0 |
36 |
50.8 ± 15.1 |
48.8 ± 12.9 |
| LDL-C (mg/dL) |
37 |
105.1 ± 32.0 |
101.5 ± 24.0 |
38 |
105.9 ± 32.0 |
96.7 ± 21.7* |
38 |
105.9 ± 32.0 |
96.4 ± 26.1 |
36 |
105.6 ± 31.7 |
96.4 ± 28.3 |
| Non-HDL-C (mg/dL) |
37 |
122.6 ± 39.4 |
112.0 ± 37.0 |
38 |
124.3 ± 40.2 |
108.6 ± 34.9* |
38 |
124.3 ± 40.2 |
107.6 ± 34.0* |
36 |
127.1 ± 38.4 |
113.1 ± 32.4 |
| eGFR (mL/min/1.73 m2) |
37 |
58.6 ± 17.9 |
55.8 ± 14.1 |
38 |
57.6 ± 18.6 |
55.0 ± 16.0 |
38 |
57.6 ± 18.6 |
53.9 ± 14.5 |
36 |
56.4 ± 17.5 |
51.4 ± 14.7* |
| UACR (/creatinine) |
21 |
276.1 ± 471.7 |
181.3 ± 435.5 |
26 |
323.7 ± 584.1 |
338.1 ± 649.2 |
24 |
269.2 ± 484.2 |
195.0 ± 397.0 |
23 |
252.9 ± 486.7 |
125.9 ± 256.8* |
↓ Table 5. Changes in Metabolic Parameters at 6, 12, 18, and 24 Months
After Starting Dotinurad in Patients Who Switched From XO Inhibitors
|
|
N
|
Baseline |
After 6 months |
N
|
Baseline |
After 12 months |
N
|
Baseline |
After 18 months |
N
|
Baseline |
After 24 months |
| Presented values indicate mean ± SD. *P < 0.05 vs. baseline values. ALT:
alanine aminotransferase; AST: aspartate aminotransferase; BP: blood pressure; eGFR: estimated
glomerular filtration rate; GGT: gamma-glutamyl transferase; HbA1c: hemoglobin A1c; HDL-C:
high-density lipoprotein-cholesterol; LDL-C: low-density lipoprotein-cholesterol; Non-HDL-C:
non-high-density lipoprotein-cholesterol; TG: triglyceride; UA: uric acid; UACR: urine
albumin/creatinine ratio; XO: xanthine oxidase. |
| Body weight (kg) |
30 |
81.3 ± 15.9 |
80.1 ± 15.2 |
29 |
80.8 ± 16.0 |
80.0 ± 16.1 |
30 |
82.0 ± 16.5 |
81.3 ± 17.1 |
31 |
82.0 ± 16.2 |
80.8 ± 16.6 |
| Systolic BP (mm Hg) |
31 |
132.7 ± 19.6 |
130.8 ± 12.3 |
30 |
132.1 ± 19.6 |
130.7 ± 16.5 |
30 |
132.3 ± 19.8 |
130.6 ± 13.5 |
31 |
132.7 ± 19.6 |
127.8 ± 15.1 |
| Diastolic BP (mm Hg) |
31 |
77.1 ± 11.5 |
76.2 ± 10.7 |
30 |
76.7 ± 11.4 |
75.0 ± 12.4 |
30 |
77.2 ± 11.7 |
75.3 ± 14.0 |
31 |
77.1 ± 11.5 |
74.8 ± 15.0 |
| Serum UA (mg/dL) |
33 |
5.7 ± 1.2 |
5.8 ± 1.3 |
33 |
5.7 ± 1.2 |
5.6 ± 1.2 |
33 |
5.7 ± 1.2 |
5.5 ± 1.4 |
33 |
5.7 ± 1.2 |
5.5 ± 1.3 |
| Urine UA (/creatinine) |
25 |
0.28 ± 0.11 |
0.47 ± 0.28* |
25 |
0.28 ± 0.11 |
0.47 ± 0.27* |
23 |
0.28 ± 0.12 |
0.49 ± 0.19* |
24 |
0.28 ± 0.11 |
0.53 ± 0.23* |
| HbA1c (%) |
30 |
6.5 ± 1.0 |
6.6 ± 1.0 |
31 |
6.5 ± 1.0 |
6.6 ± 0.9* |
31 |
6.5 ± 1.0 |
6.6 ± 1.0 |
30 |
6.5 ± 1.0 |
6.6 ± 0.8 |
| AST (IU/L) |
33 |
27.0 ± 11.2 |
25.5 ± 12.1 |
33 |
27.0 ± 11.2 |
26.5 ± 11.8 |
33 |
27.0 ± 11.2 |
28.2 ± 16.0 |
33 |
27.0 ± 11.2 |
26.2 ± 9.4 |
| ALT (IU/L) |
33 |
31.2 ± 22.8 |
29.6 ± 26.3 |
33 |
31.2 ± 28.7 |
28.7 ± 19.2 |
33 |
31.2 ± 22.8 |
30.7 ± 29.0 |
33 |
31.2 ± 22.8 |
27.0 ± 14.9 |
| GGT (IU/L) |
29 |
59.3 ± 62.7 |
60.9 ± 84.9 |
30 |
59.0 ± 61.6 |
50.4 ± 59.0* |
30 |
59.0 ± 61.6 |
56.6 ± 80.6 |
30 |
59.0 ± 61.6 |
45.6 ± 38.3* |
| TG (mg/dL) |
33 |
171.8 ± 86.2 |
148.8 ± 76.2 |
33 |
171.8 ± 86.2 |
147.5 ± 69.5 |
33 |
171.8 ± 86.2 |
150.2 ± 88.6 |
32 |
171.8 ± 87.6 |
135.0 ± 75.1* |
| HDL-C (mg/dL) |
33 |
56.7 ± 15.7 |
58.5 ± 14.7 |
33 |
56.7 ± 15.7 |
59.0 ± 18.2 |
33 |
56.7 ± 15.7 |
58.1 ± 17.9 |
32 |
55.9 ± 15.2 |
57.2 ± 14.2 |
| LDL-C (mg/dL) |
31 |
97.5 ± 26.9 |
100.1 ± 26.8 |
31 |
97.5 ± 26.9 |
97.5 ± 26.1 |
31 |
97.5 ± 26.9 |
95.0 ± 26.6 |
30 |
98.6 ± 26.6 |
96.3 ± 23.9 |
| Non-HDL-C (mg/dL) |
30 |
127.0 ± 26.9 |
122.9 ± 27.1 |
30 |
127.0 ± 26.9 |
118.2 ± 25.6 |
30 |
127.0 ± 26.9 |
119.4 ± 24.6 |
29 |
128.4 ± 27.4 |
118.3 ± 25.4* |
| eGFR (mL/min/1.73 m2) |
33 |
63.7 ± 19.8 |
63.1 ± 20.0 |
33 |
63.7 ± 19.8 |
61.9 ± 19.2 |
33 |
63.7 ± 19.8 |
60.8 ± 18.4* |
33 |
63.7 ± 19.8 |
61.3 ± 20.0 |
| UACR (/creatinine) |
19 |
173.6 ± 404.0 |
50.7 ± 76.4* |
17 |
257.9 ± 485.7 |
330.5 ± 757.5 |
18 |
246.9 ± 473.5 |
212.7 ± 418.4 |
15 |
288.8 ± 510.8 |
243.3 ± 629.1 |