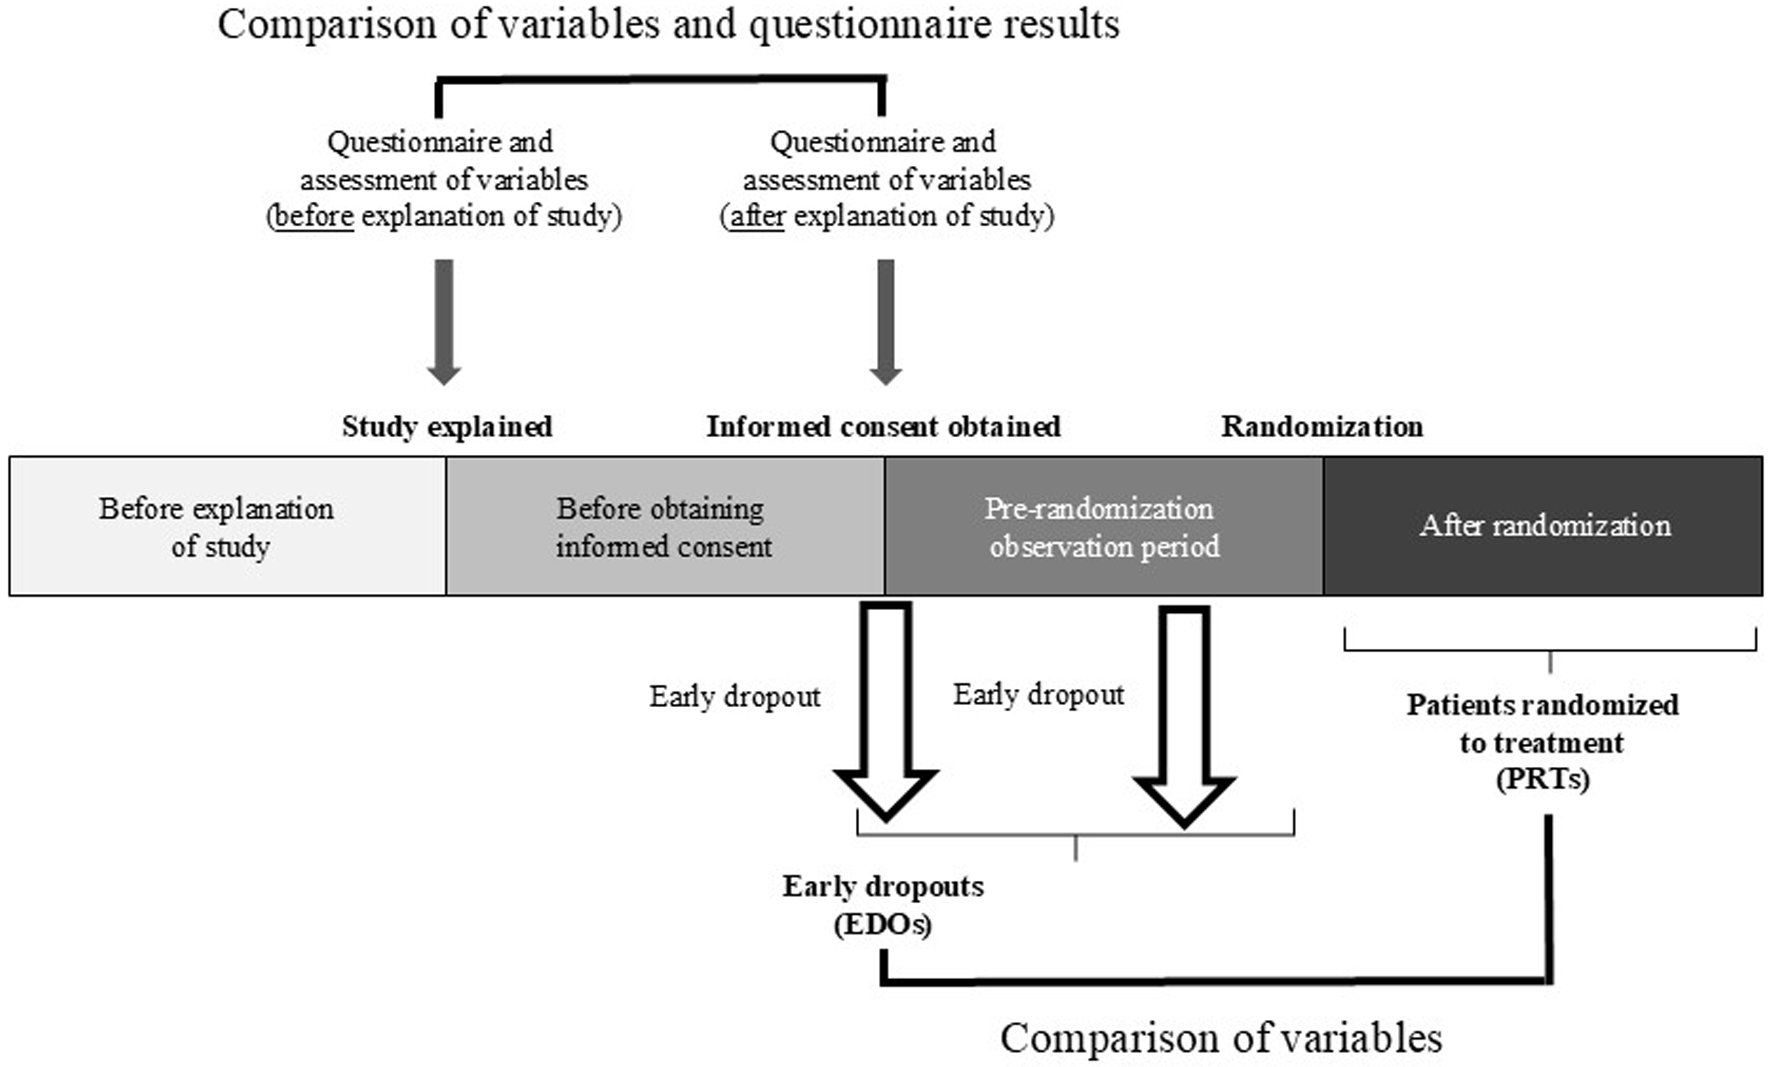
↓ Figure 1. Clinical trial design.
| Journal of Clinical Medicine Research, ISSN 1918-3003 print, 1918-3011 online, Open Access |
| Article copyright, the authors; Journal compilation copyright, J Clin Med Res and Elmer Press Inc |
| Journal website https://jocmr.elmerjournals.com |
Original Article
Volume 17, Number 5, May 2025, pages 247-255
Does Receiving Information on Clinical Trials Affect Patients’ Condition?
Figure
Tables
| Characteristic | Overall (N = 21) | R-HT (N = 7) | Diabetic neuropathy (N = 14) |
|---|---|---|---|
| DBP: diastolic blood pressure; EDOs: early dropouts; eGFR: estimated glomerular filtration rate; HbA1c: hemoglobin A1c; PRTs: patients randomized to treatment; R-HT: treatment-resistant hypertension; SBP: systolic blood pressure; SD: standard deviation; UACR: urine albumin-creatinine ratio. | |||
| Sex, n (%) | |||
| Male | 17 (81.0%) | 4 (57.1%) | 13 (92.9%) |
| Female | 4 (19.0%) | 3 (42.9%) | 1 (7.1%) |
| Age, mean (SD) | 60.7 (12.0) | 53.7 (12.4) | 64.2 (10.5) |
| Entry, n (%) | |||
| EDOs | 6 (28.6%) | 4 (57.1%) | 2 (14.3%) |
| PRTs | 15 (71.4%) | 3 (42.9%) | 12 (85.7%) |
| SBP, mean (SD) | |||
| Before explanation | 150.0 (24.6) | 173.4 (13.9) | 138.2 (19.9) |
| After explanation | 142.9 (19.9) | 152.4 (19.0) | 138.1 (19.2) |
| DBP, mean (SD) | |||
| Before explanation | 85.1 (18.5) | 99.0 (16.1) | 78.1 (15.8) |
| After explanation | 81.9 (16.2) | 86.4 (20.5) | 79.6 (13.8) |
| HbA1c, mean (SD) | |||
| Before explanation | 7.6 (1.7) | 5.6 (0.6) | 8.3 (1.3) |
| Missing | 2 | 2 | 0 |
| After explanation | 7.7 (1.7) | 5.8 (0.4) | 8.4 (1.4) |
| Missing | 2 | 2 | 0 |
| eGFR, mean (SD) | |||
| Before explanation | 56.9 (25.0) | 70.0 (18.3) | 51.3 (26.0) |
| Missing | 1 | 1 | 0 |
| After explanation | 59.8 (29.0) | 75.7 (20.2) | 53.0 (30.1) |
| Missing | 1 | 1 | 0 |
| K, mean (SD) | |||
| Before explanation | 4.35 (0.41) | - | 4.35 (0.41) |
| Missing | 7 | 7 | 0 |
| After explanation | 4.34 (0.43) | - | 4.34 (0.43) |
| Missing | 7 | 7 | 7 |
| UACR, mean (SD) | |||
| Before explanation | 1,790 (2,056) | - | 1,790 (2,056) |
| Missing | 14 | 7 | 7 |
| After explanation | 856.2 (1,045) | - | 856.2 (1,045) |
| Missing | 14 | 7 | 7 |
| n | Geometric mean | Coefficient of variation | Geometric mean of rate of change (after/before) | 95% CI | P value | |
|---|---|---|---|---|---|---|
| BP was measured on the ipsilateral arm with the patient in a sitting position using a validated automated device (OMRON HEM-907; Omron Healthcare Corp., Kyoto, Japan). Before the explanation of the clinical trial, BP was measured once by the attending physician. After explanation, BP was measured two or three times at 1-min intervals by the CRC or nurse and the average was calculated. Early dropouts were patients who became ineligible to participate in the clinical trial after receiving an explanation of the study but before providing informed consent and patients who dropped out during the pre-randomization observation period after providing informed consent, and patients randomized to treatment were patients who provided informed consent and were randomized. We calculated the geometric mean value and coefficient of variation of the parameters and rate of change related to the participation criteria before and after explanation of the two trials. We also calculated the geometric mean value and 95% CI of the rate of change for each participant. The test values before and after explanation were logarithmically transformed, and the changes were evaluated with a paired t-test. Cases with missing data were excluded from the analysis. CI: confidence interval; DBP: diastolic blood pressure; eGFR: estimated glomerular filtration rate; HbA1c: hemoglobin A1c; K: potassium; R-HT: treatment-resistant hypertension; SBP: systolic blood pressure; UACR: urine albumin-creatinine ratio. | ||||||
| SBP, mm Hg | ||||||
| Before explanation | 21 | 148 | 0.164 | 0.955 | 0.862 - 1.059 | 0.3747 |
| After explanation | 21 | 141.4 | 0.139 | |||
| DBP, mm Hg | ||||||
| Before explanation | 21 | 83.1 | 0.217 | 0.965 | 0.840 - 1.107 | 0.6001 |
| After explanation | 21 | 80.2 | 0.198 | |||
| HbA1c, % | ||||||
| Before explanation | 19 | 7.4 | 0.22 | 1.007 | 0.879 - 1.170 | 0.8432 |
| After explanation | 19 | 7.5 | 0.22 | |||
| eGFR, mL/min/1.73 m2 | ||||||
| Before explanation | 20 | 52.1 | 0.44 | 1.007 | 0.766 - 1.381 | 0.8492 |
| After explanation | 20 | 53.5 | 0.486 | |||
| K, mmol/L | ||||||
| Before explanation | 14 | 4.33 | 0.094 | 0.999 | 0.927 - 1.075 | 0.9609 |
| After explanation | 14 | 4.32 | 0.099 | |||
| UACR, mg/g | ||||||
| Before explanation | 7 | 900 | 1.149 | 0.898 | 0.115 - 2.175 | 0.3241 |
| After explanation | 7 | 450 | 1.22 | |||
| Both clinical trials | Trial on resistant hypertension | Trial on diabetic nephropathy | ||||||||||
|---|---|---|---|---|---|---|---|---|---|---|---|---|
| N = 21 | Difference | 95% CI | P value | n = 7 | Difference | 95% CI | P value | n = 14 | Difference | 95% CI | P value | |
| *P < 0.05. The 95% CI was calculated for the difference in variables. Differences in variables before and after explanation of one of the trials were evaluated with a paired t-test. Cases with missing data were excluded from the analysis. CI: confidence interval; DBP: diastolic blood pressure; R-HT: treatment-resistant hypertension; SBP: systolic blood pressure. | ||||||||||||
| SBP before explanation | 149.95 | 7.05 | 2.51 - 16.61 | 0.140 | 173.43 | 21.00 | 0.77 - 41.23 | 0.044* | 138.21 | 0.071 | 9.94 - 10.08 | 0.988 |
| SBP after explanation | 142.90 | 152.43 | 138.14 | |||||||||
| DBP before explanation | 85.10 | 3.24 | 2.35 - 8.82 | 0.241 | 99.00 | 12.57 | 0.23 - 24.91 | 0.047* | 78.14 | -1.43 | 6.57 - 3.71 | 0.558 |
| DBP after explanation | 81.86 | 86.43 | 79.57 | |||||||||
| Variable | EDOs | PRTs | Geometric mean ratio (PRTs/EDOs) | 95% CI | P value | ||||
|---|---|---|---|---|---|---|---|---|---|
| N | Geometric mean of rate of change | Coefficient of variation | N | Geometric mean of rate of change | Coefficient of variation | ||||
| The geometric mean and coefficient of variation of rate of change were calculated. Rates of change were compared by a covariance analysis model with the logarithmically transformed rate of change as the response variable and the logarithmically transformed baseline value as the explanatory variable. From the results of the covariance analysis, we calculated the geometric mean ratio and 95% CI of the rate of change adjusted by the baseline value. CI: confidence interval; DBP: diastolic blood pressure; EDOs: early dropouts; eGFR: estimated glomerular filtration rate; HbA1c: hemoglobin A1c; K: potassium; PRTs: patients randomized to treatment; SBP: systolic blood pressure; UACR: urine albumin-creatinine ratio. | |||||||||
| SBP | 6 | 0.894 | 0.163 | 15 | 0.981 | 0.124 | 1.065 | 0.935 - 1.213 | 0.3226 |
| DBP | 6 | 0.944 | 0.158 | 15 | 0.973 | 0.150 | 1.016 | 0.875 - 1.179 | 0.8285 |
| HbA1c | 4 | 1.014 | 0.046 | 15 | 1.014 | 0.059 | 1.005 | 0.940 - 1.075 | 0.8730 |
| eGFR | 5 | 0.999 | 0.053 | 15 | 1.038 | 0.108 | 1.011 | 0.913 - 1.121 | 0.8205 |
| K | 2 | 1.073 | 0.100 | 12 | 0.986 | 0.142 | 0.894 | 0.763 - 1.046 | 0.1451 |
| UACR | 1 | 0.415 | - | 6 | 0.516 | 0.471 | 0.679 | 0.044 - 10.5 | 0.7150 |
| Type of guidance given by medical staff | Before receiving explanation | After providing informed consent | ||||||
|---|---|---|---|---|---|---|---|---|
| Received guidance, n | % | Put into practice, n | %a | Received guidance, n | % | Put into practice, n | %a | |
| Patients received information about a double-blind clinical trial on treatment-resistant hypertension or one on diabetic nephropathy. Data are shown for patients who dropped out after providing informed consent and those who were randomized to treatment. aRatio of the number of people who put the guidance into practice to the number of people who received guidance. | ||||||||
| Dietary guidance | 17 | 81.0 | 8 | 47.1 | 16 | 76.2 | 10 | 62.5 |
| Salt reduction guidance | 12 | 57.1 | 4 | 33.3 | 9 | 42.9 | 3 | 33.3 |
| Exercise guidance | 15 | 71.4 | 7 | 46.7 | 13 | 61.9 | 9 | 69.2 |
| Smoking cessation guidance | 5 | 23.8 | 3 | 60.0 | 4 | 19.0 | 2 | 50.0 |
| Guidance on alcohol consumption | 5 | 23.8 | 2 | 40.0 | 5 | 23.8 | 3 | 60.0 |
| Did not receive any guidance | 0 | 0.0 | - | - | 2 | 9.5 | - | - |
| Expectations | Number of patients ranking expectation as first, second, or third before receiving explanation | Number of patients ranking expectation as first, second, or third after providing informed consent | ||||
|---|---|---|---|---|---|---|
| First | Second | Third | First | Second | Third | |
| Data are shown for patients who dropped out after providing informed consent and those who were randomized to treatment. CRC: clinical research coordinator. | ||||||
| Trial treatment may be effective | 11 | 2 | 1 | 7 | 3 | 1 |
| Will receive a detailed medical examination | 3 | 8 | 1 | 5 | 7 | 2 |
| Will take a proactive approach to the disease | 1 | 3 | 1 | 2 | 3 | 3 |
| Will feel safe because CRC will always follow the patient | 2 | 0 | 4 | 2 | 3 | 2 |
| Medical costs will be low | 3 | 2 | 0 | 4 | 1 | 2 |
| Will receive burden relief compensation | 0 | 2 | 1 | 0 | 2 | 1 |
| Will contribute to the development of new treatments | 1 | 3 | 3 | 0 | 1 | 4 |
| No particular expectations | 0 | 0 | 0 | 0 | 0 | 0 |
| Patient concerns | Number of patients ranking expectation as first, second, or third before receiving explanation | Number of patients ranking expectation as first, second, or third after providing informed consent | ||||
|---|---|---|---|---|---|---|
| First | Second | Third | First | Second | Third | |
| Data are shown for patients who dropped out after providing informed consent and those who were randomized to treatment. The table shows the changes in the number of patients ranking the concerns as the first, second, or third most important. Before the clinical trial, patients were most concerned about side effects, but once they had provided informed consent, the percentage of worries decreased significantly. | ||||||
| Worried about side effects | 4 | 1 | 0 | 1 | 0 | 0 |
| Time constraints for visiting the hospital will be troublesome | 0 | 1 | 0 | 0 | 0 | 0 |
| Anxiety about effectiveness | 0 | 1 | 1 | 0 | 2 | 0 |
| Worried about enrollment as the placebo/sham group | 0 | 0 | 1 | 1 | 0 | 1 |
| Dissatisfied with the response of medical staff | 0 | 0 | 0 | 0 | 0 | 0 |
| Wish to continue the same treatment even after the trial ended | 1 | 0 | 0 | 1 | 0 | 0 |
| Medical costs did not come down as much as expected | 1 | 0 | 0 | 1 | 0 | 0 |
| No particular concerns or complaints | 14 | 0 | 0 | 16 | 0 | 0 |
| Change in health-related behavior | n | % | Early dropouts | Patients randomized to treatment |
|---|---|---|---|---|
| Early dropouts were patients who became ineligible to participate in the clinical trial after receiving an explanation of the study but before providing informed consent and patients who dropped out during the pre-randomization observation period after providing informed consent, and patients randomized to treatment were patients who provided informed consent and were randomized. | ||||
| Became more proactive than only during treatment | 8 | 38.1 | 4 | 4 |
| Became more involved than only during treatment | 8 | 38.1 | 0 | 8 |
| No change | 5 | 23.8 | 2 | 3 |
| Became passive | 0 | 0.0 | 0 | 0 |