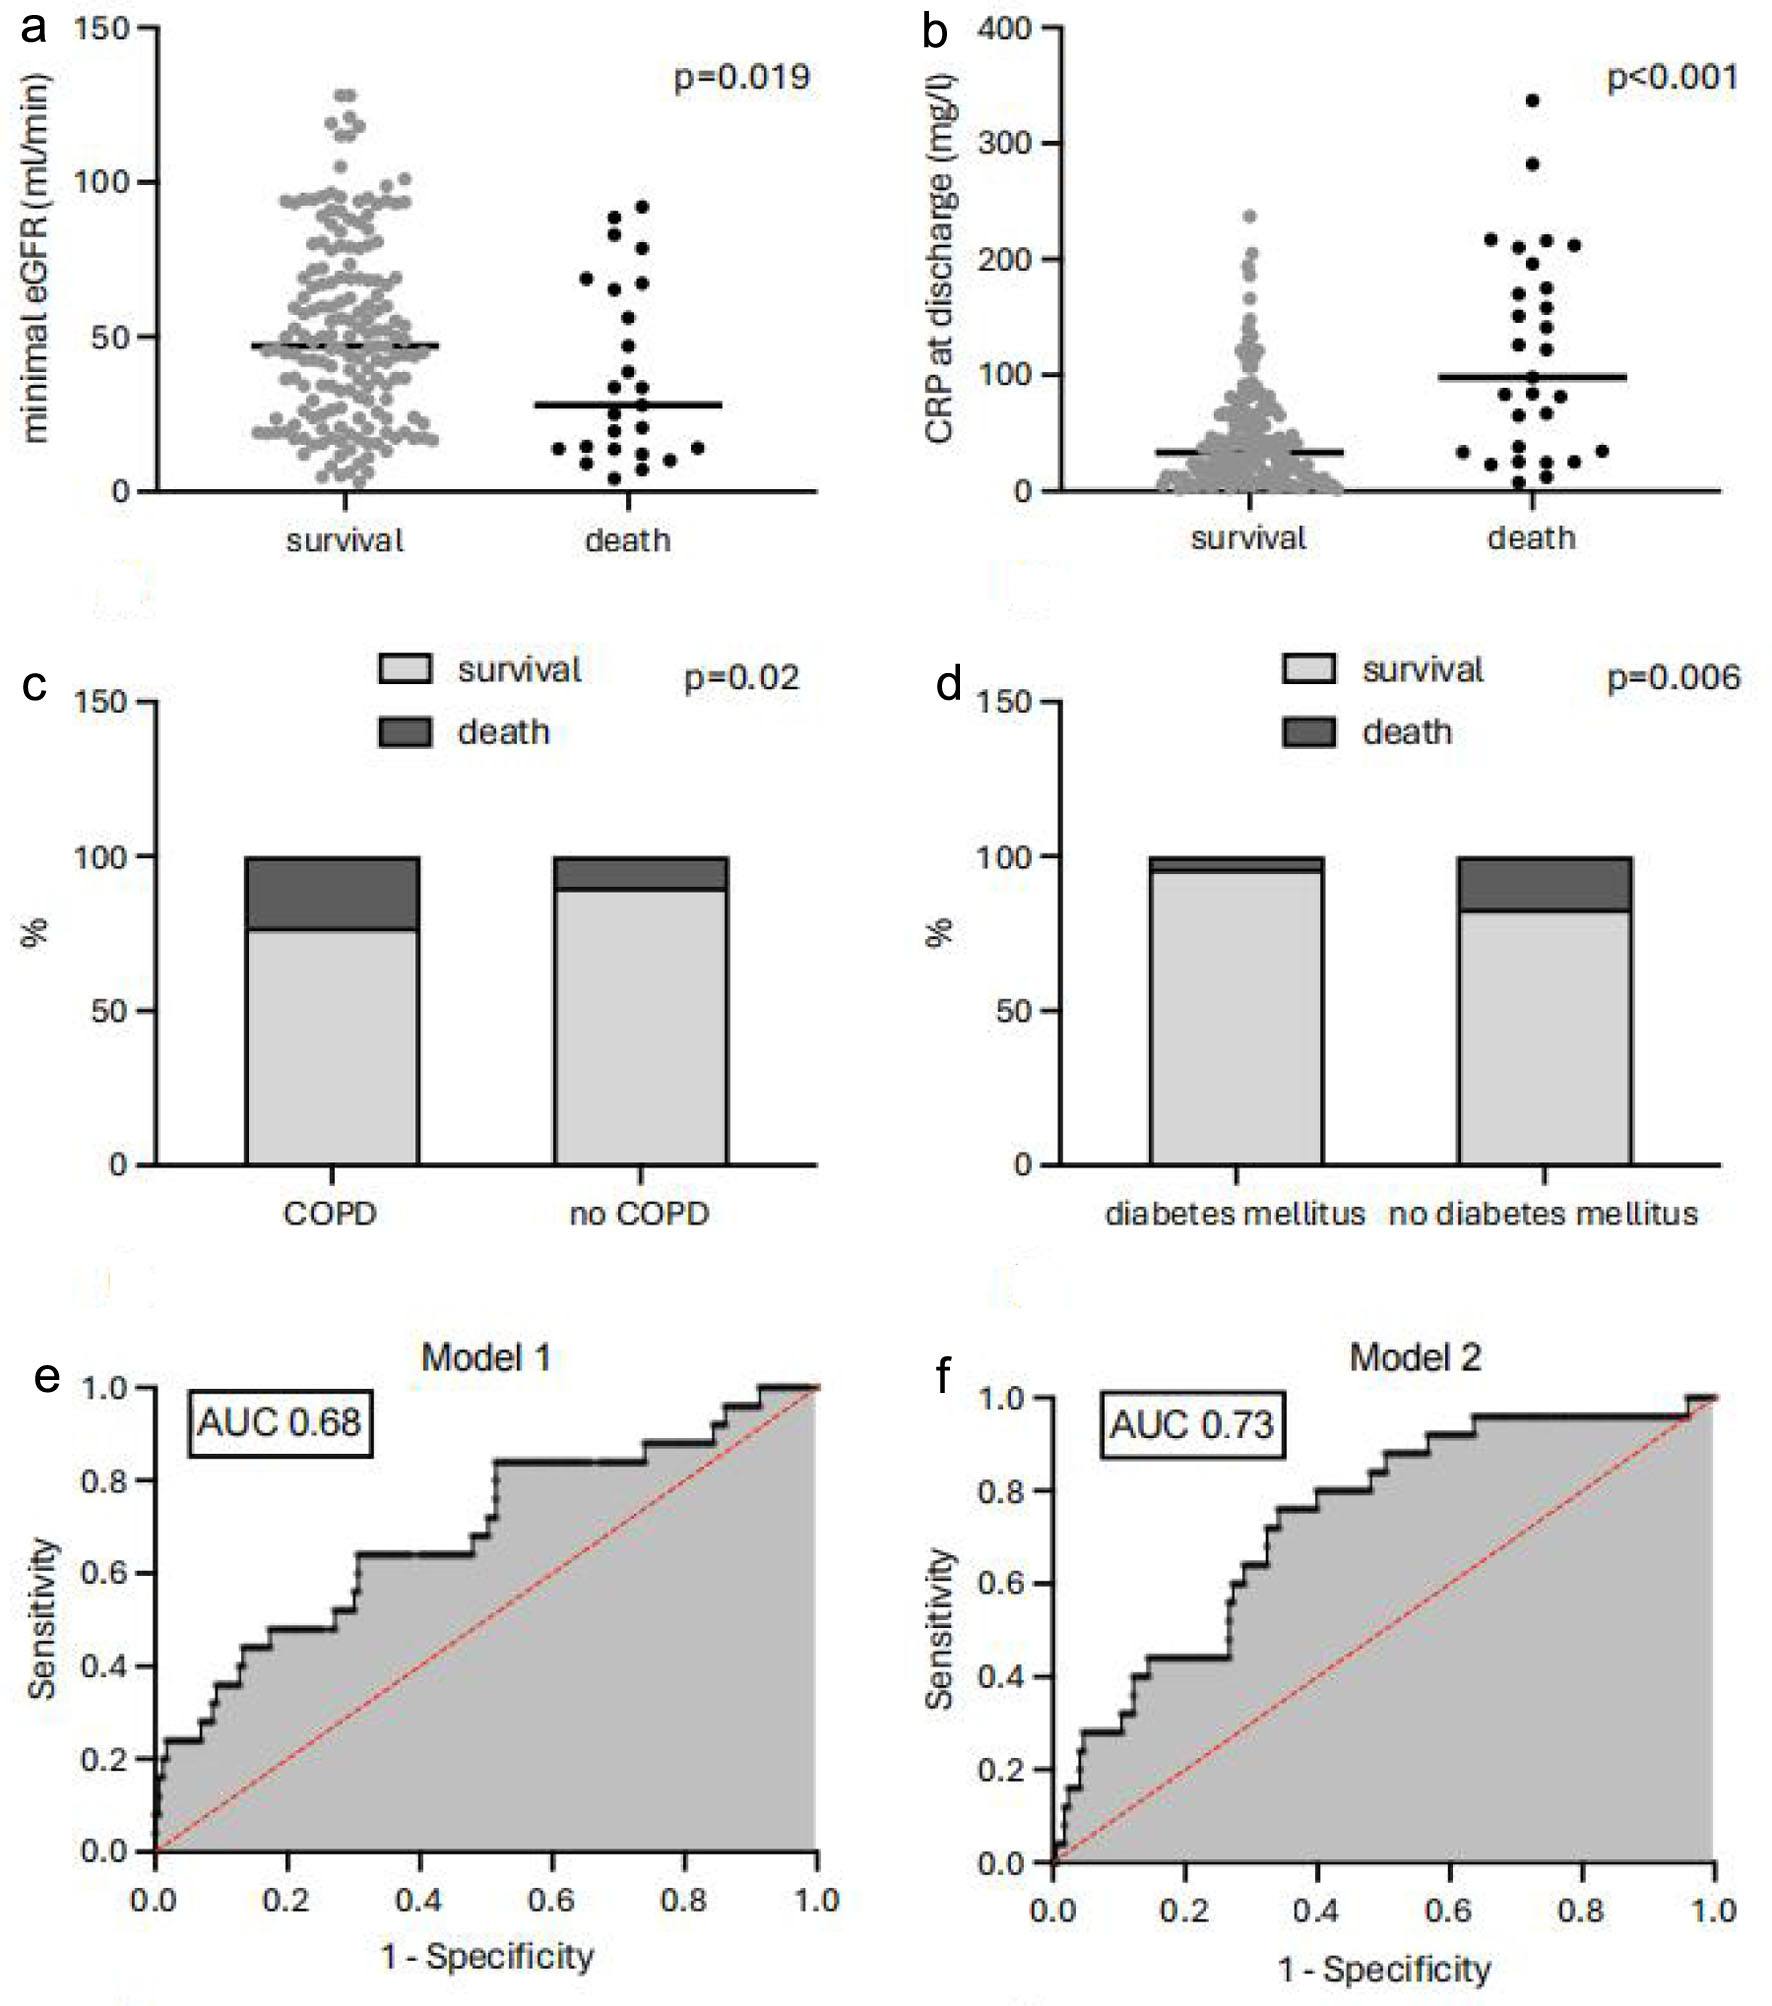
↓ Figure 1. Key results of the survival analysis. Deceased individuals had a lower minimum eGFR (a), a higher peak CRP (b), and suffered more from COPD (c) but less from diabetes mellitus (d). (e, f) AUC of the two logistic regression models.
| Journal of Clinical Medicine Research, ISSN 1918-3003 print, 1918-3011 online, Open Access |
| Article copyright, the authors; Journal compilation copyright, J Clin Med Res and Elmer Press Inc |
| Journal website https://jocmr.elmerjournals.com |
Original Article
Volume 18, Number 10, October 2026, pages 728-736
Diabetes Mellitus Independently Predicts Survival in Beta-Lactam-Associated Hypokalemia
Figure
Tables
| Variable | NBLA | HBLA | P-value |
|---|---|---|---|
| *P < 0.05 (statistical significance). AF: atrial fibrillation; BMI: body mass index; CAD: coronary artery disease; COPD: chronic obstructive pulmonary disease; CRP: C-reactive protein; DM: diabetes mellitus; eGFR: estimated glomerular filtration rate; HBLA: hypokalemia under beta-lactam therapy; HF: heart failure; NBLA: normokalemia under beta-lactam therapy; SD: standard deviation. | |||
| Age, years (mean ± SD) | 69.4 ± 1.5 | 73.9 ± 0.9 | 0.05 |
| Gender, female (%) | 32.3 | 46 | 0.015* |
| In-hospital therapy, days (mean ± SD) | 13 ± 0.9 | 19.3 ± 0.8 | < 0.001* |
| BMI, kg/m2 (mean ± SD) | 27.2 ± 0.6 | 27.2 ± 0.5 | 0.9 |
| In-hospital survival (%) | 96 | 87.4 | 0.01* |
| Administration of diuretics (%) | 39.5 | 57.6 | 0.002* |
| Diarrhea (%) | 2.4 | 7.6 | 0.05 |
| Polyuria, not induced by diuretics (%) | 0 | 1 | 0.99 |
| Dehydration (%) | 18.5 | 21.2 | 0.56 |
| Morbidities (%) | |||
| Cirrhosis | 0.8 | 9.6 | 0.001* |
| Arterial hypertension | 78.2 | 82.8 | 0.35 |
| CAD | 21.8 | 22.7 | 0.8 |
| HF | 22.6 | 40.4 | < 0.001* |
| AF | 15.3 | 34.3 | < 0.001* |
| COPD | 17.7 | 19.2 | 0.75 |
| DM | 26.6 | 36.9 | 0.05 |
| Obesity | 75.8 | 73.7 | 0.67 |
| History of neoplasia | 23.4 | 27.3 | 0.43 |
| Smoking (%) | 91.1 | 86.3 | 0.19 |
| Laboratory findings | |||
| Initial serum sodium, mmol/L (mean ± SD) | 136.2 ± 0.4 | 136.6 ± 0.4 | 0.36 |
| Minimal serum sodium, mmol/L (mean ± SD) | 135.5 ± 0.4 | 133.7 ± 0.3 | < 0.001* |
| Serum sodium at discharge, mmol/L (mean ± SD) | 139.2 ± 0.3 | 140.3 ± 0.4 | 0.19 |
| Initial eGFR, mL/min (mean ± SD) | 64 ± 2.7 | 60 ± 2 | 0.29 |
| Minimal eGFR, mL/min (mean ± SD) | 59.1 ± 2.8 | 49.8 ± 2.1 | 0.01* |
| eGFR at discharge, mL/min (mean ± SD) | 67.6 ± 2.9 | 72.2 ± 2.2 | 0.29 |
| Initial CRP, mg/L (mean ± SD) | 85.5 ± 7.9 | 101.9 ± 7.7 | 0.41 |
| Peak CRP, mg/L (mean ± SD) | 131.1 ± 8.4 | 185.3 ± 7.5 | < 0.001* |
| CRP at discharge, mg/L (mean ± SD) | 38.3 ± 3.5 | 56.6 ± 4.2 | 0.01* |
| Variable | Survival | Death | P-value |
|---|---|---|---|
| *P < 0.05 (statistical significance). A total of five significant differences between the two cohorts were identified, and four variables were included in the logistic regression analysis. AF: atrial fibrillation; BMI: body mass index; CAD: coronary artery disease; COPD: chronic obstructive pulmonary disease; CRP: C-reactive protein; DM: diabetes mellitus; eGFR: estimated glomerular filtration rate; HF: heart failure; SD: standard deviation. | |||
| Age, years (mean ± SD) | 73.4 ± 1 | 77.4 ± 2.1 | 0.27 |
| Gender, female (%) | 46.8 | 40 | 0.52 |
| in-hospital therapy, days (mean ± SD) | 19.6 ± 0.9 | 17.2 ± 1.5 | 0.73 |
| BMI, kg/m2 (mean ± SD) | 27.4 ± 0.6 | 26 ± 1.3 | 0.39 |
| Administration of diuretics (%) | 56 | 57.8 | 0.86 |
| Diarrhea (%) | 8.7 | 0 | 0.12 |
| Polyuria, not induced by diuretics (%) | 1.2 | 0 | 0.58 |
| Dehydration (%) | 21.4 | 20 | 0.87 |
| Morbidities (%) | |||
| Cirrhosis | 8.7 | 16 | 0.24 |
| Arterial hypertension | 83.2 | 80 | 0.68 |
| CAD | 20.8 | 36 | 0.09 |
| HF | 42.2 | 28 | 0.17 |
| AF | 34.1 | 36 | 0.85 |
| COPD | 16.8 | 36 | 0.02* |
| DM | 40.5 | 12 | 0.006* |
| Obesity | 73.4 | 76 | 0.78 |
| History of neoplasia | 24.3 | 48 | 0.013* |
| Smoking (%) | 13.4 | 16 | 0.72 |
| Laboratory findings | |||
| Minimal serum potassium, mmol/L (mean ± SD) | 3.14 ± 0.02 | 3.16 ± 0.05 | 0.65 |
| Initial serum sodium, mmol/L (mean ± SD) | 136.5 ± 0.4 | 137.3 ± 1.2 | 0.53 |
| Minimal serum sodium, mmol/L (mean ± SD) | 133.8 ± 0.4 | 133.1 ± 1 | 0.34 |
| Serum sodium at discharge, mmol/L (mean ± SD) | 139.8 ± 2.2 | 143.7 ± 2.2 | 0.36 |
| Initial eGFR, mL/min (mean ± SD) | 61.2 ± 2.2 | 51.4 ± 5.5 | 0.14 |
| Minimal eGFR, mL/min (mean ± SD) | 51.5 ± 2.2 | 37.7 ± 5.7 | 0.019* |
| eGFR at discharge, mL/min (mean ± SD) | 73.1 ± 2.3 | 66.8 ± 7.3 | 0.51 |
| Initial CRP, mg/L (mean ± SD) | 98.9 ± 8 | 122 ± 25 | 0.42 |
| Peak CRP, mg/L (mean ± SD) | 179.8 ± 7.8 | 222.7 ± 23.4 | 0.06 |
| CRP at discharge, mg/L (mean ± SD) | 45.4 ± 3.3 | 129.8 ± 17.6 | < 0.001* |
| Variable | Odds ratio | 95% CI |
|---|---|---|
| Two models were used, the only difference between the models was the inclusion of either COPD (model 1) or diabetes mellitus (model 2) as an independent variable. In both models, age, sex, use of diuretics, and the minimum eGFR during inpatient treatment were defined as additional independent variables. CI: confidence interval; COPD: chronic obstructive pulmonary disease; eGFR: estimated glomerular filtration rate. | ||
| Model 1: endpoint – survival; variables - age, gender, diuretics in use, minimal eGFR, COPD | ||
| Age | 1.017 | 0.9803 to 1.059 |
| Female gender | 0.5758 | 0.2213 to 1.424 |
| Diuretics | 0.5811 | 0.2288 to 1.481 |
| Minimal eGFR | 0.9784 | 0.9598 to 0.9960 |
| COPD | 3.318 | 1.246 to 8.605 |
| Model 2: endpoint – survival; variables - age, gender, diuretics in use, minimal eGFR, diabetes mellitus | ||
| Age | 1.015 | 0.9776 to 1.058 |
| Female gender | 0.5825 | 0.2256 to 1.434 |
| Diuretics | 0.6105 | 0.2421 to 1.549 |
| Minimal eGFR | 0.9803 | 0.9609 to 0.9986 |
| (no) diabetes mellitus | 4.805 | 1.556 to 21.11 |