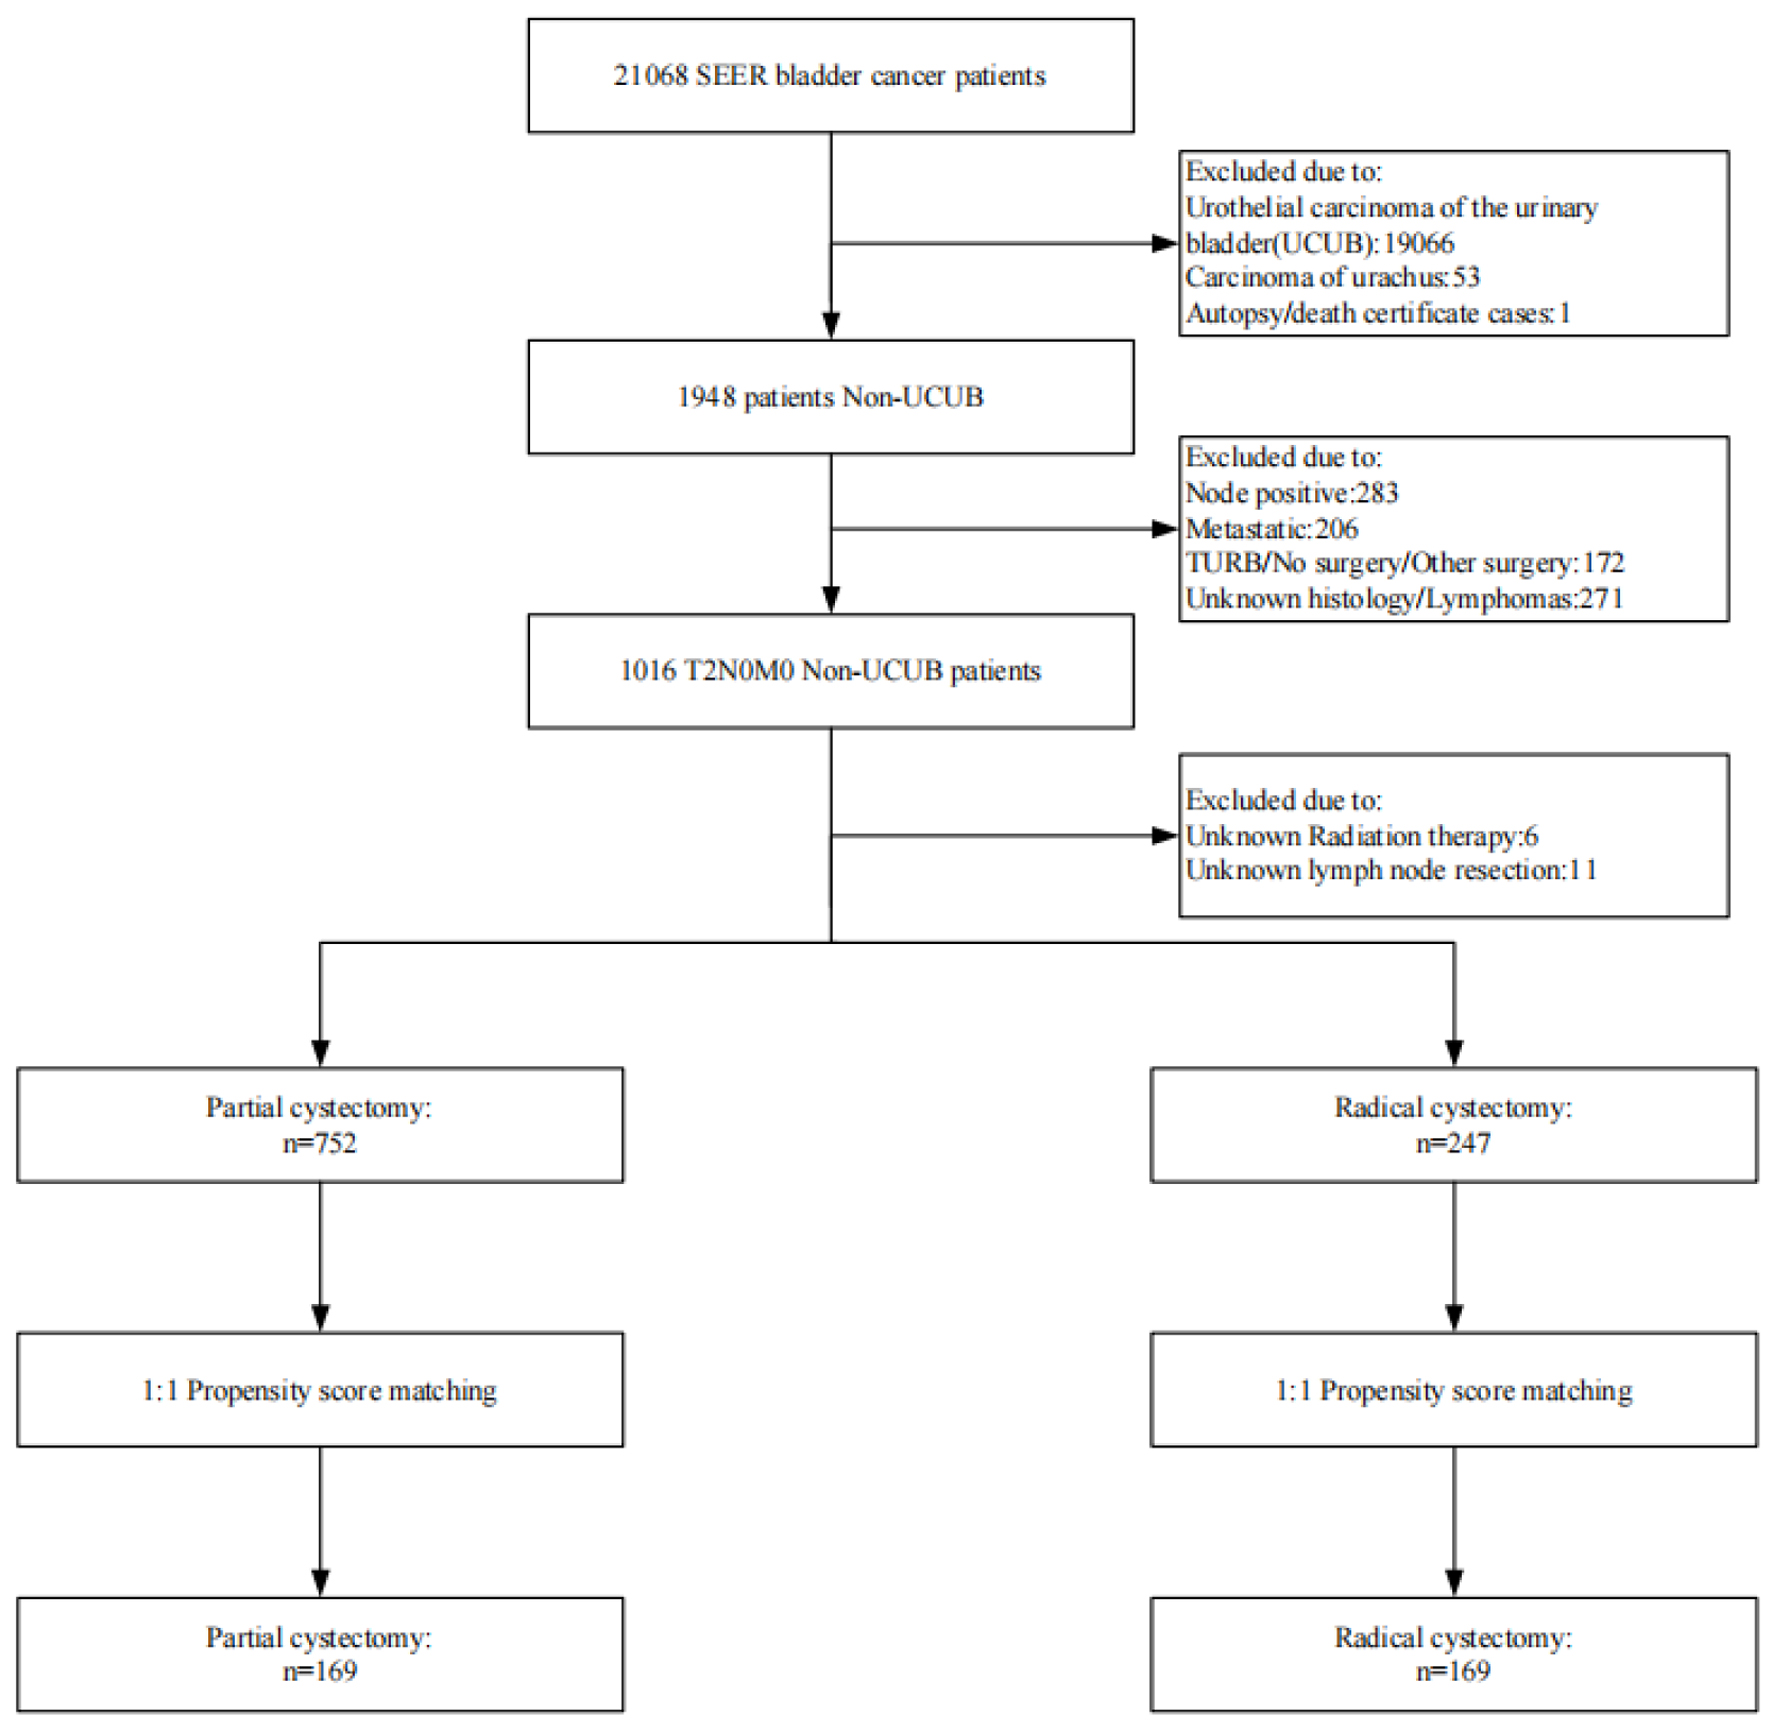
↓ Figure 1. Flowchart of study cohort.
| Journal of Clinical Medicine Research, ISSN 1918-3003 print, 1918-3011 online, Open Access |
| Article copyright, the authors; Journal compilation copyright, J Clin Med Res and Elmer Press Inc |
| Journal website https://jocmr.elmerjournals.com |
Original Article
Volume 17, Number 6, June 2025, pages 334-343
Survival After Partial Cystectomy Versus Radical Cystectomy for Non-Urothelial Carcinoma of the Bladder: A Population-Based Study
Figures
Tables
| Variables | Groups, N (%) | |||||
|---|---|---|---|---|---|---|
| Crude dataset | Matched dataset | |||||
| PC (n = 752) | RC (n = 247) | P | PC (n = 169) | RC (n = 169) | P | |
| PC: partial cystectomy; RC: radical cystectomy. | ||||||
| Age | ||||||
| < 65 | 120 (16.0%) | 90 (36.4%) | < 0.001 | 42 (24.9%) | 46 (27.2%) | 0.71 |
| ≥ 65 | 632 (84.0%) | 157 (63.6%) | 127 (75.1%) | 123 (72.8%) | ||
| Gender | ||||||
| Female | 301 (40.0%) | 83 (33.6%) | 0.0845 | 55 (32.5%) | 60 (35.5%) | 0.646 |
| Male | 451 (60.0%) | 164 (66.4%) | 114 (67.5%) | 109 (64.5%) | ||
| Race | ||||||
| Black | 72 (9.6%) | 17 (6.9%) | 0.436 | 6 (3.6%) | 15 (8.9%) | 0.0342 |
| Other | 35 (4.7%) | 12 (4.9%) | 12 (7.1%) | 5 (3.0%) | ||
| White | 645 (85.8%) | 218 (88.3%) | 151 (89.3%) | 149 (88.2%) | ||
| Marital status | ||||||
| Married | 363 (48.3%) | 161 (65.2%) | < 0.001 | 105 (62.1%) | 103 (60.9%) | 0.911 |
| Unmarried | 389 (51.7%) | 86 (34.8%) | 64 (37.9%) | 66 (39.1%) | ||
| Grade | ||||||
| Grade I | 22 (2.9%) | 11 (4.5%) | 0.0018 | 7 (4.1%) | 4 (2.4%) | 0.811 |
| Grade II | 145 (19.3%) | 54 (21.9%) | 39 (23.1%) | 38 (22.5%) | ||
| Grade III | 340 (45.2%) | 78 (31.6%) | 62 (36.7%) | 62 (36.7%) | ||
| Grade IV | 245 (32.6%) | 104 (42.1%) | 61 (36.1%) | 65 (38.5%) | ||
| Histological subtypes | ||||||
| Adenocarcinoma | 139 (18.5%) | 54 (21.9%) | 0.677 | 37 (21.9%) | 37 (21.9%) | 0.762 |
| Neuroendocrine carcinoma | 188 (25.0%) | 61 (24.7%) | 42 (24.9%) | 45 (26.6%) | ||
| Other | 109 (14.5%) | 32 (13.0%) | 19 (11.2%) | 24 (14.2%) | ||
| Squamous carcinoma | 316 (42.0%) | 100 (40.5%) | 71 (42.0%) | 63 (37.3%) | ||
| T stage | ||||||
| T2a | 189 (25.1%) | 68 (27.5%) | < 0.001 | 52 (30.8%) | 50 (29.6%) | 0.831 |
| T2b | 130 (17.3%) | 98 (39.7%) | 44 (26.0%) | 49 (29.0%) | ||
| T2NOS | 433 (57.6%) | 81 (32.8%) | 73 (43.2%) | 70 (41.4%) | ||
| Lymph node dissection | ||||||
| No | 748 (99.5%) | 19 (7.7%) | < 0.001 | 168 (99.4%) | 11 (6.5%) | < 0.001 |
| Yes | 4 (0.5%) | 228 (92.3%) | 1 (0.6%) | 158 (93.5%) | ||
| Radiation therapy | ||||||
| None/unknown | 564 (75.0%) | 242 (98.0%) | < 0.001 | 165 (97.6%) | 164 (97.0%) | 1 |
| Yes | 188 (25.0%) | 5 (2.0%) | 4 (2.4%) | 5 (3.0%) | ||
| Chemotherapy | ||||||
| No/unknown | 505 (67.2%) | 155 (62.8%) | 0.234 | 111 (65.7%) | 107 (63.3%) | 0.733 |
| Yes | 247 (32.8%) | 92 (37.2%) | 58 (34.3%) | 62 (36.7%) | ||
| Variables | Overall survival | Cancer-specific survival | ||||
|---|---|---|---|---|---|---|
| Univariate P | Multivariate P | Hazard ratio (95% CI) | Univariate P | Multivariate P | Hazard ratio (95% CI) | |
| CI: confidence interval. | ||||||
| Age | ||||||
| < 65 | Ref. | Ref. | Ref. | Ref. | Ref. | Ref. |
| ≥ 65 | < 0.001 | 0.002 | 1.71 (1.24 - 2.35, P = 0.001) | < 0.001 | < 0.001 | 3.01 (1.66 - 5.44, P < 0.001) |
| Gender | ||||||
| Female | Ref. | Ref. | ||||
| Male | 0.723 | 0.847 | ||||
| Race | ||||||
| Black | Ref. | Ref. | ||||
| Other | 0.698 | 0.415 | ||||
| White | 0.972 | 0.572 | ||||
| Marital status | ||||||
| Married | Ref. | Ref. | Ref. | Ref. | Ref. | Ref. |
| Unmarried | 0.017 | 0.002 | 1.50 (1.15 - 1.94, P = 0.002) | 0.002 | < 0.001 | 2.21 (1.47 - 3.32, P < 0.001) |
| Grade | ||||||
| Grade I | Ref. | Ref. | Ref. | |||
| Grade II | 0.204 | 0.536 | 0.787 | |||
| Grade III | 0.059 | 0.198 | 0.391 | |||
| Grade IV | 0.024 | 0.141 | 0.326 | |||
| Histologic subtype | ||||||
| Adenocarcinoma | Ref. | Ref. | ||||
| Neuroendocrine carcinoma | 0.902 | 0.608 | ||||
| Other | 0.353 | 0.968 | ||||
| Squamous carcinoma | 0.054 | P = 0.504 | ||||
| T stage | ||||||
| T2a | Ref. | Ref. | Ref. | Ref. | ||
| T2b | 0.559 | 0.034 | 0.016 | 0.50 (0.28 - 0.87, P = 0.014) | ||
| T2NOS | 0.262 | 0.152 | 0.115 | 0.69 (0.44 - 1.09, P = 0.110) | ||
| Surgery | ||||||
| PC | Ref. | Ref. | Ref. | Ref. | Ref. | Ref. |
| RC | < 0.001 | 0.001 | 0.34 (0.26 - 0.44, P < 0.001) | 0.002 | 0.055 | 0.47 (0.31 - 0.72, P < 0.001) |
| Radiation therapy | ||||||
| None/unknown | Ref. | Ref. | ||||
| Yes | 0.486 | 0.383 | ||||
| Chemotherapy | ||||||
| No/unknown | Ref. | Ref. | Ref. | Ref. | Ref. | Ref. |
| Yes | 0.007 | 0.049 | 0.71 (0.54 - 0.93, P = 0.014) | 0.016 | 0.136 | 0.72 (0.46 - 1.13, P = 0.157) |