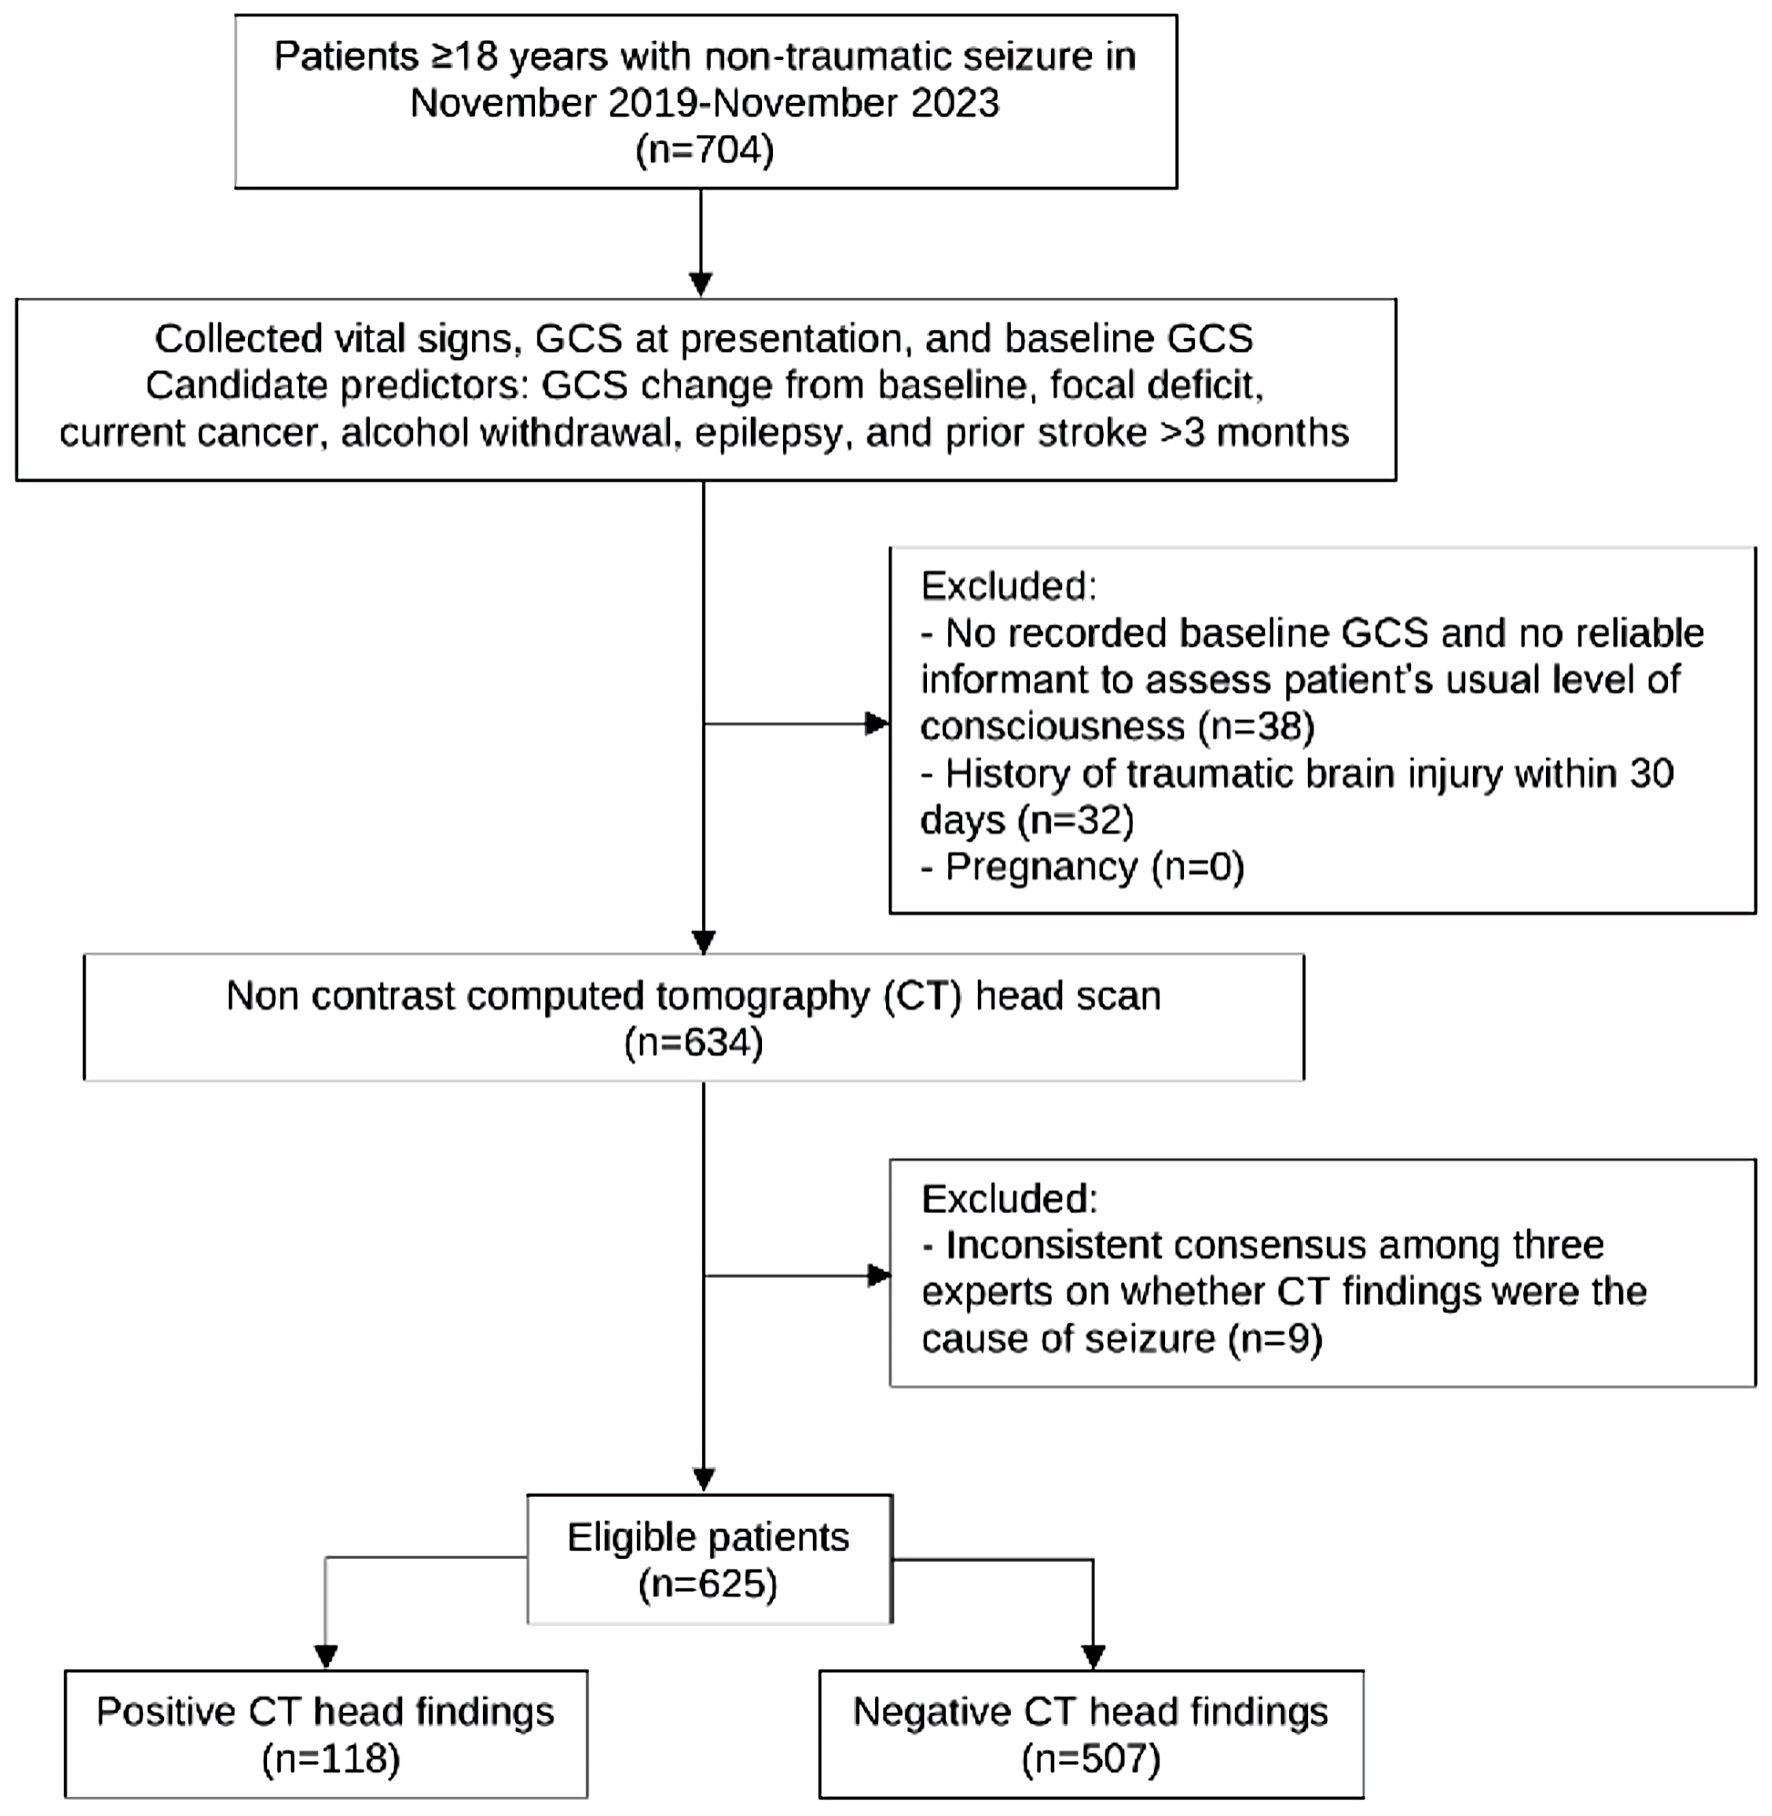
↓ Figure 1. Study flow diagram. GCS: Glasgow Coma
Scale.
| Journal of Clinical Medicine Research, ISSN 1918-3003 print, 1918-3011 online, Open Access |
| Article copyright, the authors; Journal compilation copyright, J Clin Med Res and Elmer Press Inc |
| Journal website https://jocmr.elmerjournals.com |
Original Article
Volume 17, Number 7, July 2025, pages 398-407
Improving a Clinical Prediction Model for Computed Tomography Head Scan Use in Non-Traumatic Seizures: The SeizCT Optimized Model
Figures
Tables
| Baseline characteristics | Missing (n = 55), n (%) | Positive CT (n = 118), n (%) | Negative CT (n = 507), n (%) | P value |
|---|---|---|---|---|
| SD: standard deviation; SBP: systolic blood pressure; DBP: diastolic blood pressure; GCS: Glasgow Coma Scale; IQR: interquartile range. | ||||
| Female | 0 (0) | 40 (33.9) | 117 (23.1) | 0.018 |
| Age (years), mean ± SD | 0 (0) | 60.4 ± 15.1 | 53.5 ± 16.9 | < 0.001 |
| SBP (mm Hg), mean ± SD | 0 (0) | 145.5 ± 33.07 | 139.4 ± 26.8 | 0.035 |
| DBP (mm Hg), mean ± SD | 0 (0) | 85.7 ± 20.6 | 84.4 ± 17.8 | 0.481 |
| GCS, median (IQR) | 0 (0) | 11 (7, 15) | 15 (11, 15) | < 0.001 |
| Eye, median (IQR) | 0 (0) | 4 (2, 4) | 4 (4, 4) | < 0.001 |
| Verbal, median (IQR) | 0 (0) | 2 (1, 5) | 5 (2, 5) | < 0.001 |
| Motor, median (IQR) | 0 (0) | 5 (4, 6) | 6 (5, 6) | < 0.001 |
| Pupil (mm), median (IQR) | 39 (6.2) | 3 (2, 3) | 3 (3, 3) | 0.395 |
| GCS change from baseline, median (IQR) | 0 (0) | -4 (-8, 0) | 0 (-3, 0) | < 0.001 |
| Focal neurological deficit | 0 (0) | 65 (55.1) | 88 (17.4) | < 0.001 |
| Previous CT | ||||
| No previous CT | 0 (0) | 68 (57.6) | 243 (47.9) | 0.019 |
| Normal finding | 0 (0) | 11 (9.3) | 99 (19.5) | |
| Abnormal finding | 0 (0) | 39 (33.1) | 165 (32.5) | |
| Prior stroke more than 3 months | 0 (0) | 16 (13.6) | 95 (18.7) | 0.228 |
| Current cancer | 0 (0) | 17 (14.4) | 14 (2.8) | < 0.001 |
| Epilepsy | 0 (0) | 16(13.6) | 135 (26.6) | 0.003 |
| End-stage renal disease | 0 (0) | 9 (7.6) | 35 (6.9) | 0.841 |
| Chronic liver disease | 0 (0) | 3 (2.5) | 13 (2.6) | 1.000 |
| Anticoagulant use | 0 (0) | 7 (5.9) | 26 (5.1) | 0.654 |
| Hypertension | 0 (0) | 43 (36.4) | 164 (32.4) | 0.447 |
| Diabetes mellitus | 0 (0) | 19 (16.1) | 87 (17.2) | 0.892 |
| Smoking | 7 (1.1) | 21 (18.1) | 76(15.1) | 0.479 |
| Alcohol consumption | 6 (1.0) | 39 (33.6) | 198 (39.4) | 0.290 |
| Substance use | 3 (0.5) | 2 (1.7) | 20 (4.0) | 0.403 |
| Alcohol withdrawal symptoms | 0 (0) | 2 (1.7) | 92 (18.2) | < 0.001 |
| Predictors | Positive findings on CT head scan | ||
|---|---|---|---|
| mOR | 95% CI | P value | |
| CT: computed tomography; mOR: multivariable odds ratio; CI: confidence interval; GCS: Glasgow Coma Scale. | |||
| GCS change from baseline (points) | 1.14 | 1.07, 1.21 | < 0.001 |
| Focal neurological deficit | 3.83 | 2.40, 6.11 | < 0.001 |
| Current cancer | 4.11 | 1.79, 9.43 | < 0.001 |
| Alcohol withdrawal symptoms | 0.12 | 0.03, 0.49 | 0.003 |
| Epilepsy | 0.36 | 0.19, 0.68 | < 0.001 |
| Prior stroke more than 3 months | 0.49 | 0.26, 0.93 | 0.030 |
| Parameters | Apparent performance | Bootstrap performance |
|---|---|---|
| AuROC: area under the receiver operating characteristic curve; E:O ratio: expected-to-observed outcomes ratio; CITL: calibration-in-the-large. | ||
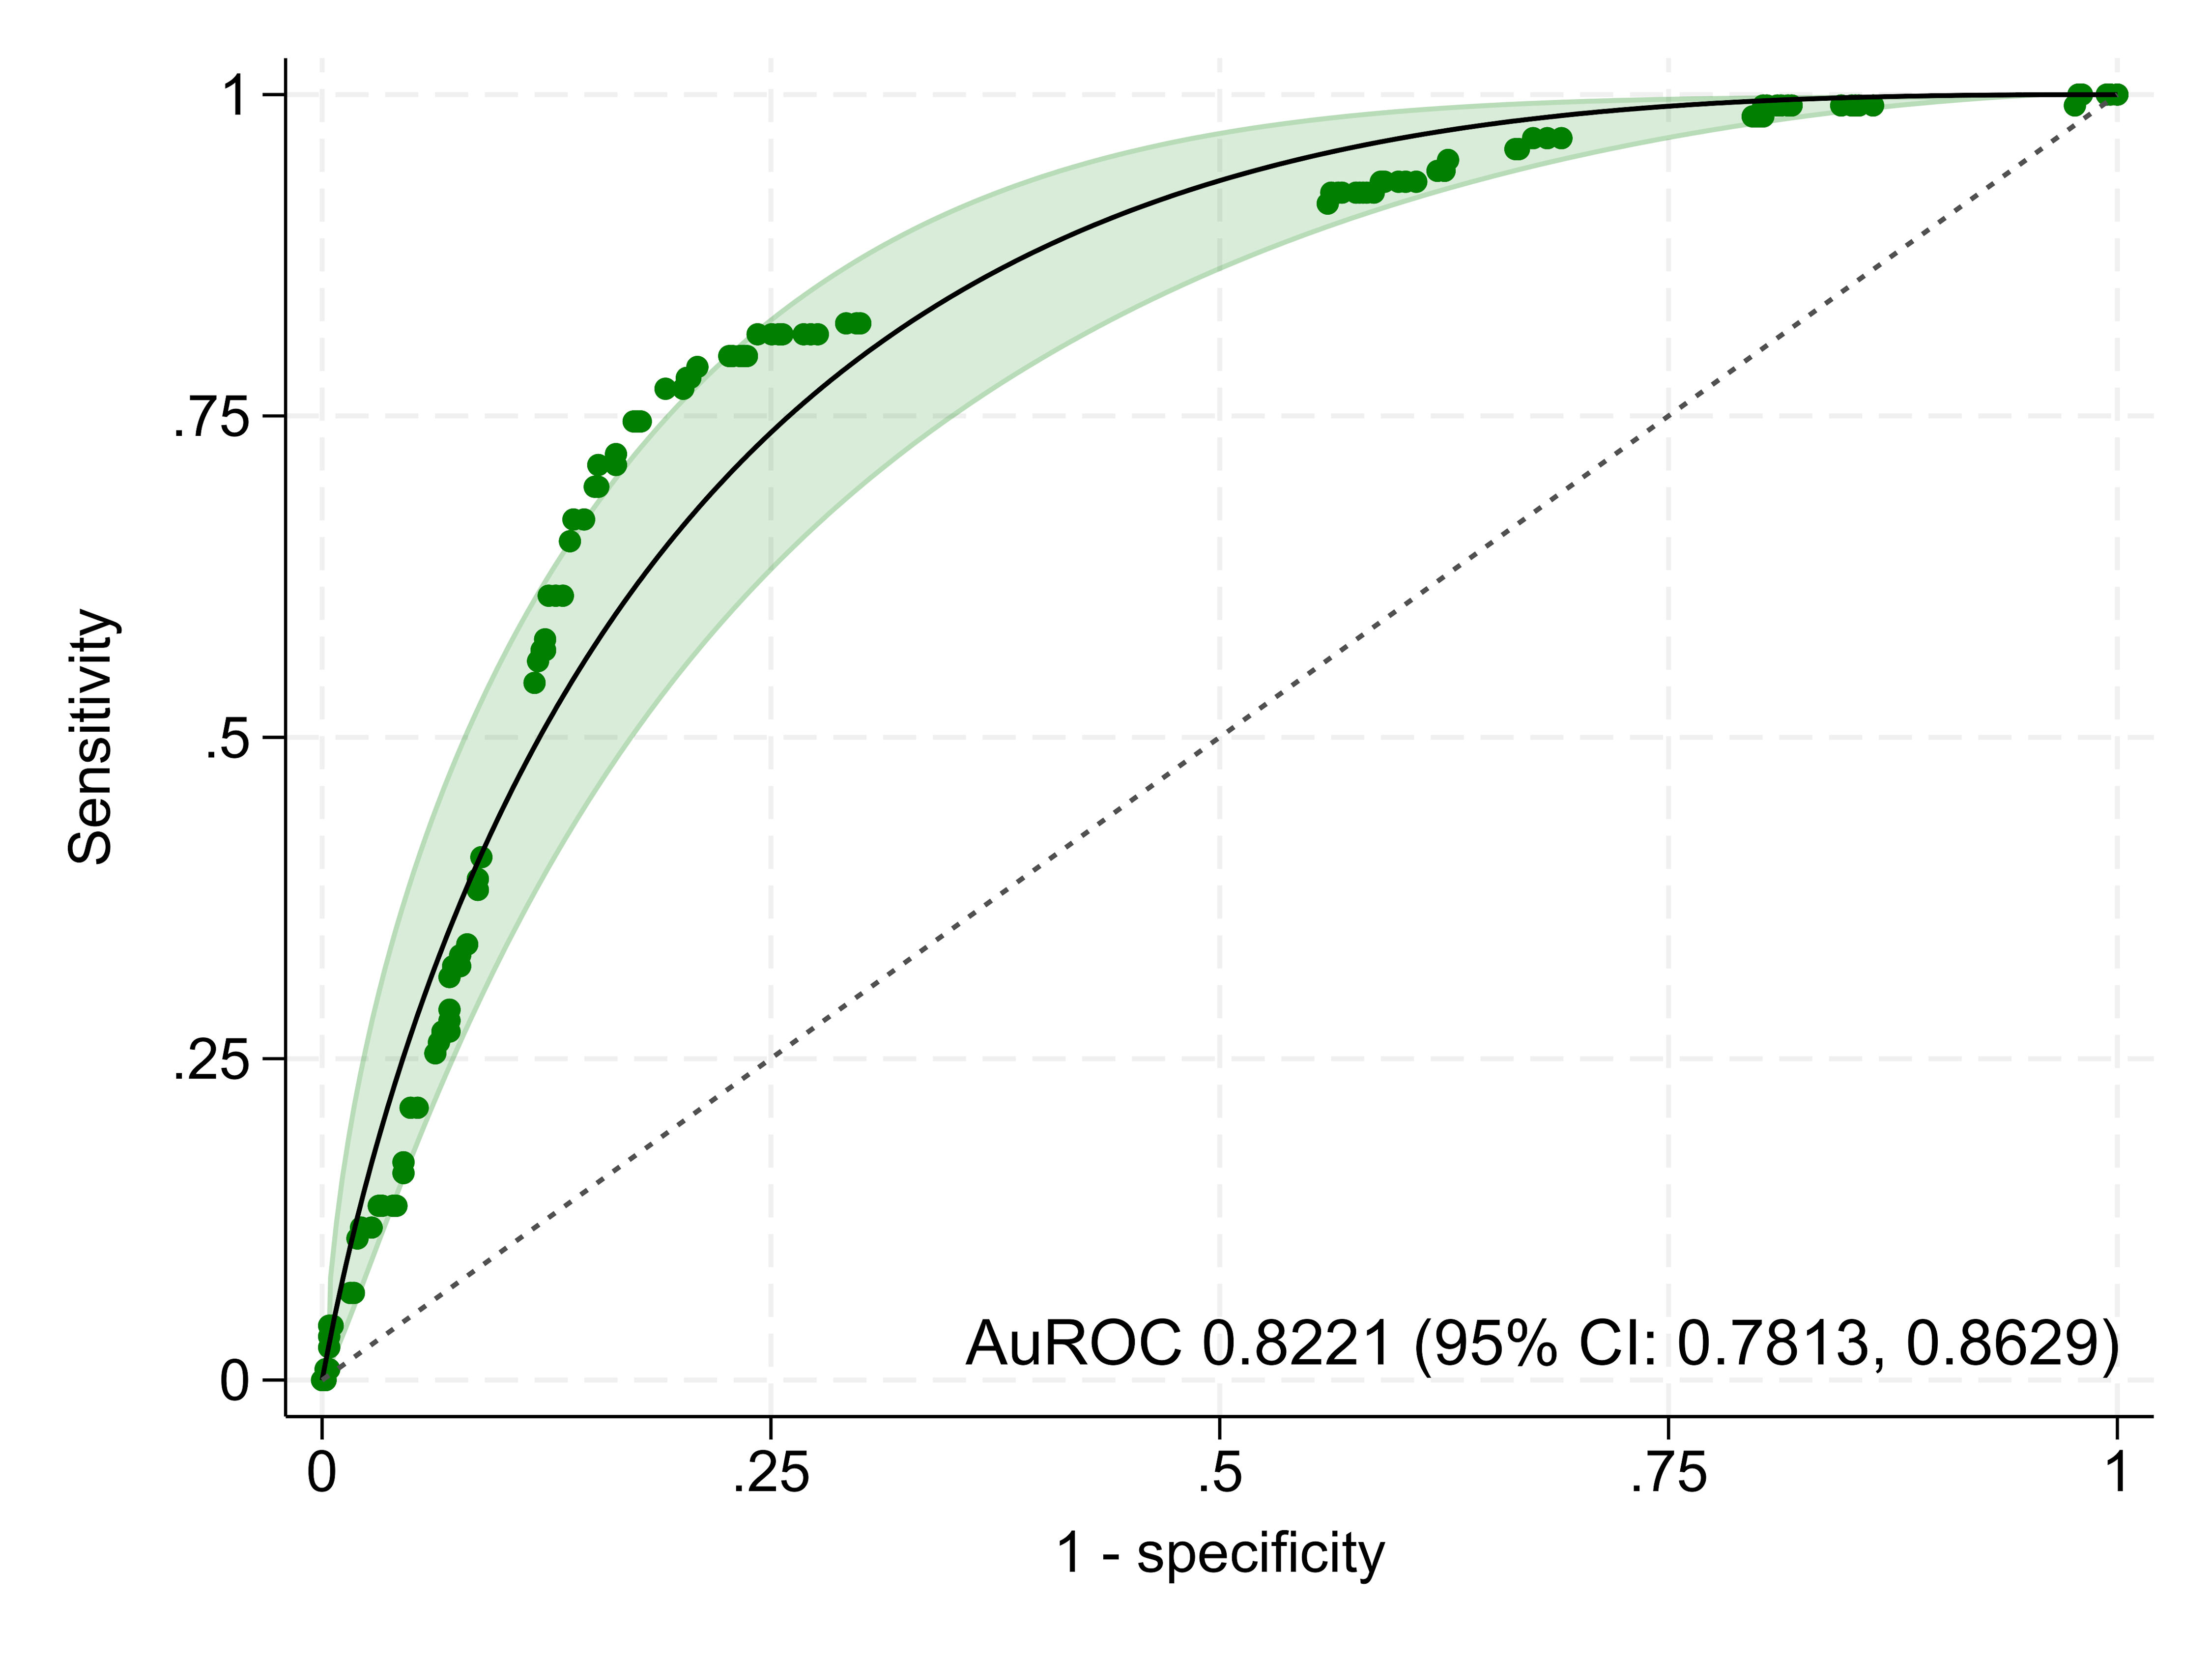
| AuROC | 0.8221 (0.7813, 0.8629) | 0.8160 (0.7700, 0.8550) |
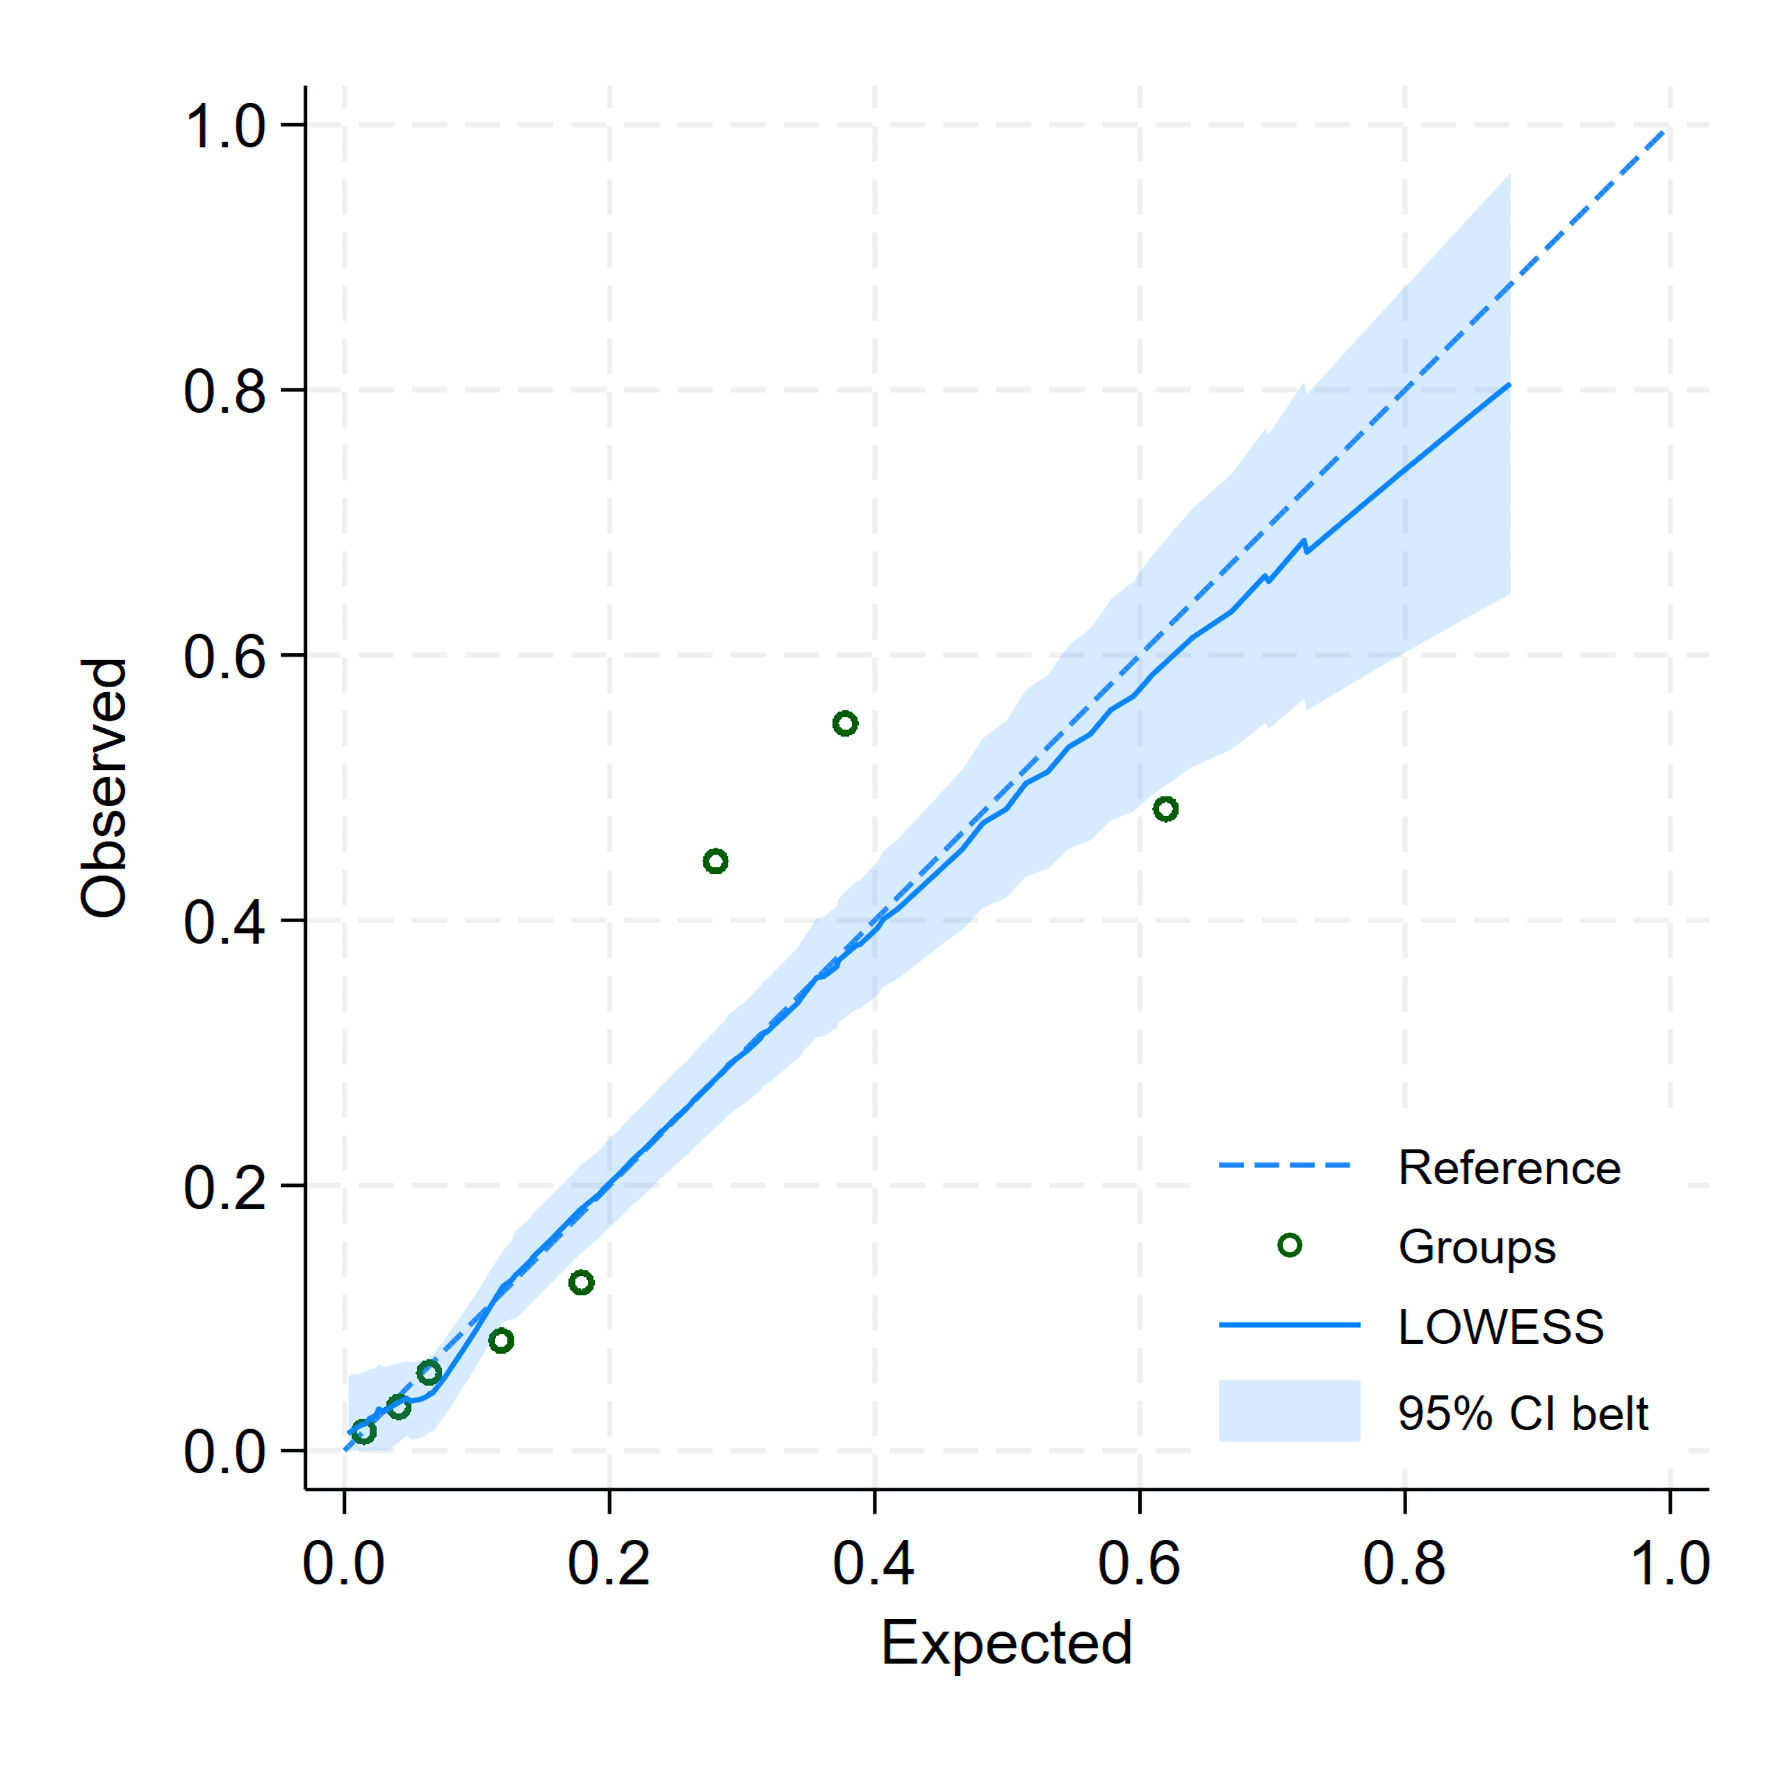
| Slope | 1.0000 (0.7930, 1.2070) | 0.9570 (0.7440, 1.1960) |
| E:O ratio | 1.0000 | 1.0160 |
| CITL | -0.0000 (-0.2260, 0.2260) | -0.0020 (-0.2300, 0.2370) |
| Bootstrap shrinkage | - | 0.9570 |
| Cut point | CT +ve (n = 118) | CT -ve (n = 507) | Total | Sensitivity | Specificity | PPV | NPV |
|---|---|---|---|---|---|---|---|
| CT: computed tomography; CT +ve: positive finding on CT brain; CT -ve: negative finding on CT brain; PPV: positive predictive value; NPV: negative predictive value. | |||||||
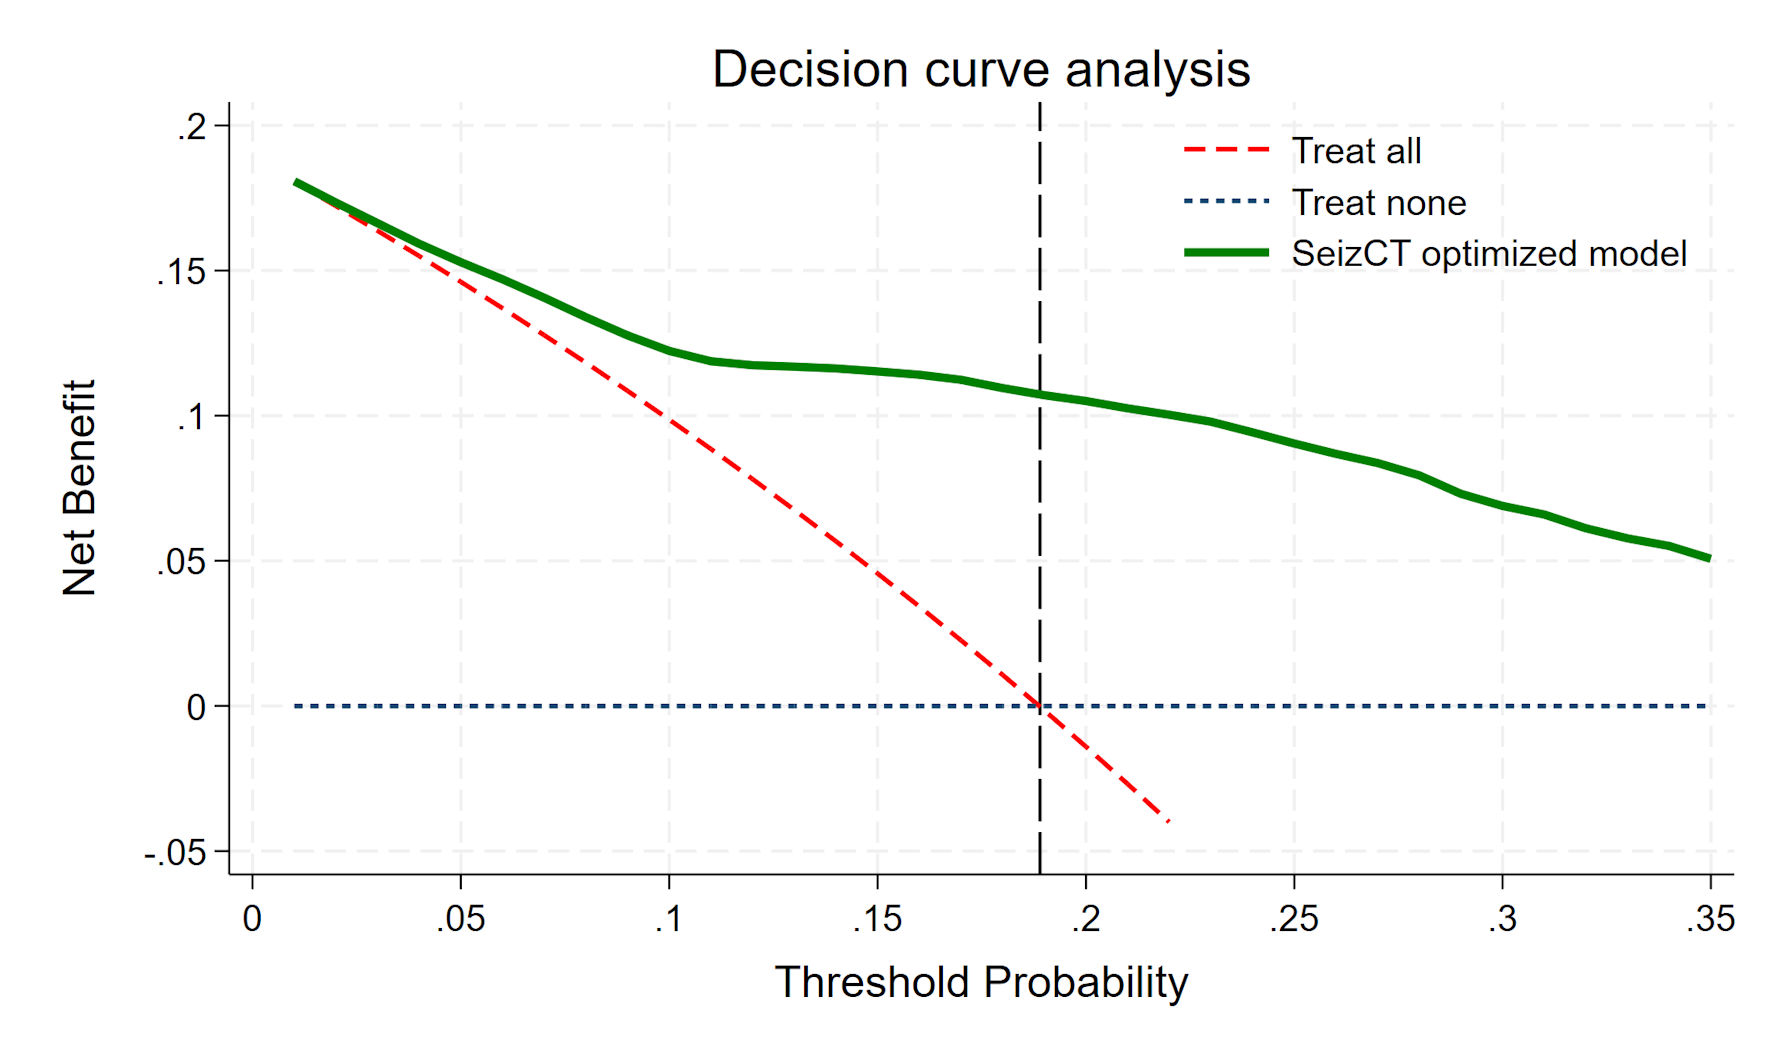
| Probability > 18.9% | 94 (15.0%) | 116 (18.6%) | 210 | 79.7% | 77.1% | 44.8% | 94.2% |
| Probability ≤ 18.9% | 24 (3.8%) | 391 (62.6%) | 415 | ||||
| Probability > 22.57% | 88 (14.1%) | 90 (14.4%) | 178 | 74.6% | 82.2% | 49.4% | 93.3% |
| Probability ≤ 22.57% | 30 (4.8%) | 417 (66.7%) | 447 | ||||
| Probability > 25% | 84 (13.4%) | 83 (13.3%) | 167 | 71.2% | 83.6% | 50.3% | 92.6% |
| Probability ≤ 25% | 34 (5.4%) | 424 (67.8%) | 458 | ||||