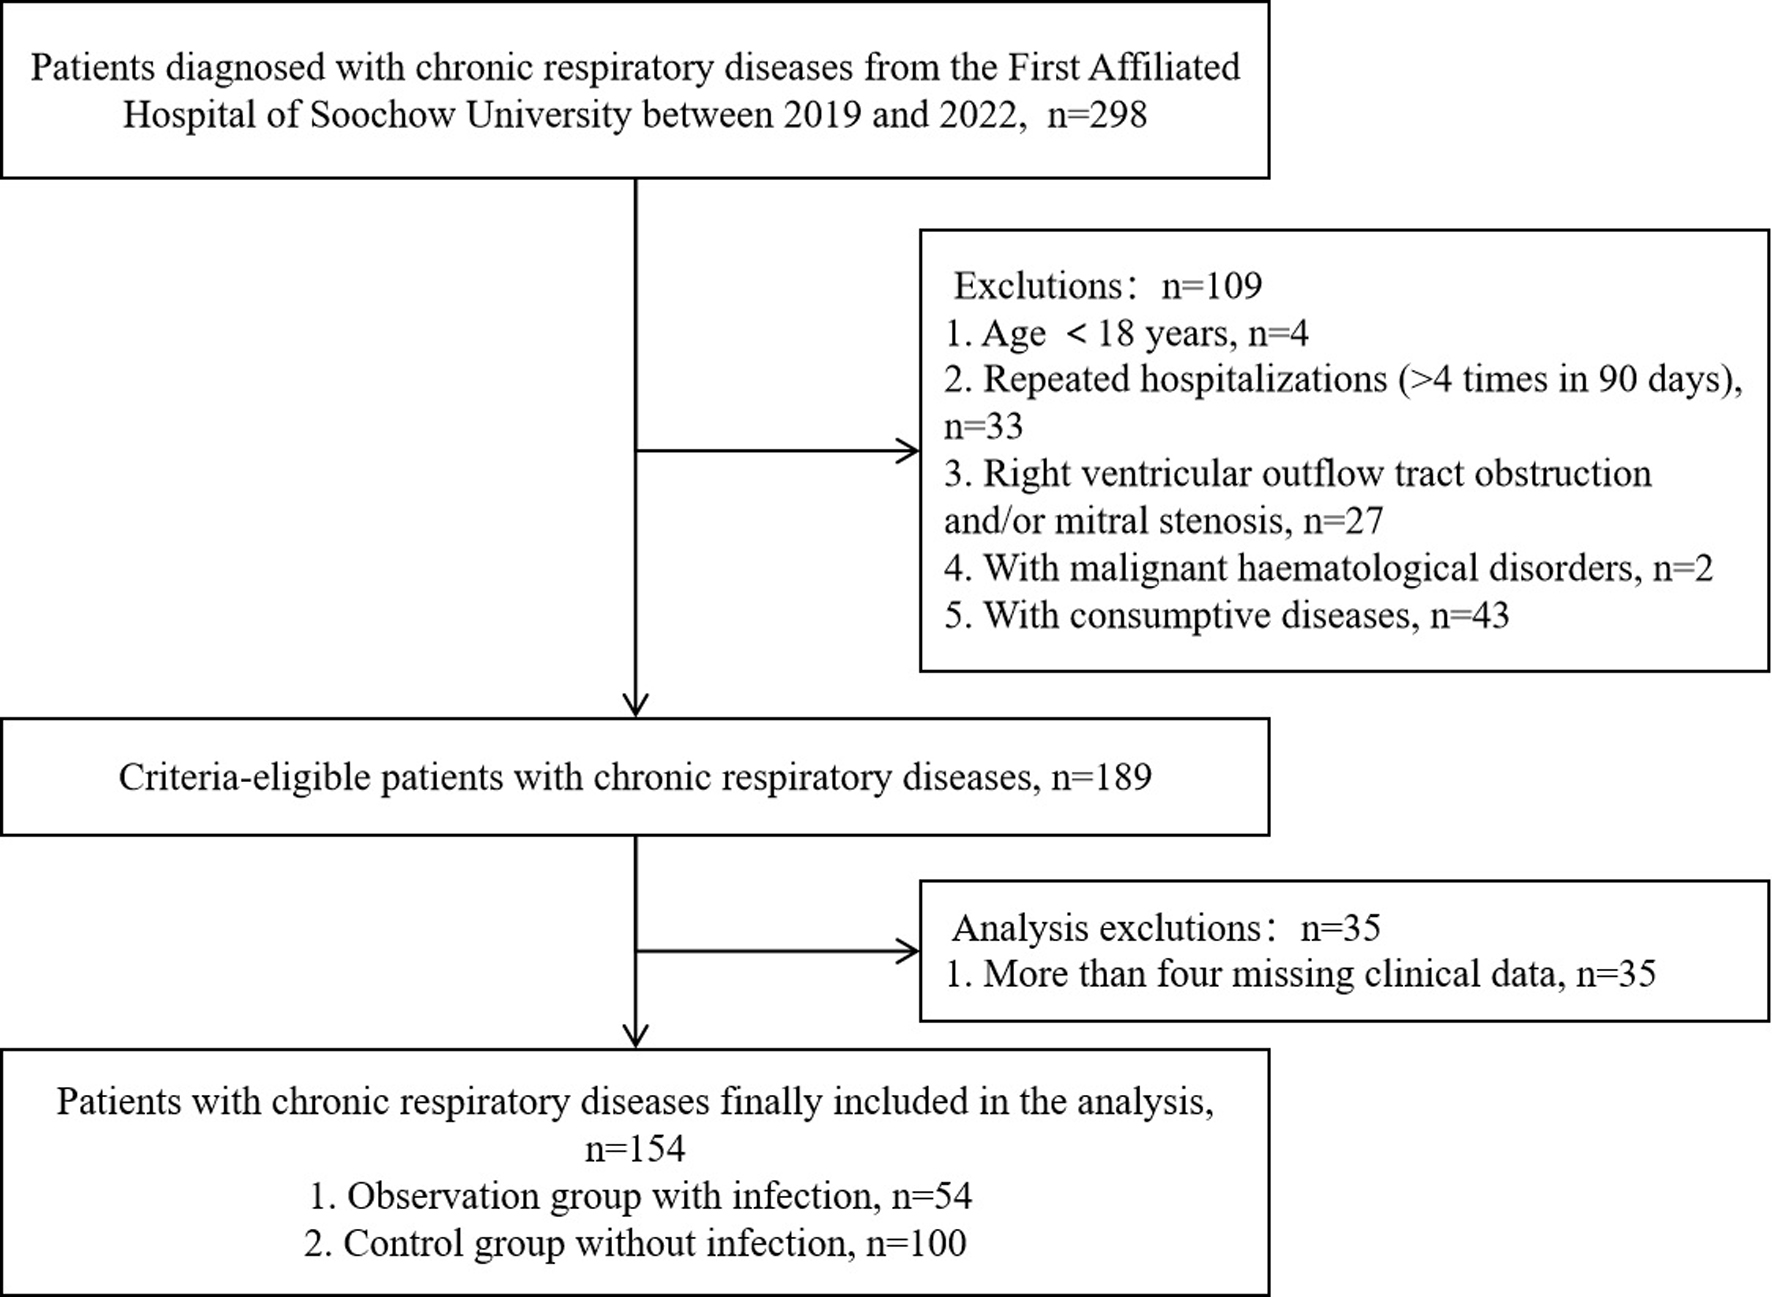
↓ Figure 1. Enrolment flowchart.
| Journal of Clinical Medicine Research, ISSN 1918-3003 print, 1918-3011 online, Open Access |
| Article copyright, the authors; Journal compilation copyright, J Clin Med Res and Elmer Press Inc |
| Journal website https://jocmr.elmerjournals.com |
Original Article
Volume 17, Number 11, November 2025, pages 608-617
Clinical Features and Prediction Model of Secondary Infection Risk in Adult Patients With Chronic Respiratory Diseases: A Case-Control Study
Figures
Tables
| Characteristics | N (%) | Note |
|---|---|---|
| Chronic respiratory diseases | ||
| Interstitial pneumonia | 55 (35.7) | |
| Chronic obstructive pulmonary disease | 68 (44.2) | |
| Pulmonary fibrosis | 15 (9.7) | |
| Asthma | 7 (4.5) | |
| Bronchiectasis | 5 (3.2) | |
| Pulmonary cavity | 5 (3.2) | |
| Pulmonary tuberculosis | 2 (1.3) | |
| Culture results | ||
| Normal flora | 100 (64.9) | |
| Pseudomonas aeruginosa | 20 (13.0) | Nonfermenters |
| Klebsiella pneumoniae | 3 (1.9) | Enterobacteriaceae |
| Other Enterobacteriaceae | 3 (1.9) | Enterobacteriaceae |
| Burkholderia cepacia and Acinetobacter baumannii | 2 (1.3) | Nonfermenters |
| Burkholderia cepacia | 1 (0.6) | Nonfermenters |
| Other nonfermenters | 7 (4.5) | Nonfermenters |
| Staphylococcus aureus | 1 (0.6) | Gram-positive bacteria |
| Aspergillus fumigatus | 8 (5.2) | Filamentous fungi |
| Candidiasis | 3 (1.9) | Yeast-like fungi |
| Acid-fast bacillus | 5 (3.2) | Mycobacterium tuberculosis |
| Hemophilus | 1 (0.6) | Hemophilus |
| Variables | Observation group (n = 54, 35.1%) | Control group (n = 100, 64.9%) | P value |
|---|---|---|---|
| ALB: albumin; BMI: body mass index; CRP: C-reactive protein; LY: lymphocyte count; NE: neutrophil count; PCT: procalcitonin; NT-proBNP: N-terminal pro-brain natriuretic peptide; LVEF: left ventricular ejection fraction (52-74%); TRPG: tricuspid regurgitation pressure gradient; WBC: white blood cell count. | |||
| Male (%) | 42 (77.8) | 64 (64.0) | 0.078 |
| Age (years, M (P25, P75)) | 72.0 (67.0, 80.0) | 67.0 (58.0, 73.9) | < 0.001 |
| Age of onset (years, M (P25, P75)) | 60.5 (50.0, 70.3) | 57.0 (48.3, 69.0) | 0.398 |
| BMI (kg/m2, M (P25, P75)) | 19.65 ± 3.87 | 23.13 ± 3.74 | < 0.001 |
| Hypertension (%) | 22 (40.7) | 36 (36.0) | 0.562 |
| Diabetes (%) | 10 (18.5) | 12 (12.0) | 0.27 |
| Smoking history (%) | 15 (27.8) | 22 (22.0) | 0.423 |
| The number of acute exacerbations ≥ 2/year (%) | 18/35(51.4) | 31/59 (52.5) | 0.917 |
| Clinical presentation (%) | |||
| Cough | 44 (81.5) | 83 (83.0) | 0.813 |
| Sputum | 44 (81.5) | 77 (77.0) | 0.518 |
| Chest tightness and asthma | 38 (72.2) | 61 (61.0) | 0.164 |
| Fever | 15 (27.8) | 20 (20.0) | 0.272 |
| Difficulty in breathing | 12 (22.2) | 12 (12.0) | 0.095 |
| Laboratory indicators (M (P25, P75)) | |||
| WBC (× 109/L) | 9.0 (5.5, 13.6) | 8.0 (5.9, 9.8) | 0.275 |
| LY (× 109/L) | 0.8 (0.4, 1.2) | 1.4 (1.0, 1.8) | < 0.001 |
| NE (× 109/L) | 7.3 (3.9, 11.9) | 6.0 (4.0, 7.9) | 0.084 |
| NE (%) | 85.1 (72.8, 90.9) | 74.2 (64.6, 82.1) | < 0.001 |
| CRP (mg/L) | 18.9 (3.6, 93.1) | 4.0 (1.9, 17.3) | 0.003 |
| PCT (ng/mL) | 0.06 (0.03, 0.14) | 0.03 (0.03, 0.08) | 0.005 |
| ALB (g/L) | 33.0 (30.0, 36.4) | 38.0 (33.8, 40.6) | < 0.001 |
| NT-proBNP | 385.5 (152.6, 136.3) | 180.4 (55.4, 560.7) | 0.051 |
| LVEF (%) | 62.0 (59.5, 64.5) | 64.0 (60, 67.8) | 0.156 |
| TRPG (mm Hg) | 30.7 (30.7, 36.0) | 30.7 (25.0, 30.7) | 0.001 |
| Antibiotics | Resistant (%) | Intermediate (%) | Susceptible (%) |
|---|---|---|---|
| Piperacillin (n = 18) | 21.1 | 15.8 | 63.2 |
| Piperacillin tazobactam (n = 20) | 15.0 | 10.0 | 75.0 |
| Ceftazidime (n = 20) | 10.0 | 10.0 | 80.0 |
| Cefepime (n = 20) | 5.0 | 15.0 | 80.0 |
| Cefoperazone sulbactam (n = 20) | 20.0 | 10.0 | 70.0 |
| Imipenem (n = 20) | 35.0 | 0.0 | 65.0 |
| Meropenem (n = 20) | 35.0 | 0.0 | 65.0 |
| Gentamicin (n = 18) | 0.00 | 44.4 | 55.6 |
| Amikacin (n = 17) | 0.0 | 10.0 | 90.0 |
| Tobramycin (n = 18) | 5.6 | 0.0 | 94.4 |
| Ciprofloxacin (n = 20) | 30.0 | 0.0 | 70.0 |
| Levofloxacin (n = 18) | 33.3 | 11.1 | 55.6 |
| Variables | β | SE | Wald χ2 value | OR value | P value | 95% CI |
|---|---|---|---|---|---|---|
| ALB: albumin; BMI: body mass index; 95% CI: 95% confidence interval; CRP: C-reactive protein; LY: lymphocyte count; NE: neutrophil count; OR: odds ratio; TRPG: tricuspid regurgitation pressure gradient. | ||||||
| Age | 0.02 | 0.03 | 0.236 | 1.015 | 0.627 | 0.956 - 1.078 |
| BMI | -0.237 | 0.10 | 5.200 | 0.789 | 0.023 | 0.644 - 0.967 |
| TRPG | 0.109 | 0.05 | 5.015 | 1.116 | 0.025 | 1.014 - 1.228 |
| NE% | -0.097 | 0.04 | 5.882 | 0.908 | 0.015 | 0.840 - 0.982 |
| LY | -2.105 | 0.93 | 5.119 | 0.122 | 0.024 | 0.020 - 0.755 |
| CRP | 0.022 | 0.01 | 4.177 | 1.023 | 0.041 | 1.001 - 1.045 |
| ALB | 0.063 | 0.08 | 0.566 | 1.065 | 0.452 | 0.904 - 1.254 |
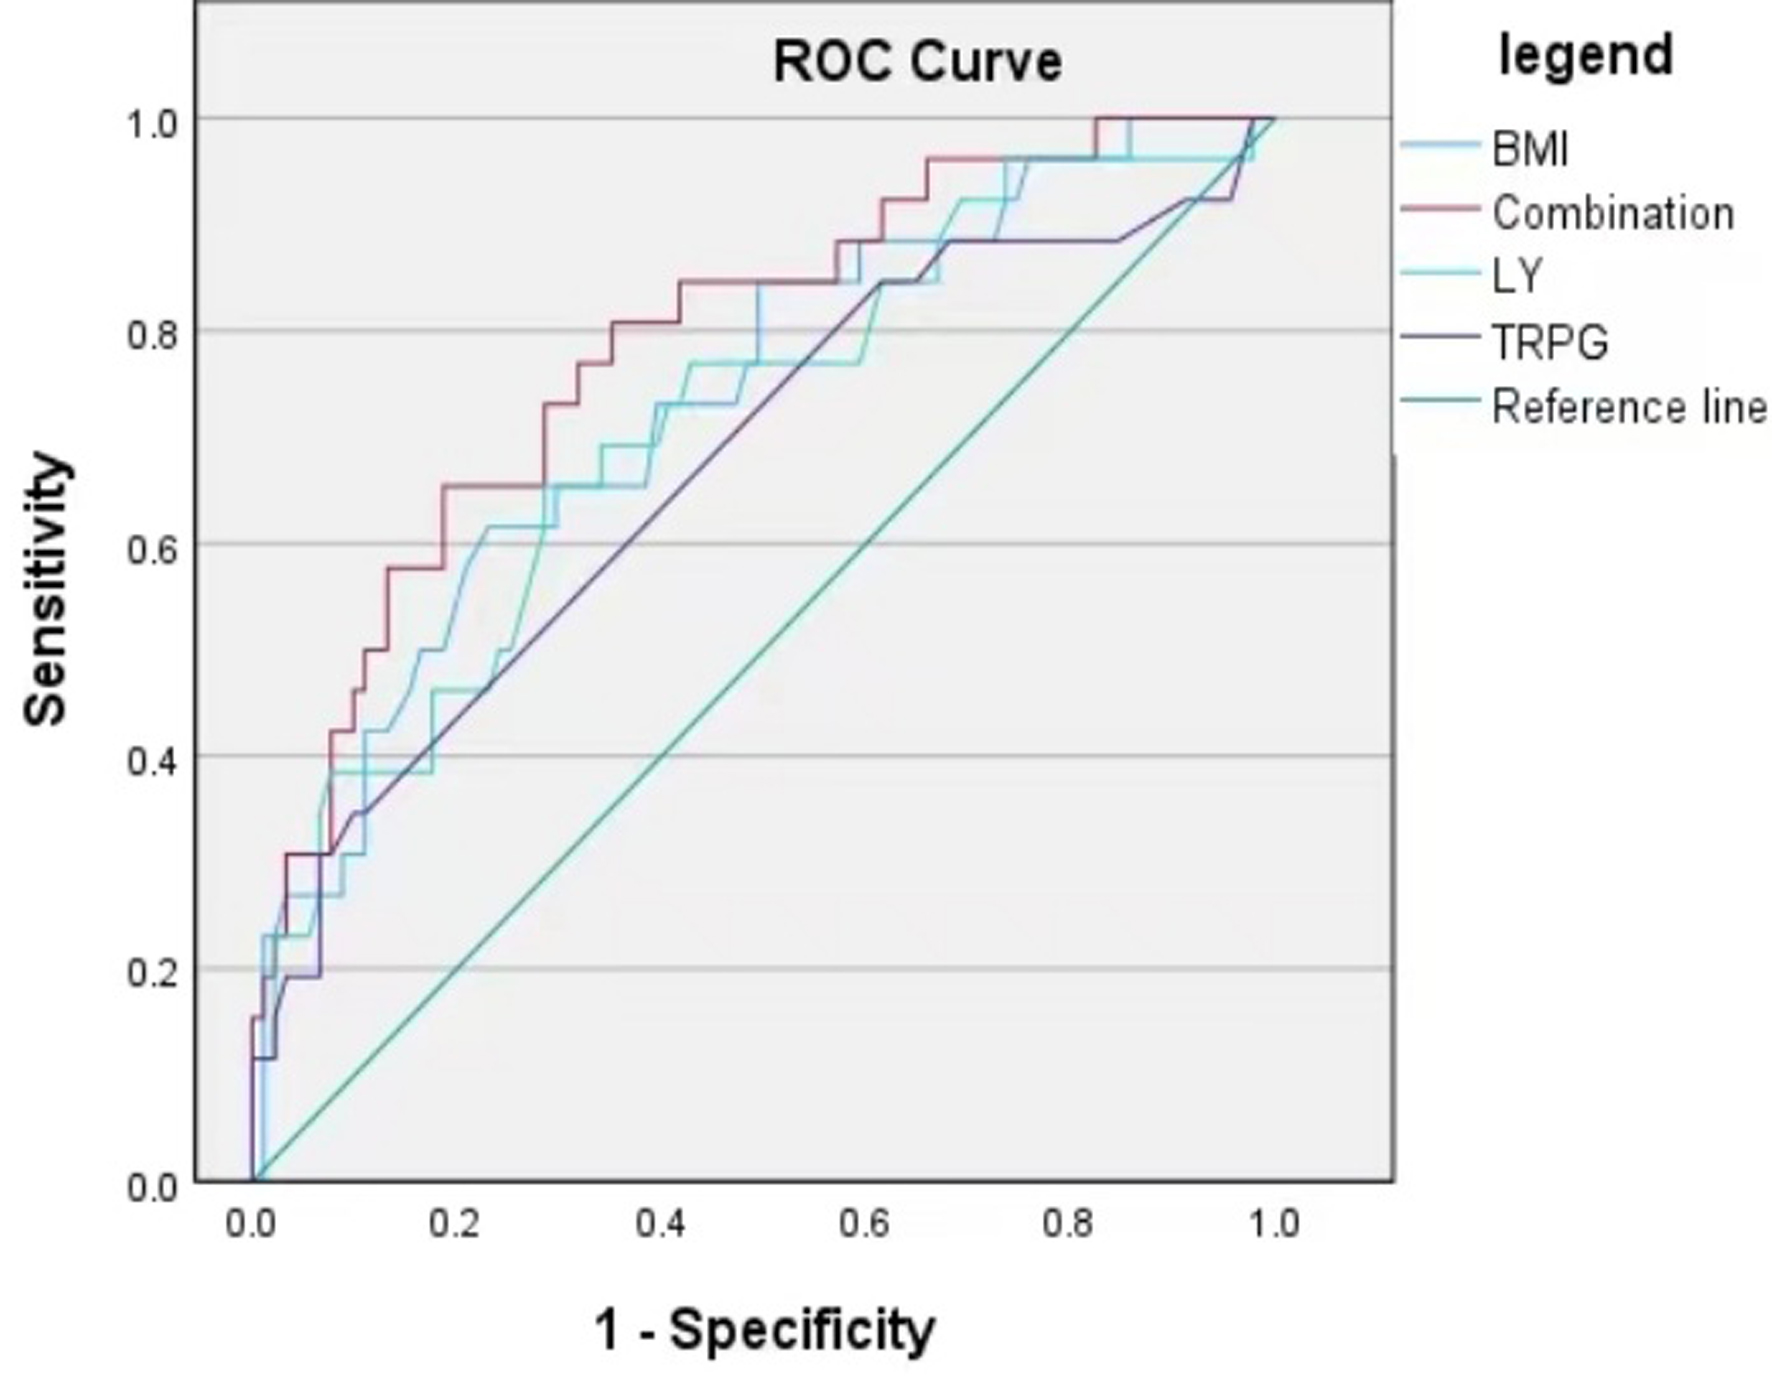
| Variables | AUC | 95% CI | P value | Sensitivity (%) | Specificity (%) |
|---|---|---|---|---|---|
| AUC: area under curve; BMI: body mass index; 95% CI: 95% confidence interval; LY: lymphocyte count; TRPG: tricuspid regurgitation pressure gradient. | |||||
| BMI | 0.734 | 0.625 - 0.844 | 0.000 | 66.0 | 76.9 |
| LY | 0.713 | 0.598 - 0.829 | 0.000 | 65.4 | 71.4 |
| TPRG | 0.672 | 0.547 - 0.797 | 0.007 | 34.6 | 90.1 |
| Combination | 0.788 | 0.689 - 0.887 | 0.000 | 65.4 | 81.3 |