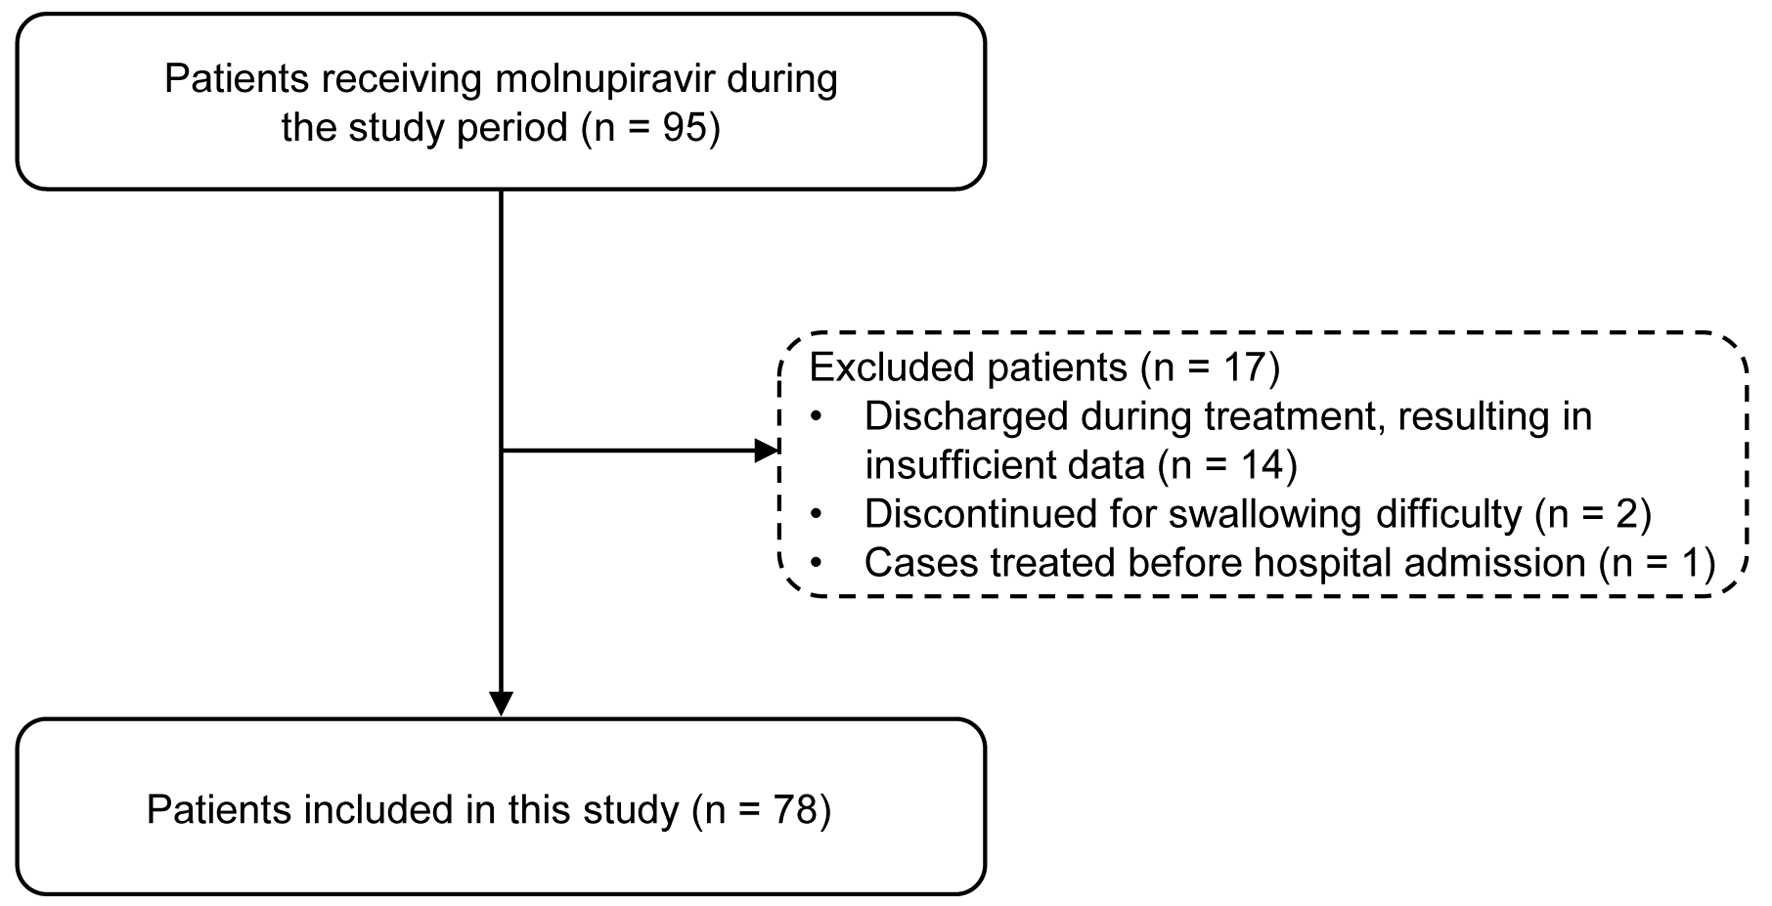
↓ Figure 1. Flowchart of patient selection.
| Journal of Clinical Medicine Research, ISSN 1918-3003 print, 1918-3011 online, Open Access |
| Article copyright, the authors; Journal compilation copyright, J Clin Med Res and Elmer Press Inc |
| Journal website https://jocmr.elmerjournals.com |
Original Article
Volume 17, Number 8, August 2025, pages 437-444
Safety of Molnupiravir in Hospitalized Patients With Coronavirus Disease 2019: A Retrospective, Single-Center, Cohort Study
Figures
Tables
| Adverse events | Total, n (%) | Grade 1, n (%) | Grade 2, n (%) | Grade 3, n (%) | Actual valuea | Grade 4, n (%) | Actual valuea |
|---|---|---|---|---|---|---|---|
| aFor grade 3/4 adverse events, actual values (e.g., maximum CPK, lowest Hb) are provided. For grade 1/2 events, only the number of cases is reported. ALT: alanine aminotransferase; AST: aspartate aminotransferase; CPK: creatine phosphokinase; Cr: serum creatinine; Hb: hemoglobin; PLT: platelet; WBC: white blood cell count. | |||||||
| CPK increase | 11 (14.1) | 5 (6.4) | 5 (6.4) | 0 (0) | - | 1 (1.3) | 3,964 U/L |
| Anemia | 11 (14.1) | 0 (0.0) | 10 (12.8) | 1 (1.3) | 7.9 g/dL | 0 (0.0) | - |
| AST and/or ALT increase | 9 (11.5) | 8 (10.3) | 1 (1.3) | 0 (0.0) | - | 0 (0.0) | - |
| WBC decrease | 6 (7.7) | 3 (3.8) | 3 (3.8) | 0 (0.0) | - | 0 (0.0) | - |
| Rash | 2 (2.6) | 2 (2.6) | 0 (0.0) | 0 (0.0) | - | 0 (0.0) | - |
| Cr increase | 1 (1.3) | 1 (1.3) | 0 (0.0) | 0 (0.0) | - | 0 (0.0) | - |
| PLT decrease | 1 (1.3) | 1 (1.3) | 0 (0.0) | 0 (0.0) | - | 0 (0.0) | - |
| Factor | No CPK elevation (n = 67) | CPK elevation (n = 11) | Univariate | Multivariate | ||||
|---|---|---|---|---|---|---|---|---|
| OR | 95% CI | P-value | aOR | 95% CI | P-value | |||
| AEs: adverse events; aOR: adjusted odds ratio; CCI: Charlson Comorbidity Index; COVID-19: coronavirus disease 2019; CPK: creatine phosphokinase; IQR: interquartile range; OR: odds ratio; 95% CI: 95% confidence interval. | ||||||||
| Age, median (IQR) | 82 (74 - 89) | 80 (73 - 85) | 0.99 | 0.94 - 1.05 | 0.54 | - | - | - |
| Male, n (%) | 37 (55.2%) | 7 (63.6%) | 1.41 | 0.37 - 5.30 | 0.74 | - | - | - |
| History of AEs or allergies, n (%) | 13 (19.4%) | 3 (27.3%) | 1.55 | 0.36 - 6.69 | 0.68 | - | - | - |
| CCI, median (IQR) | 2 (1 - 4) | 2 (1 - 3) | 0.85 | 0.59 - 1.10 | 0.74 | - | - | - |
| CCI ≥ 3, n (%) | 28 (41.8%) | 5 (45.5%) | 1.16 | 0.32 - 4.18 | 0.81 | - | - | - |
| History of heart disease, n (%) | 15 (22.4%) | 3 (27.3%) | 1.30 | 0.30 - 5.51 | 0.70 | - | - | - |
| Bacterial coinfection cases, n (%) | 10 (14.9%) | 4 (36.4%) | 3.25 | 1.00 - 10.50 | 0.10 | 3.3 | 0.75 - 13.32 | 0.10 |
| Concomitant medications | ||||||||
| Lipid-lowering agent, n (%) | 20 (29.9%) | 4 (36.4%) | 1.34 | 0.35 - 5.10 | 0.72 | 1.39 | 0.32 - 5.37 | 0.63 |
| Use of steroids, n (%) | 2 (3.0%) | 1 (9.1%) | 3.25 | 0.26 - 39.24 | 0.37 | - | - | - |
| Antiparkinsonian agents, n (%) | 2 (3.0%) | 0 (0%) | - | - | 1.0 | - | - | - |
| COVID-19 severity | ||||||||
| Mild, n (%) | 49 (73.1%) | 8 (72.7%) | 1 (Ref) | - | - | - | - | - |
| Moderate I, n (%) | 11 (16.4%) | 3 (27.3%) | 1.67 | 0.32 - 6.90 | 0.50 | - | - | - |
| Moderate II, n (%) | 7 (10.4%) | 0 (0%) | - | - | - | - | - | - |
| Oxygen therapy, n (%) | 13 (19.4%) | 3 (27.3%) | 1.55 | 0.36 - 6.69 | 0.68 | - | - | - |
| Factor | No Hb decrease (n = 67) | Hb decrease (n = 11) | Univariate | Multivariate | ||||
|---|---|---|---|---|---|---|---|---|
| OR | 95% CI | P-value | aOR | 95% CI | P-value | |||
| AEs: adverse events; aOR: adjusted odds ratio; CCI: Charlson Comorbidity Index; COVID-19: coronavirus disease 2019; Hb: hemoglobin; IQR: interquartile range; OR: odds ratio; 95% CI: 95% confidence interval. | ||||||||
| Age, median (IQR) | 82 (74 - 89) | 84 (73 - 94) | 1.03 | 0.97 - 1.11 | 0.29 | - | - | - |
| Male, n (%) | 39 (58.2%) | 5 (45.5%) | 0.59 | 0.16 - 2.15 | 0.42 | - | - | - |
| History of AEs or allergies, n (%) | 12 (17.9%) | 4 (36.4%) | 2.61 | 0.66 - 10.39 | 0.22 | - | - | - |
| CCI, median (IQR) | 2 (1 - 4) | 2 (1 - 3) | 0.89 | 0.63 - 1.13 | 0.40 | - | - | - |
| CCI ≥ 3, n (%) | 30 (44.8%) | 3 (27.3%) | 0.46 | 0.11 - 1.89 | 0.33 | - | - | - |
| Bacterial coinfection cases, n (%) | 9 (13.4%) | 5 (45.5%) | 5.37 | 1.35 - 21.32 | 0.010 | 5.40 | 1.27–23.69 | 0.022 |
| COVID-19 severity | ||||||||
| Mild, n (%) | 51 (76.1%) | 6 (54.6%) | 1 (Ref) | - | - | 1 (Ref) | - | - |
| Moderate I, n (%) | 10 (14.9%) | 4 (36.4%) | 3.40 | 0.75 - 14.28 | 0.10 | 3.40 | 0.70–15.77 | 0.12 |
| Moderate II, n (%) | 6 (9.0%) | 1 (9.1%) | 1.41 | 0.06 - 10.51 | 0.77 | 1.08 | 0.04–9.16 | 0.94 |
| Oxygen therapy, n (%) | 14 (20.9%) | 2 (18.2%) | 0.84 | 0.16 - 4.34 | 1.00 | - | - | - |