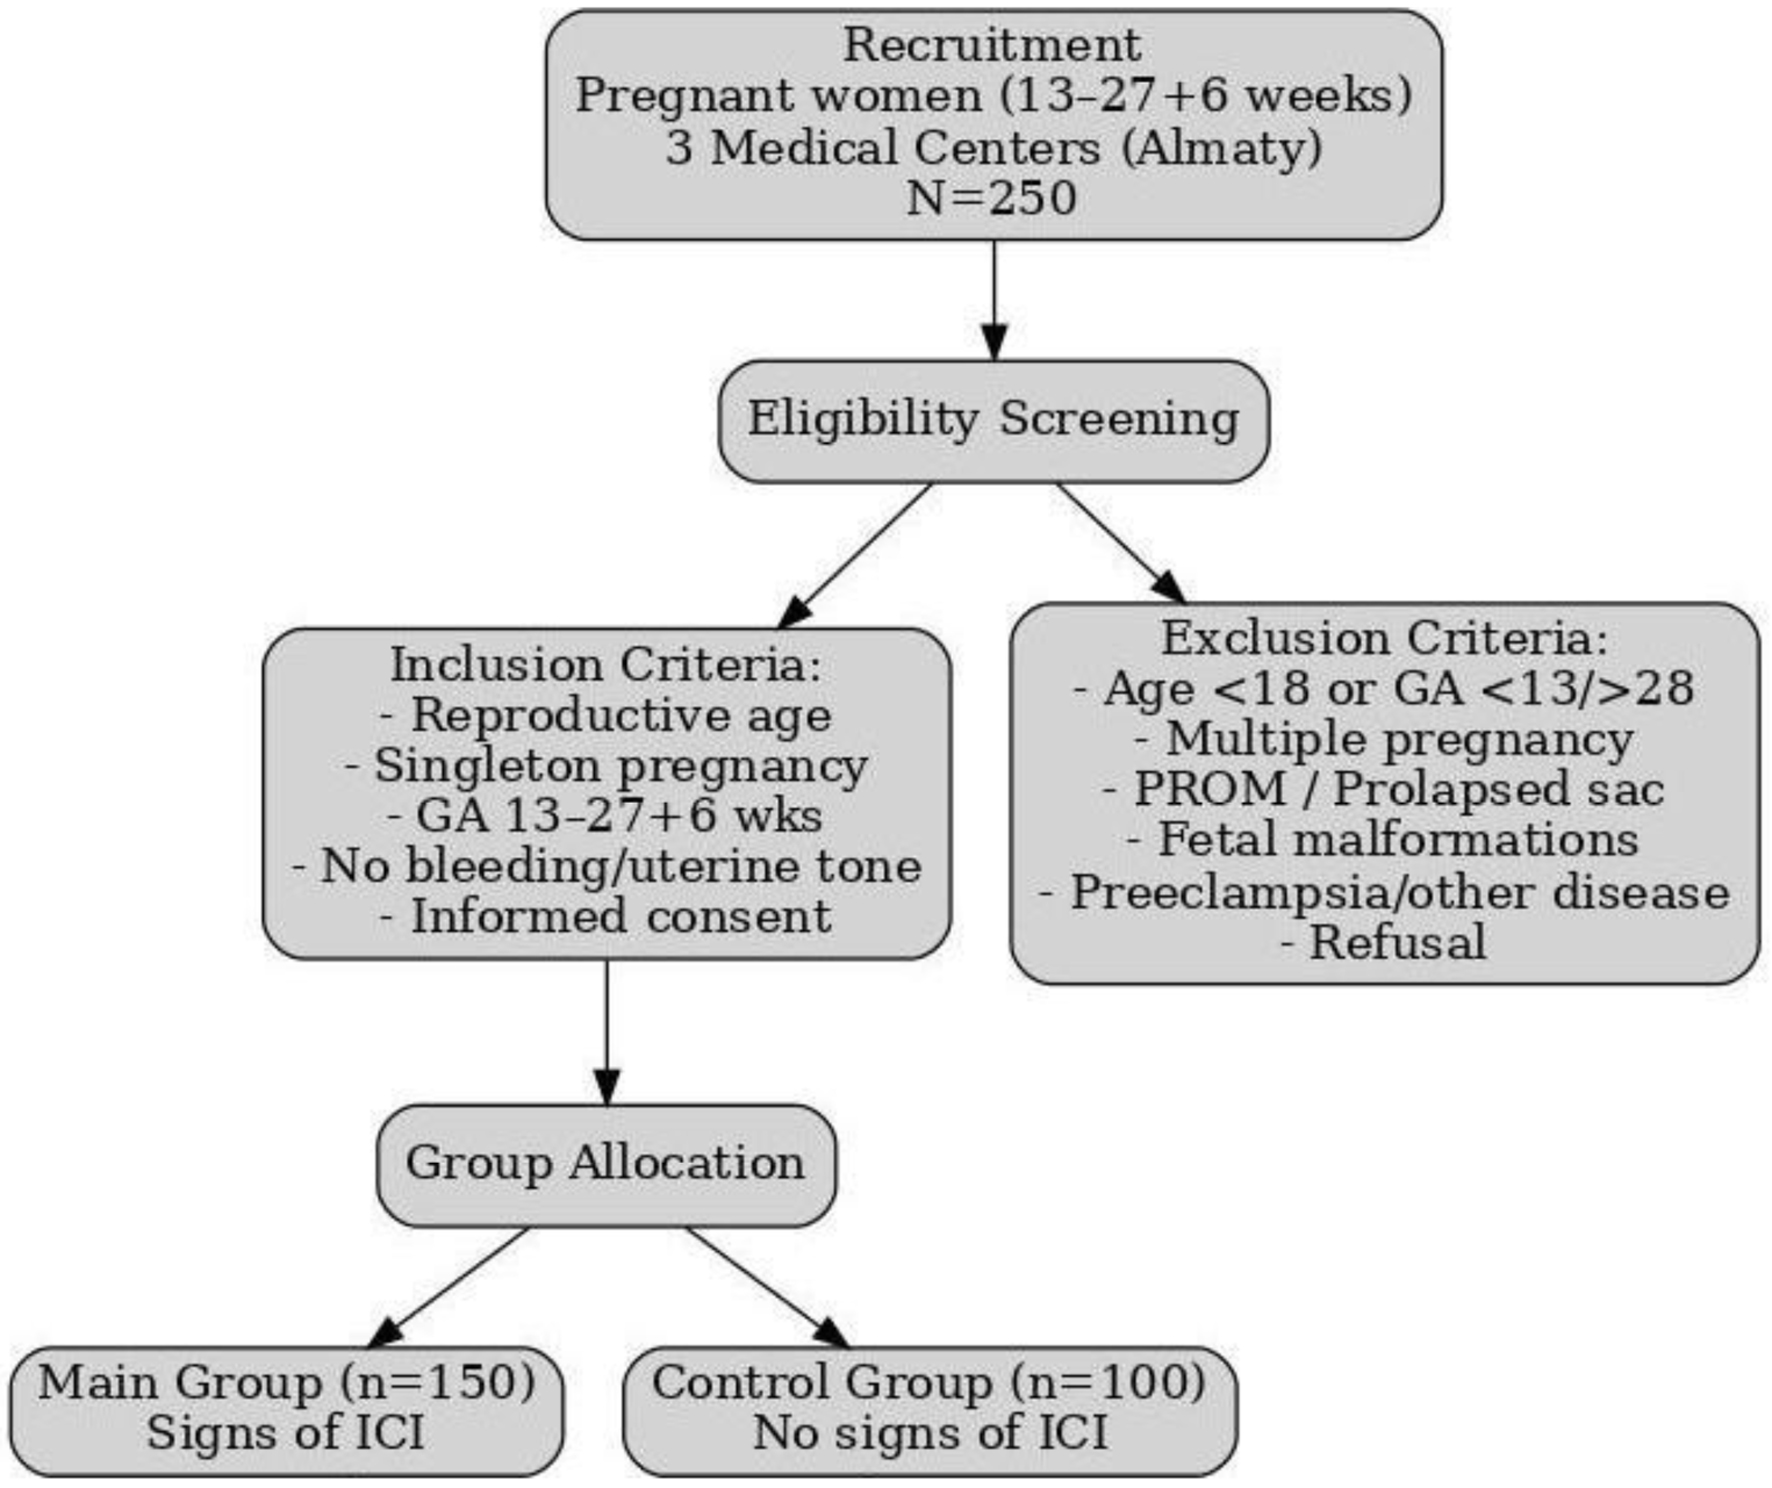
↓ Figure 1. Flowchart of patient selection and
study procedures.
| Journal of Clinical Medicine Research, ISSN 1918-3003 print, 1918-3011 online, Open Access |
| Article copyright, the authors; Journal compilation copyright, J Clin Med Res and Elmer Press Inc |
| Journal website https://jocmr.elmerjournals.com |
Original Article
Volume 17, Number 11, November 2025, pages 618-633
Evaluation of the Combined Use of Elastography and Cervicometry With the E-Cervix Index to Predict Second Trimester Preterm Birth Risk
Figures
Tables
| Parameter | Main group (n = 150) | Control group (n = 100) | P-value |
|---|---|---|---|
| *P < 0.05 indicates statistical significance. Age data are presented as mean ± standard deviation with 95% CI; weight, height, and BMI as median (IQR); marital and social status as absolute numbers (percentage). No statistically significant differences were observed in comorbidities between groups. BMI: body mass index; CI: confidence interval; IQR: interquartile range; UTI: urinary tract infection. | |||
| Age (years) | 30.24 ± 5.68 (29.32 - 31.16) | 32.17 ± 6.00 (30.98 - 33.36) | 0.011* |
| Weight (kg) | 61.50 (55.00 - 70.00) | 61.35 (55.00 - 71.75) | 0.944 |
| Height (cm) | 164 (160 - 168) | 163 (160 - 170) | 0.664 |
| BMI | 23.1 (20.8 - 25.8) | 22.2 (20.2 - 26.4) | 0.782 |
| Marital status | |||
| Married | 126 (84%) | 90 (90%) | 0.193 |
| Unmarried | 24 (16%) | 10 (10%) | |
| Social status | |||
| Housewives | 48 (68.6%) | 22 (31.4%) | 0.183 |
| Civil servants | 96 (56.1%) | 75 (43.9%) | |
| Students | 6 (66.7%) | 3 (33.3%) | |
| Comorbidities | |||
| Smoking | 8 (5.3%) | 6 (6.0%) | 0.812 |
| Alcohol use | 3 (2.0%) | 1 (1.0%) | 0.622 |
| Diabetes mellitus | 12 (8.0%) | 9 (9.0%) | 0.799 |
| Chronic infections (e.g., UTIs, hepatitis) | 15 (10.0%) | 12 (12.0%) | 0.691 |
| Category | Indicator | Main group (n = 150) | Control group (n = 100) | P-value |
|---|---|---|---|---|
| *P < 0.05 indicates statistically significant difference between groups. Adjusted analyses (logistic regression) accounted for maternal age, smoking, diabetes, and infections. Significant associations remained robust after adjustment. BV: bacterial vaginosis; DEC: diagnostic evacuation curettage; OMT: organ malformation of the cervix; STIs: sexually transmitted infections. | ||||
| Clinical conditions | Extragenital diseases | 52 (34.7%) | 45 (45.0%) | 0.001* |
| Threatening abortion/false contractions | 73 (48.7%) | 15 (15.0%) | 0.001* | |
| Gynecological history | Cervical polyp | 10 (6.7%) | 5 (5.0%) | 0.787 |
| Erosion/ectropion of cervix (history) | 73 (48.7%) | 65 (65.0%) | 0.014* | |
| Congenital anomaly of the cervix (OMT) | 18 (12.0%) | 6 (6.0%) | 0.130 | |
| Infections (BV, STIs, chorioamnionitis) | 25 (16.7%) | 22 (22.0%) | 0.323 | |
| Obstetric status | Primigravida-primipara | 56 (53.8%) | 48 (46.2%) | 0.190 |
| Multigravida-primipara | 41 (61.2%) | 26 (32.9%) | ||
| Multigravida-multipara | 53 (61.7%) | 26 (32.9%) | ||
| Burdened obstetric history | Spontaneous miscarriage | 20 (74.1%) | 7 (25.9%) | 0.023* |
| Medical abortion | 24 (64.9%) | 13 (35.1%) | 0.791 | |
| Missed miscarriage | 32 (21.3%) | 10 (10.0%) | 0.019* | |
| Ectopic pregnancy | 29 (19.3%) | 6 (6.0%) | 0.003* | |
| Preterm birth | 45 (88.2%) | 6 (11.8%) | 0.001* | |
| Previous operative interventions | Curettage of uterine cavity | 14 (9.3%) | 8 (8.0%) | 0.822 |
| Cesarean section/myomectomy | 15 (10.0%) | 7 (7.0%) | 0.498 | |
| DEC | 10 (6.7%) | 7 (7.0%) | 1.000 | |
| Measurement parameters | Main group (mean ± SD) | Control group (mean ± SD) |
|---|---|---|
| SD: standard deviation. | ||
| Cervical length, cm | 2.6 ± 0.5 | 3.5 ± 0.4 |
| Elasticity contrast index | 6.5 ± 1.2 | 4.2 ± 0.9 |
| Internal cervical os | 0.37 ± 0.10 | 0.55 ± 0.08 |
| External cervical os | 0.32 ± 0.09 | 0.50 ± 0.07 |
| Internal to external os stiffness ratio | 1.15 ± 0.3 | 1.10 ± 0.2 |
| Age (years) | Main group (n = 150) | Control group (n = 100) | ||||
|---|---|---|---|---|---|---|
| n | CL, cm (Me, IQR) | ECI (Me, IQR) | n | CL, cm (Me, IQR) | ECI (Me, IQR) | |
| CL: cervical length; ECI: elasticity contrast index; ICI: isthmic-cervical insufficiency; IQR: interquartile range; Me: median. | ||||||
| 19 - 24 | 23 | 2.51 (2.29 - 2.92) | 6.59 (6.25 - 7.10) | 12 | 3.06 (2.37 - 3.56) | 3.17 (2.01 - 3.80) |
| 25 - 30 | 47 | 2.63 (2.33 - 3.11) | 6.32 (6.20 - 6.69) | 24 | 3.21 (2.72 - 3.90) | 3.55 (2.95 - 4.28) |
| 31 - 36 | 61 | 2.56 (2.41 - 2.93) | 6.59 (6.25 - 6.93) | 41 | 3.77 (3.28 - 4.24) | 3.76 (3.25 - 4.38) |
| 37 - 42 | 15 | 2.87 (2.58 - 3.11) | 6.32 (6.20 - 6.70) | 19 | 3.72 (3.12 - 3.99) | 3.55 (2.85 - 4.36) |
| 43 and older | 4 | 2.73 (2.04 - 3.31) | 6.22 (5.72 - 6.65) | 4 | 3.18 (1.57 - 3.98) | 3.96 (3.02 - 4.42) |
| Parameter | AUC | Sensitivity (%) | Specificity (%) |
|---|---|---|---|
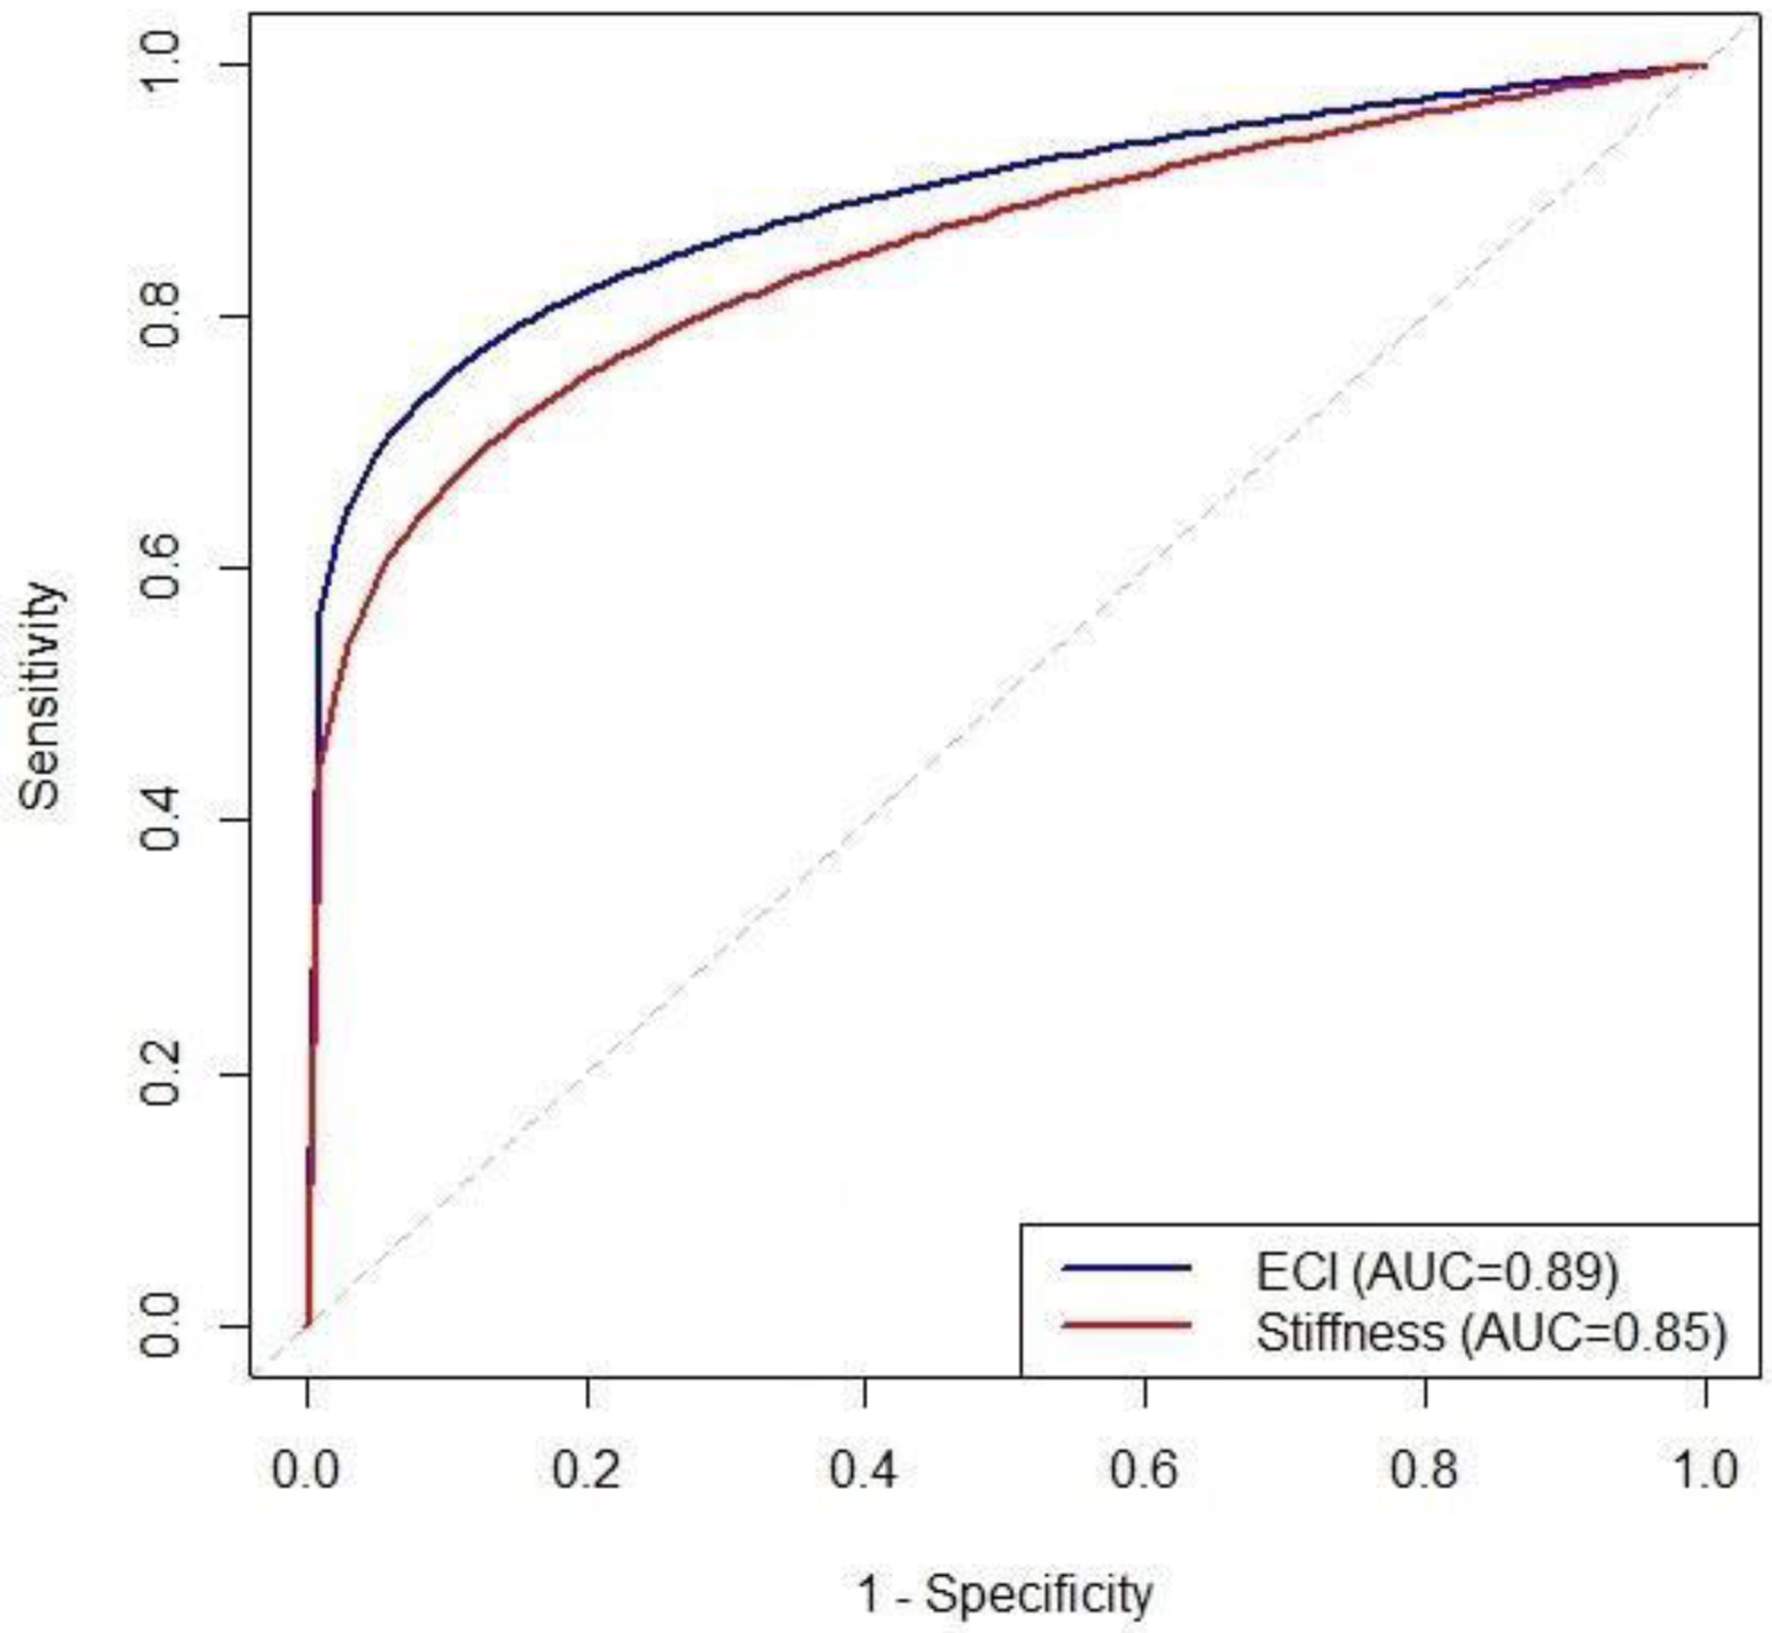
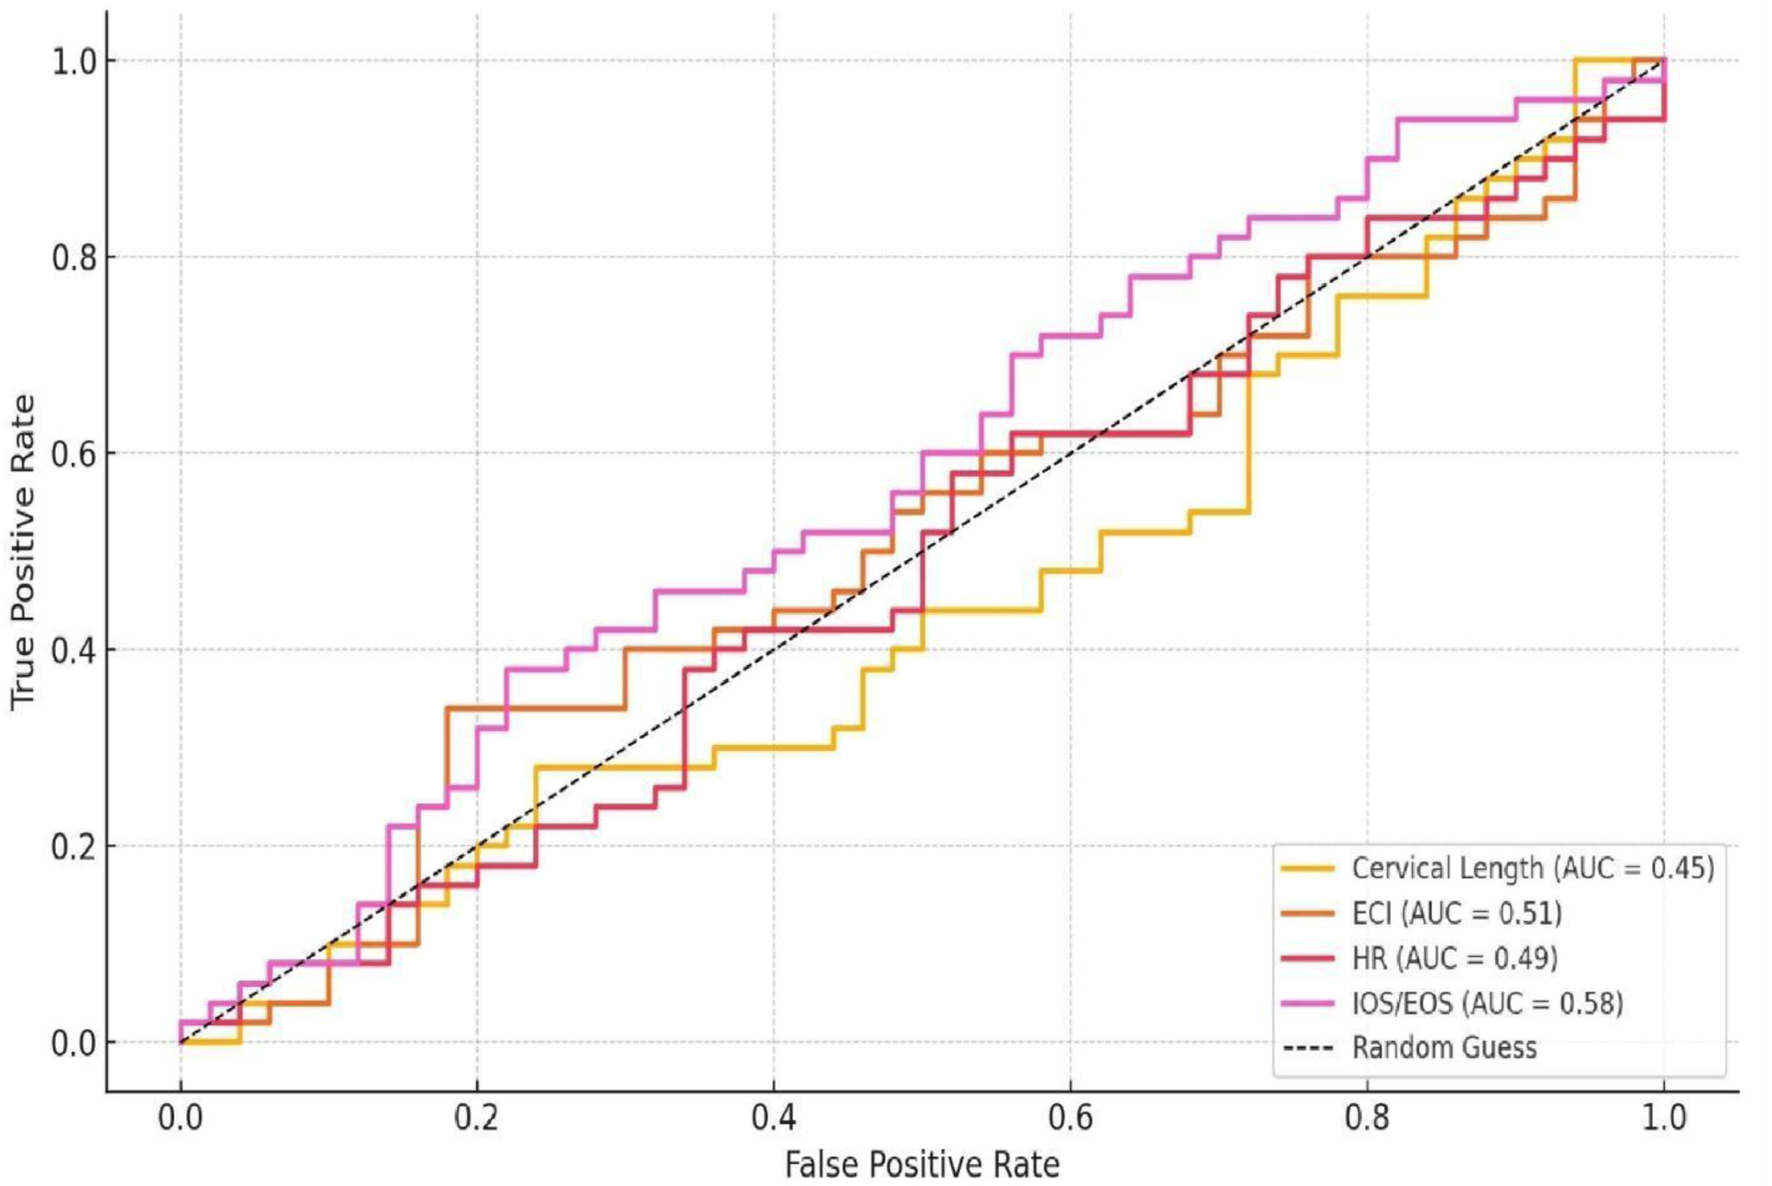
| Elasticity contrast index showed the strongest predictive value. Other indices such as cervical length, hardness ratio, and IOS/EOS separately had poor diagnostic performance (AUC ≤ 0.58). AUC: area under the curve; CL: cervical length; EOS: external cervical os; IOS: internal cervical os. | |||
| Elasticity contrast index | 0.89 | 87 | 85 |
| Stiffness coefficient | 0.85 | 83 | 82 |
| Internal to external os stiffness ratio | 0.82 | 79 | 78 |
| Other indices (CL, hardness ratio, IOS/EOS separate) | ≤ 0.58 | ||
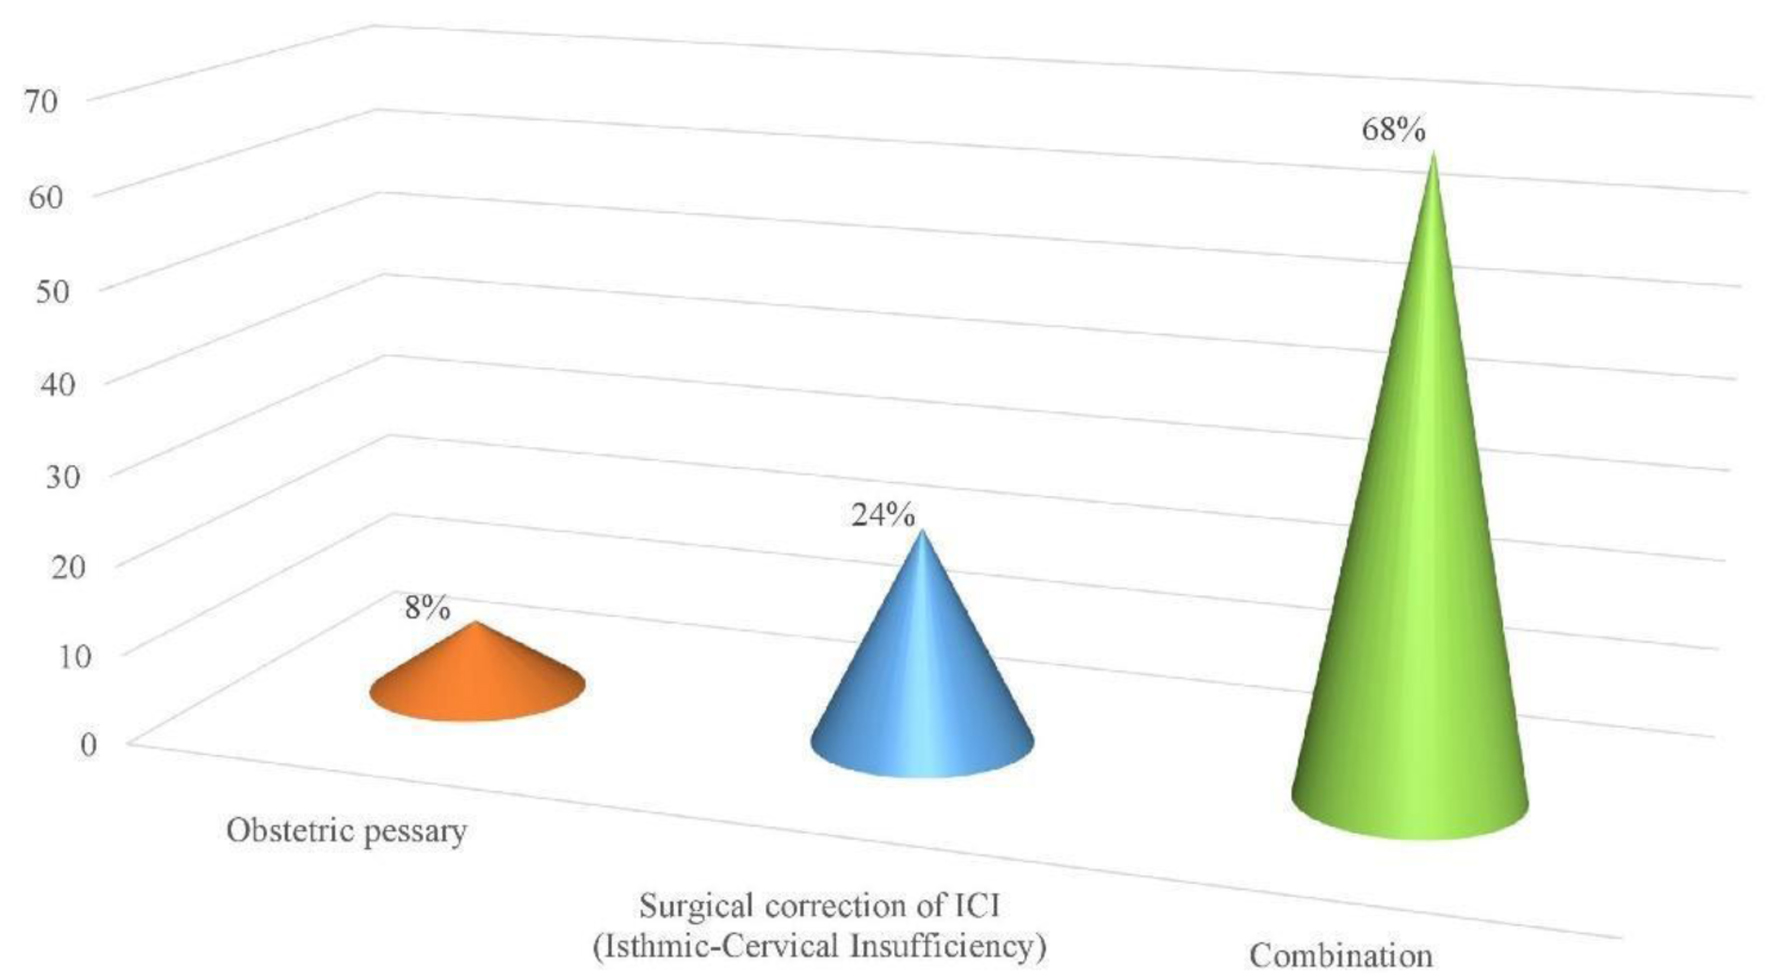
| Types | Methods of correction | Frequency (%) |
|---|---|---|
| ICI: isthmic-cervical insufficiency. | ||
| Single methods | Obstetric pessary | 20 (8%) |
| Surgical correction of ICI | 60 (24%) | |
| Combined methods | Obstetric pessary + progesterone preparations | 25 (10%) |
| Surgical correction of isthmic-cervical insufficiency of the cervix + obstetric pessary | 16 (6.4%) | |
| Surgical correction of isthmic-cervical insufficiency of the cervix + progesterone preparations | 21 (8.4%) | |
| Surgical correction of isthmic-cervical insufficiency of the cervix + obstetric pessary + progesterone preparations | 8 (3.2%) | |
| Indicators | Main group (n = 150) | Control group (n = 100) | P-value |
|---|---|---|---|
| ICI: isthmic-cervical insufficiency. | |||
| Pregnancy outcomes | |||
| Preterm birth, n (%) | 24 (16%) | 8 (8%) | 0.047 |
| Spontaneous labor, n (%) | 102 (68%) | 66 (66%) | |
| Prolonged pregnancy, n (%) | 24 (16%) | 26 (26%) | |
| Neonatal outcomes | |||
| Birth weight (kg, mean ± SD) | 2.8 ± 0.6 | 3.2 ± 0.5 | < 0.05 |
| Apgar score at 5 min (mean ± SD) | 7.5 ± 1.0 | 8.8 ± 0.7 | < 0.05 |
| Gestational age (weeks, mean ± SD) | 37 ± 3 | 38 ± 2 | < 0.05 |