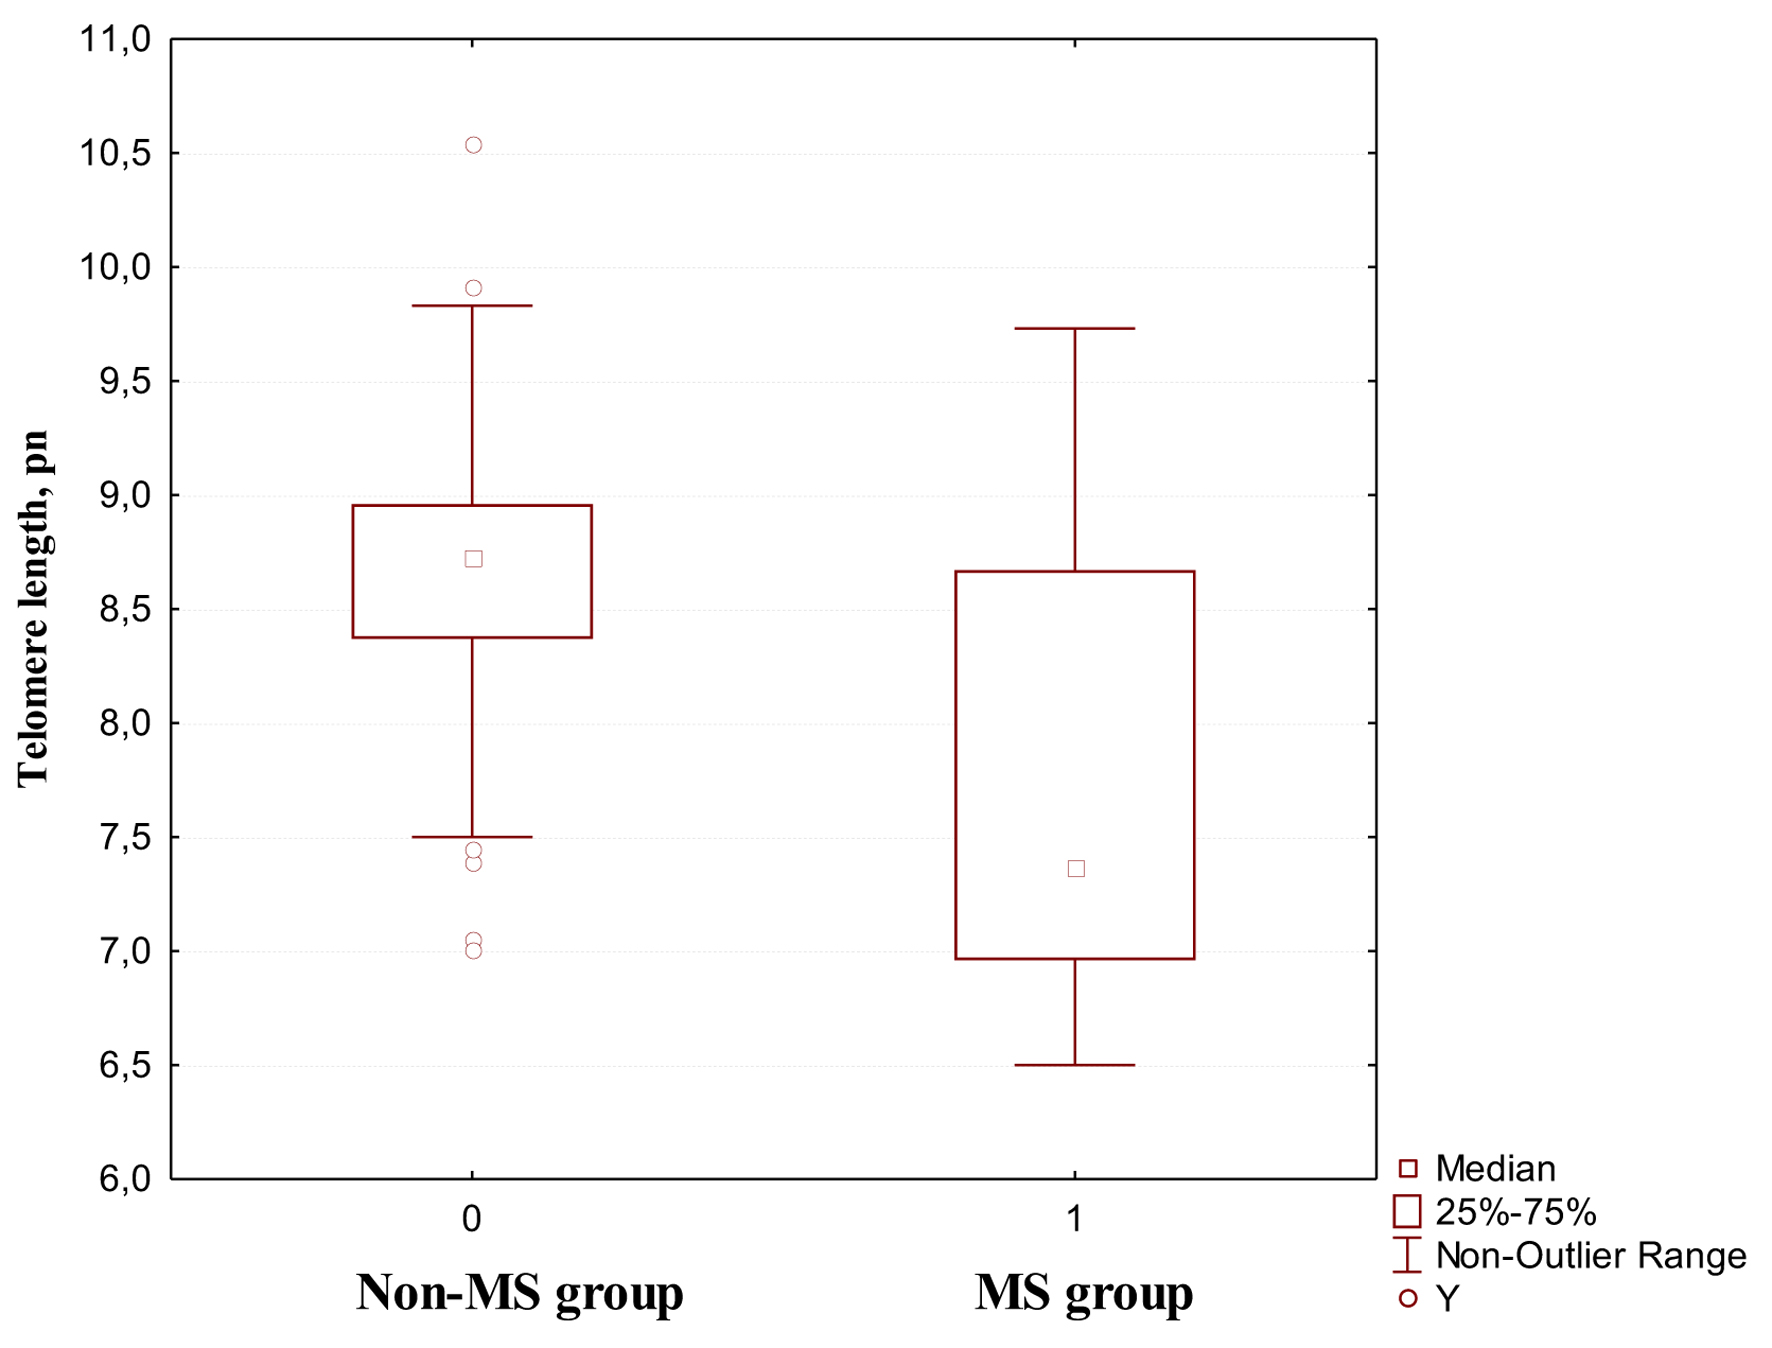
↓ Figure 1. Median telomere length depending on
the presence of metabolic syndrome.
| Journal of Clinical Medicine Research, ISSN 1918-3003 print, 1918-3011 online, Open Access |
| Article copyright, the authors; Journal compilation copyright, J Clin Med Res and Elmer Press Inc |
| Journal website https://jocmr.elmerjournals.com |
Original Article
Volume 17, Number 8, August 2025, pages 460-467
Telomere Length in Young Patients: Relationship With Metabolic Syndrome and Its Components
Figure
Tables
| Main group (n = 450) | Patients with telomere length assessment (n = 45) | P-value | |
|---|---|---|---|
| BMI: body mass index; DBP: diastolic blood pressure; EH: essential hypertension; МS: metabolic syndrome; SBP: systolic blood pressure. | |||
| Sex, male/female, % | 48.7/51.3 | 44.4/55.6 | 0.25 |
| Age, years | 30 (21 - 42) | 26 (21 - 39) | 0.09 |
| BMI, kg/m2 | 24.01 (20.2 - 31.8) | 23 (22 - 29.7) | 0.44 |
| Obesity by BMI, % | 19.7 | 24.4 | 0.09 |
| EH, % | 34 | 24.4 | 0.06 |
| МS, % | 26 | 22.2 | 0.13 |
| SBP, mm Hg | 121 (111 - 136) | 124 (114 - 135) | 0.09 |
| DBP, mm Hg | 71 (64 - 81) | 78 (71 - 85) | 0.07 |
| Smoking, % | 40.6 | 42.2 | 0.39 |
| MS group (n = 10) | Non-MS group (n = 35) | P | |
|---|---|---|---|
| BAI: body adiposity index; BFP: body fat percentage; BMI: body mass index; DBP: diastolic blood pressure; EH: essential hypertension; HC: hip circumference; HDL: high-density lipoprotein; LAP: lipid accumulation product index; LDL: low-density lipoprotein; МS: metabolic syndrome; NC: neck circumference; SBP: systolic blood pressure; TC: total cholesterol; TG: triglycerides; VAI: visceral adiposity index; WC: waist circumference. | |||
| Sex, male/female, % | 50/50 | 40/60 | 0.57 |
| Age, years | 28.5 (23 - 43) | 26 (21 - 37) | 0.35 |
| Smoking, % | 50 | 40 | 0.57 |
| BMI, kg/m2 | 30.95 (30 - 34.2) | 22.6 (20.7 - 23.9) | < 0.001 |
| WC, cm | 119 (110 - 125) | 79 (71 - 83) | < 0.001 |
| HC, cm | 117.5 (115 - 118) | 95 (92 - 98) | < 0.001 |
| NC, cm | 39 (38 - 42) | 33 (31 - 34) | < 0.001 |
| Obesity (BMI > 30 kg/m2), % | 90 | 8.57 | < 0.001 |
| EH, % | 50 | 17.14 | 0.03 |
| SBP, mm Hg | 157 (124 - 165) | 120 (112 - 130) | 0.01 |
| DBP, mm Hg | 90 (80 - 96) | 77 (70 - 83) | 0.005 |
| Dyslipidemia, % | 90 | 34.29 | 0.002 |
| TC, mmol/L | 6.01 (3.6 - 6.8) | 4.7 (3.9 - 5.1) | 0.04 |
| TG, mmol/L | 2.75 (1.9 - 3.0) | 1.2 (0.7 - 1.9) | < 0.001 |
| LDL, mmol/L | 2.9 (2.8 - 3.5) | 2.8 (2.1 - 3.1) | 0.16 |
| HDL, mmol/L | 1.09 (0.9 - 1.54) | 1.7 (1.08 - 1.8) | 0.07 |
| Hyperglycemia, % | 20% | 0% | 0.007 |
| Glucose, mmol/L | 4.88 (4.1 - 5.5) | 4.3 (3.9 - 4.9) | 0.19 |
| LAP | 138.7 (90.6 - 156) | 16.17 (9.7 - 38.2) | < 0.001 |
| VAI | 1.37 (0.5 - 5.01) | 0.78 (0.56 - 0.9) | 0.35 |
| BFP, % | 33.3 (28.7 - 43.9) | 25.8 (17.6 - 29.2) | 0.001 |
| BAI | 33.6 (29.7 - 38.5) | 24.8 (21.5 - 27.4) | < 0.001 |
| Telomere length, pn | 7.36 (6.96 - 8.67) | 8.72 (8.37 - 8.96) | 0.02 |
| Parameter | Strength and reliability of the relationship, P < 0.05 |
|---|---|
| BAI: body adiposity index; DBP: diastolic blood pressure; HC: hip circumference; HDL: high-density lipoprotein; LAP: lipid accumulation product; LDL: low-density lipoprotein; NC: neck circumference; МS: metabolic syndrome; TC: total cholesterol; TG: triglycerides; VAI: visceral adiposity index; WC: waist circumference. | |
| Smoking | r = -0.35 |
| presence of MS | r = -0.36 |
| DBP | r = -0.31 |
| Dyslipidemia | r = -0.76 |
| WC | r = -0.3 |
| HC | r = -0.35 |
| NC | r = -0.53 |
| TC | r = -0.64 |
| HDL | r = 0.59 |
| TG | r = -0.46 |
| LDL | r = -0.52 |
| Glucose | r = -0.33 |
| LAP | r = -0.4 |
| VAI (men) | r = -0.57 |
| BAI | r = -0.32 |
| Model | Parameter | B | Standard error of B | P |
|---|---|---|---|---|
| BAI: body adiposity index; BFP: body fat percentage; BMI: body mass index; DBP: diastolic blood pressure; EH: essential hypertension; HC: hip circumference; HDL: high-density lipoprotein; LAP: lipid accumulation product; LDL: low-density lipoprotein; NC: neck circumference; SBP: systolic blood pressure; TC: total cholesterol; TG: triglycerides; VAI: visceral adiposity index; WC: waist circumference. | ||||
| Model 1 | Overall significance | 12.08 | 1.15 | < 0.001 |
| Sex | - | - | > 0.05 | |
| Age | -0.04 | 0.02 | 0.03 | |
| Smoking | -0.87 | 0.26 | 0.001 | |
| EH | - | - | > 0.05 | |
| SBP | - | - | > 0.05 | |
| DBP | - | - | > 0.05 | |
| Model 2 | Overall significance | 15.6 | 1.7 | < 0.001 |
| Weight | - | - | > 0.05 | |
| BMI | - | - | > 0.05 | |
| WC | - | - | > 0.05 | |
| HC | - | - | > 0.05 | |
| NC | -0.23 | 0.07 | 0.001 | |
| Model 3 | Overall significance | 10.7 | 0.87 | < 0.001 |
| Glucose | - | - | > 0.05 | |
| TC | -0.37 | 0.87 | < 0.001 | |
| LDL | - | - | > 0.05 | |
| HDL | 0.59 | 0.24 | 0.02 | |
| TG | - | - | > 0.05 | |
| Model 4 | Overall significance | 9.5 | 0.55 | < 0.001 |
| LAP | -0.01 | 0.02 | < 0.01 | |
| VAI | - | - | > 0.05 | |
| VAI (men) | -0.37 | 0.16 | 0.02 | |
| VAI (women) | - | - | > 0.05 | |
| BAI | - | - | > 0.05 | |
| BFP | - | - | > 0.05 | |
| Model 5 | Overall significance | 9.06 | 0.14 | < 0.001 |
| Presence of abdominal obesity | - | - | > 0.05 | |
| EH | - | - | > 0.05 | |
| Presence of dyslipidemia | -1.13 | 0.23 | < 0.001 | |
| Presence of hyperglycemia | - | - | > 0.05 | |