Journal of Clinical Medicine Research, ISSN 1918-3003 print, 1918-3011 online, Open Access
Article copyright, the authors; Journal compilation copyright, J Clin Med Res and Elmer Press Inc
Journal website https://jocmr.elmerjournals.com

Original Article

Volume 18, Number 1, January 2026, pages 31-41


Efficacy and Safety of Regional Citrate Anticoagulation in Neurocritical Care Patients With Chronic Severe Hypernatremia Undergoing Continuous Renal Replacement Therapy: A Single-Center Retrospective Study

Figures

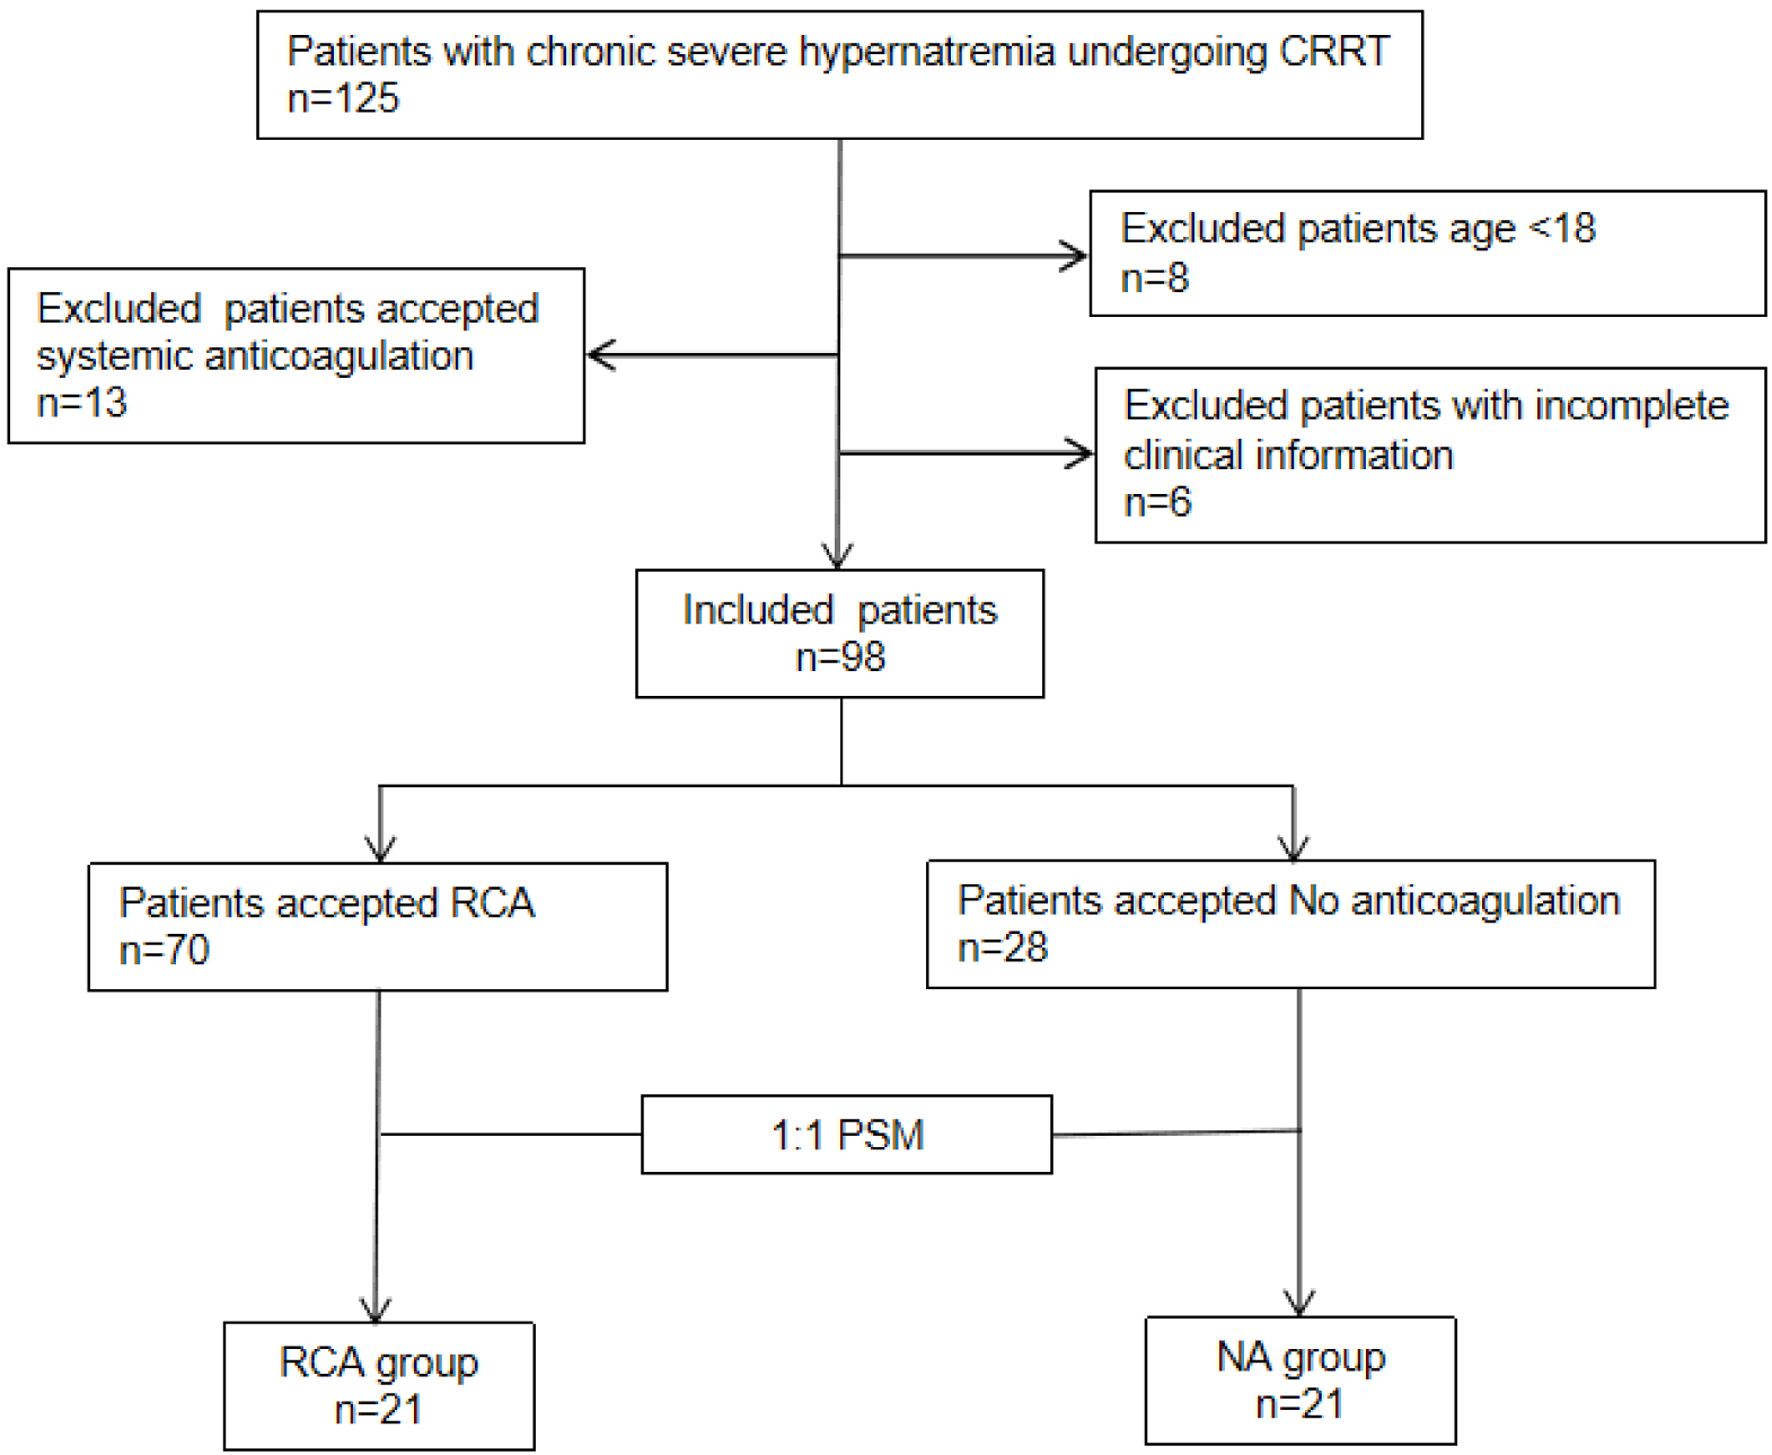
↓  Figure 1. Flow chart of enrollment. Included patients (n = 98) were divided into two groups: regional citrate anticoagulation (RCA) groups (n = 70) and no anticoagulation (NA) groups (n = 28). A 1:1 propensity score matching (PSM) was performed to create two balanced groups: “NA group” and “RCA group,” each with n = 21 patients.
Figure 1.
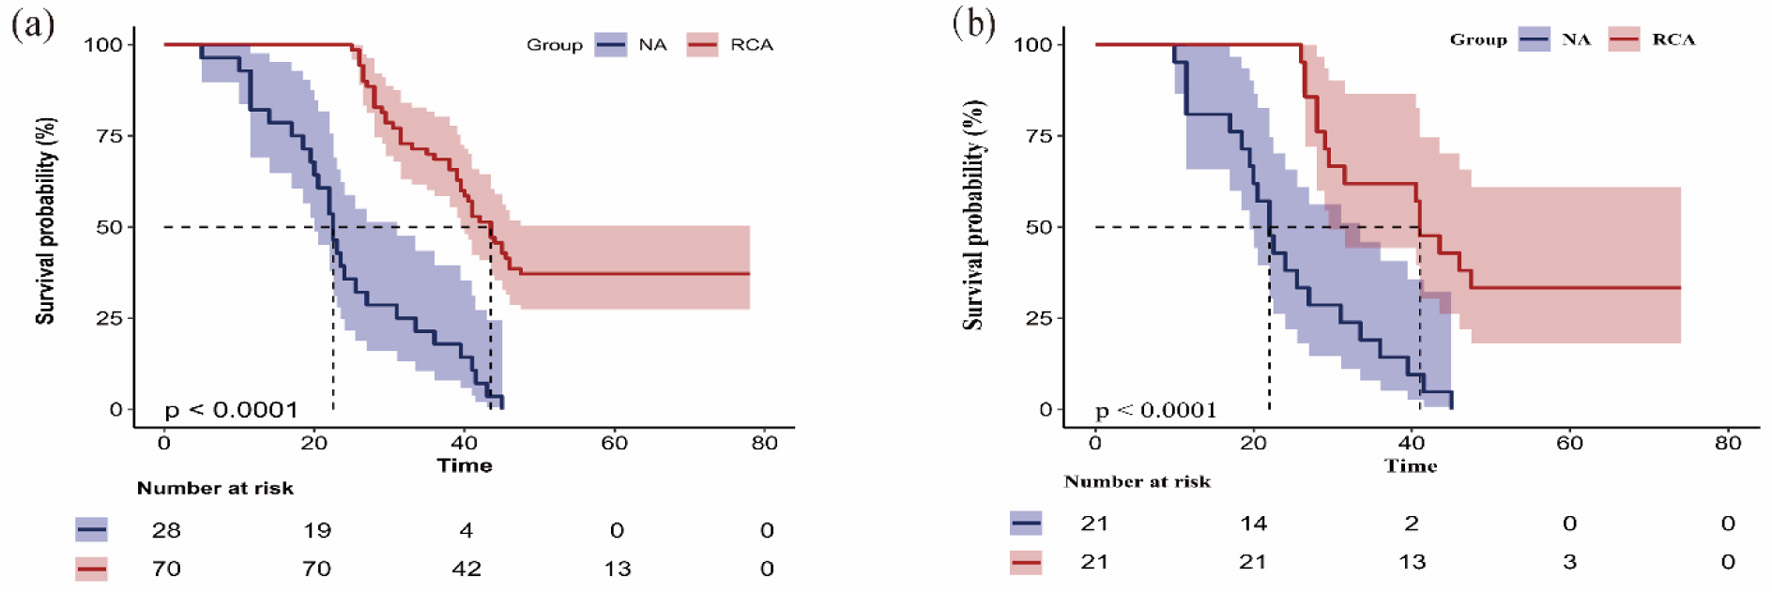
↓  Figure 2. Kaplan-Meier curve shows the filter lifespan of the first filter of the regional citrate anticoagulation (RCA) group and no anticoagulation (NA) group in the original cohort (a) and the matched cohort (b). The Kaplan-Meier survival curves demonstrated significant differences in first filter lifespan between the two anticoagulation groups. The overall median filter survival time was 39.0 h (95% CI, 34.1–43.9). Median filter lifespan was 22.5 h in NA group (95% CI 19.9–25.1). Median lifespan was significantly longer at 43.5 h in RCA group (95% CI, 39.8–47.2) (a). Kaplan-Meier survival curves after matching. The first filter lifespan was considerably longer in the RCA group compared to the NA group (P < 0.001) (b). 95% CI: 95% confidence interval.
Figure 2.
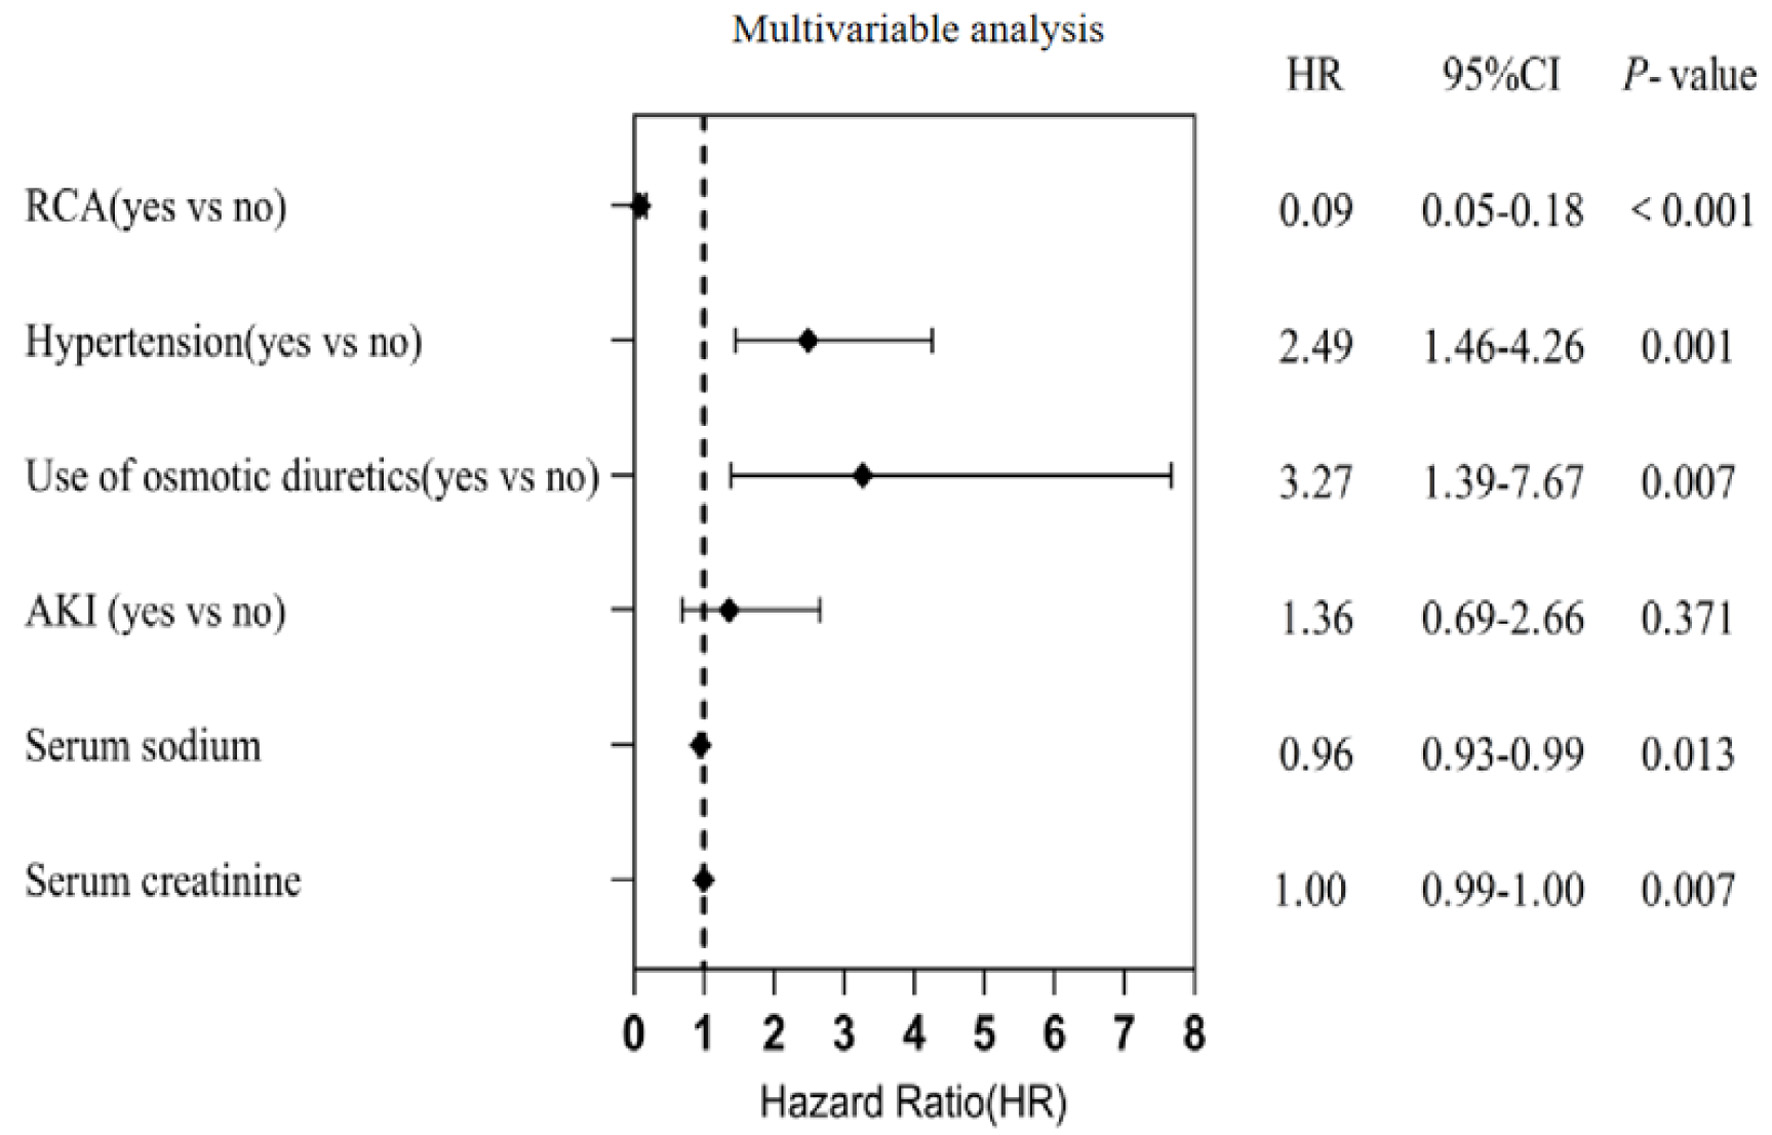
↓  Figure 3. Multivariable Cox proportional risk model regression analysis affecting the lifespan of the first filter. Regional citrate anticoagulation (RCA) remained a significant independent predictor of prolonged first filter lifespan after adjustment for covariates (HR = 0.09, 95% CI, 0.05−0.18). 95% CI: 95% confidence interval; HR: hazard ratio.
Figure 3.

Tables

↓  Table 1. Baseline Characteristics of Patients Before and After PSM
 
Variables Before PSM After PSM
Total (n = 98) RCA (n = 70) NA (n = 28) P Total (n = 42) RCA (n = 21) NA (n = 21) P
ALB: albumin; AKI: acute kidney injury; APACHE II: Acute Physiology and Chronic Health Evaluation II; aPTT: activated partial thromboplastin time; GCS: Glasgow Coma Scale; Hb: hemoglobin; NA: no anticoagulation; PLT: platelet; PSM: propensity score matching; PT: prothrombin time; RCA: regional citrate anticoagulation.
Male 69 (70.4) 49 (70) 20 (71.4) 0.889 33 (78.6) 16 (76.2) 17 (81) > 0.99
Age, years 53.0 ± 14.5 52.5 ± 13.0 54.2 ± 17.9 0.603 53.5 ± 16.7 51.5 ± 14.6 55.4 ± 18.8 0.461
APACHE II score 28.3 ± 4.5 27.9 ± 4.5 29.2 ± 4.5 0.213 28.4 ± 3.2 28.8 ± 3.0 28.0 ± 3.4 0.448
GCS score 3.0 ± 1.8 3.2 ± 2.0 2.6 ± 1.2 0.146 2.8 ± 1.1 2.7 ± 1.0 2.8 ± 1.3 0.791
Mechanical ventilation 86 (87.8) 62 (88.6) 24 (85.7) 0.738 40 (95.2) 20 (95.2) 20 (95.2) > 0.99
Neurologic disease 0.429 0.156
  Traumatic brain injury 35 (35.7) 27 (38.6) 8 (28.6) 15 (35.7) 7 (33.3) 8 (38.1)
  Intracerebral hemorrhage 39 (39.8) 25 (35.7) 14 (50) 21 (50.0) 13 (61.9) 8 (38.1)
  Subarachnoid hemorrhage 4 (4.1) 4 (5.7) 0 (0) 0 (0) 0 (0) 0 (0)
  Other categories 20 (20.4) 14 (20) 6 (21.4) 6 (14.3) 1 (4.8) 5 (23.8)
Post craniocerebral operation 74 (75.5) 55 (78.6) 19 (67.9) 0.265 30 (71.4) 15 (71.4) 15 (71.4) > 0.99
Comorbidity
  Hypertension 50 (51.0) 34 (48.6) 16 (57.1) 0.443 24 (57.1) 11 (52.4) 13 (61.9) 0.533
  Diabetes 23 (23.5) 14 (20) 9 (32.1) 0.2 11 (26.2) 4 (19) 7 (33.3) 0.292
Use of osmotic diuretics 83 (84.7) 61 (87.1) 22 (78.6) 0.353 36 (85.7) 18 (85.7) 18 (85.7) > 0.99
AKI 70 (71.4) 46 (65.7) 24 (85.7) 0.048 33 (78.6) 16 (76.2) 17 (81) > 0.99
AKI stage 0.003 0.616
  AKI stage 1 39 (39.8) 30 (42.9) 9 (32.1) 16 (38.1) 8 (38.1) 8 (38.1)
  AKI stage 2 20 (20.4) 13 (18.6) 7 (25.0) 10 (23.8) 6 (28.6) 4 (19.0)
  AKI stage 3 11 (11.2) 3 (4.3) 8 (28.6) 7 (16.7) 2 (9.5) 5 (23.8)
Urine volume, mL 3,415.1 ± 1,776.0 3,514.0 ± 1,715.4 3,167.8 ± 1,929.5 0.386 3,502.2 ± 1,684.6 3,597.8 ± 1,593.8 3,406.6 ± 1,805.1 0.718
Serum sodium, mmol/L 171.7 ± 8.9 172.3 ± 9.4 170.4 ± 7.7 0.349 171.2 ± 8.4 170.2 ± 9.3 172.1 ± 7.6 0.472
Total calcium, mmol/L, 2.3 ± 0.2 2.3 ± 0.2 2.3 ± 0.2 0.304 2.3 ± 0.2 2.4 ± 0.3 2.3 ± 0.2 0.523
Serum creatinine, µmol/L, 176.3 ± 127.2 147.8 ± 95.7 247.8 ± 165.2 < 0.001 205.3 ± 132.4 195.2 ± 113.1 215.3 ± 151.5 0.629
Serum urea, mmol/L 17.4 ± 11.3 16.5 ± 11.3 19.8 ± 11.1 0.191 20.3 ± 11.2 20.5 ± 9.8 20.1 ± 12.7 0.894
Hb, g/L 107.1 ± 23.5 104.8 ± 24.0 112.6 ± 21.7 0.138 111.4 ± 23.3 112.2 ± 25.6 110.6 ± 21.4 0.83
PLT count, × 109/L 139.7 ± 80.4 144.8 ± 79.1 126.9 ± 83.6 0.321 142.0 ± 80.5 146.6 ± 71.3 137.3 ± 90.4 0.715
PT (s) 14.9 ± 3.2 15.0 ± 3.5 14.8 ± 2.4 0.768 14.6 ± 1.7 14.8 ± 1.5 14.4 ± 1.9 0.484
aPTT (s) 30.6 ± 8.2 30.5 ± 8.7 30.6 ± 7.1 0.976 30.3 ± 6.0 31.2 ± 6.0 29.5 ± 5.9 0.369
Serum ALB, g/L 34.6 ± 5.9 34.0 ± 6.1 36.0 ± 5.1 0.133 36.5 ± 6.2 36.1 ± 7.3 37.0 ± 5.1 0.674
Serum total bilirubin, mmol/L 16.6 ± 13.3 15.8 ± 13.6 18.6 ± 12.5 0.357 16.4 ± 10.1 15.8 ± 10.5 16.9 ± 10.0 0.724


↓  Table 2. Outcomes of Serum Sodium Reduction Rate and Adverse Events
 
Variables Before PSM After PSM
Total (n = 98) RCA (n = 70) NA (n = 28) P value Total (n = 42) RCA (n = 21) NA (n = 21) P value
CRRT: continuous renal replacement therapy; NA: no anticoagulation; PSM: propensity score matching; RCA: regional citrate anticoagulation.
Post CRRT serum sodium, mmol/L 148.6 ± 7.0 147.9 ± 6.8 150.5 ± 7.2 0.094 148.8 ± 7.1 146.8 ± 6.1 150.8 ± 7.6 0.068
Mean hypernatremia correction rates, mmol/L/h 0.5 ± 0.1 0.5 ± 0.1 0.5 ± 0.1 0.587 0.5 ± 0.1 0.5 ± 0.2 0.5 ± 0.1 0.613
CRRT duration, h 49.2 ± 22.5 52.6 ± 22.2 40.8 ± 21.2 0.017 45.9 ± 19.7 49.2 ± 17.6 42.7 ± 21.5 0.291
Adverse events rate, n (%)
  Bleeding 14 (14.3) 6 (8.6) 8 (28.6) 0.021 5 (11.9) 0 (0) 5 (23.8) 0.048
  Frequent filter clotting 17 (17.3) 0 (0) 17 (60.7) < 0.001 12 (28.6) 0 (0) 12 (57.1) < 0.001
  Metabolic acidosis 14 (14.3) 9 (12.9) 5 (17.9) 0.534 5 (11.9) 2 (9.5) 3 (14.3) 1
  Metabolic alkalosis 13 (13.3) 7 (10) 6 (21.4) 0.186 7 (16.7) 2 (9.5) 5 (23.8) 0.41
  Hypocalcemia 5 (5.1) 2 (2.9) 3 (10.7) 0.139 2 (4.8) 1 (4.8) 1 (4.8) 1
  Citrate accumulation 6 (6.1) 6 (8.6) 0 (0) 0.178 1 (2.4) 1 (4.8) 0 (0) 1


↓  Table 3. Comparison of Laboratory Indicators Before and After CRRT (Original Cohort)
 
Group Time Total calcium (mmol/L) Serum creatinine (µmol/L) Serum urea (mmol/L) Hb (g/L) PLT count (× 109/L) PT (s) aPTT (s) Serum ALB (mmol/L) Serum total bilirubin (mmol/L)
aCompared with the NA group before CRRT, P < 0.05. bCompared with in this group before CRRT, P < 0.05. ALB: albumin; aPTT: activated partial thromboplastin time; CRRT: continuous renal replacement therapy; Hb: hemoglobin; NA: no anticoagulation; PLT: platelet; PT: prothrombin time; RCA: regional citrate anticoagulation.
RCA (n = 70) Before CRRT 2.3 ± 0.2 147.8 ± 95.7a 16.5 ± 11.3 104.8 ± 24.0 144.8 ± 79.1 15.0 ± 3.5 30.5 ± 8.7 34.0 ± 6.1 15.8 ± 13.6
After CRRT 2.5 ± 0.2b 100.1 ± 58.2b 12.1 ± 7.1b 104.1 ± 21.5 104.6 ± 72.1b 15.1 ± 3.2 32.3 ± 5.0b 36.8 ± 5.1b 18.4 ± 7.5b
Difference −0.1 ± 0.3 16.5 ± 11.3 4.4 ± 8.2 0.8 ± 15.7 40.2 ± 60.6 0.0 ± 3.7 −1.8 ± 8.4 −2.8 ± 6.4 −2.6 ± 14.0
NA (n = 28) Before CRRT 2.3 ± 0.2 247.8 ± 165.2 19.8 ± 11.1 112.6 ± 21.7 126.9 ± 83.6 14.8 ± 2.4 30.6 ± 7.1 36.0 ± 5.1 18.6 ± 12.5
After CRRT 2.4 ± 0.2b 166.8 ± 100.5b 14.9 ± 6.5b 106.9 ± 22.8 84.1 ± 54.1b 14.6 ± 2.4 33.3 ± 7.2b 36.2 ± 6.1 23.6 ± 14.2b
Difference −0.2 ± 0.3 81.0 ± 113.5 4.9 ± 7.9 5.7 ± 21.3 42.8± 41.7 0.2 ± 2.9 −2.7 ± 8.0 −0.2 ± 7.6 −5.0 ± 12.9


↓  Table 4. Comparison of Laboratory Indicators Before and After CRRT (Matched Cohort)
 
Group Time Total calcium (mmol/L) Serum creatinine (µmol/L) Serum urea (mmol/L) Hb (g/L) PLT count (× 109/L) PT (s) aPTT (s) Serum ALB (mmol/L) Serum total bilirubin (mmol/L)
bCompared with in this group before CRRT, P < 0.05. ALB: albumin; aPTT: activated partial thromboplastin time; CRRT: continuous renal replacement therapy; Hb: hemoglobin; NA: no anticoagulation; PLT: platelet; PT: prothrombin time; RCA: regional citrate anticoagulation.
RCA (n = 21) Before CRRT 2.4 ± 0.3 195.2 ± 113.1 20.5 ± 9.8 112.2 ± 25.6 146.6 ± 71.3 14.8 ± 1.5 31.2 ± 6.0 36.1 ± 7.3 15.8 ± 10.5
After CRRT 2.5 ± 0.2 122.5 ± 72.4b 14.3 ± 6.3b 112.1 ± 22.9 118.3 ± 90.2b 15.2 ± 2.2 34.8 ± 5.3b 37.5 ± 4.7 19.8 ± 7.3b
Difference −0.1 ± 0.3 72.7 ± 51.1 6.1 ± 7.4 0.1 ± 11.4 28.2 ± 53.0 −0.5 ± 3.0 −3.6 ± 6.8 −1.3 ± 6.2 −3.9 ± 10.7
NA (n = 21) Before CRRT 2.3 ± 0.2 215.3 ± 151.5 20.1 ± 12.7 110.6 ± 21.4 137.3 ± 90.4 14.4 ± 1.9 29.5 ± 5.9 37.0 ± 5.1 16.9 ± 10.0
After CRRT 2.5 ± 0.3 134.4 ± 73.6b 14.1 ± 6.5b 107.6 ± 21.5 88.9 ± 56.6b 14.6 ± 2.5 34.0 ± 8.1b 37.1 ± 6.2 21.8 ± 10.6b
Difference −0.2 ± 0.3 80.9 ± 92.7 6.2 ± 6.9 3.0 ± 21.3 48.5 ± 45.2 −0.2 ± 2.5 −4.5 ± 7.4 −0.2 ± 7.7 −4.9 ± 11.9


↓  Table 5. Univariate and Multivariable Cox Regression Analyses of the Risk Factors of the First Filter Lifespan (Original Cohort)
 
Variables Univariate analysis Multivariable analysis
HR 95% CI P value HR 95% CI P value
Note: The multivariable Cox proportional hazards model was constructed by including all variables with a P-value < 0.05 in the univariate analysis (i.e., RCA, hypertension, use of osmotic diuretics, AKI, serum sodium, and serum creatinine). The variance inflation factor (VIF) for each covariate in the final model was < 5, indicating no significant multicollinearity. AKI: acute kidney injury; CI: confidence interval; HR: hazard ratio; RCA: regional citrate anticoagulation.
RCA (yes vs. no) 0.19 0.11–0.31 < 0.001 0.09 0.05–0.18 < 0.001
Hypertension (yes vs. no) 2.08 1.29–3.35 0.003 2.49 1.46–4.26 0.001
Use of osmotic diuretics (yes vs. no) 2.19 1.00–4.78 0.05 3.27 1.39–7.67 0.007
AKI (yes vs. no) 2.22 1.23–3.98 0.008 1.36 0.69–2.66 0.371
Serum sodium 0.96 0.93–0.99 0.006 0.96 0.93–0.99 0.013
Serum creatinine 1.002 1.0005–1.0039 0.012 1.00 0.99–1.00 0.007


↓  Table 6. Comparison of Hospitalization Before and After PSM
 
Variables Before PSM After PSM
Total (n = 98) RCA (n = 70) NA (n = 28) P value Total (n = 42) RCA (n = 21) NA (n = 21) P value
ICU: intensive care unit; NA: no anticoagulation; PSM: propensity score matching; RCA: regional citrate anticoagulation.
Days in ICU 19.5 ± 16.1 21.0 ± 17.5 15.7 ± 11.7 0.146 15.9 ± 10.6 16.4 ± 11.5 15.3 ± 10.0 0.732
Costs in hospital, yuan 229,919.7 ± 213,678.5 258,761.0 ± 240,991.8 157,816.6 ± 89,807.1 0.034 192,082.6 ± 138,796.6 228,431.1 ± 168,930.5 155,734.1 ± 90,444.3 0.09
In-hospital mortality 18 (18.4) 10 (14.3) 8 (28.6) 0.099 9 (21.4) 2 (9.5) 7 (33.3) 0.13
Mortality on 28 days 63 (64.3) 42 (60) 21 (75) 0.162 31 (73.8) 16 (76.2) 15 (71.4) 0.726