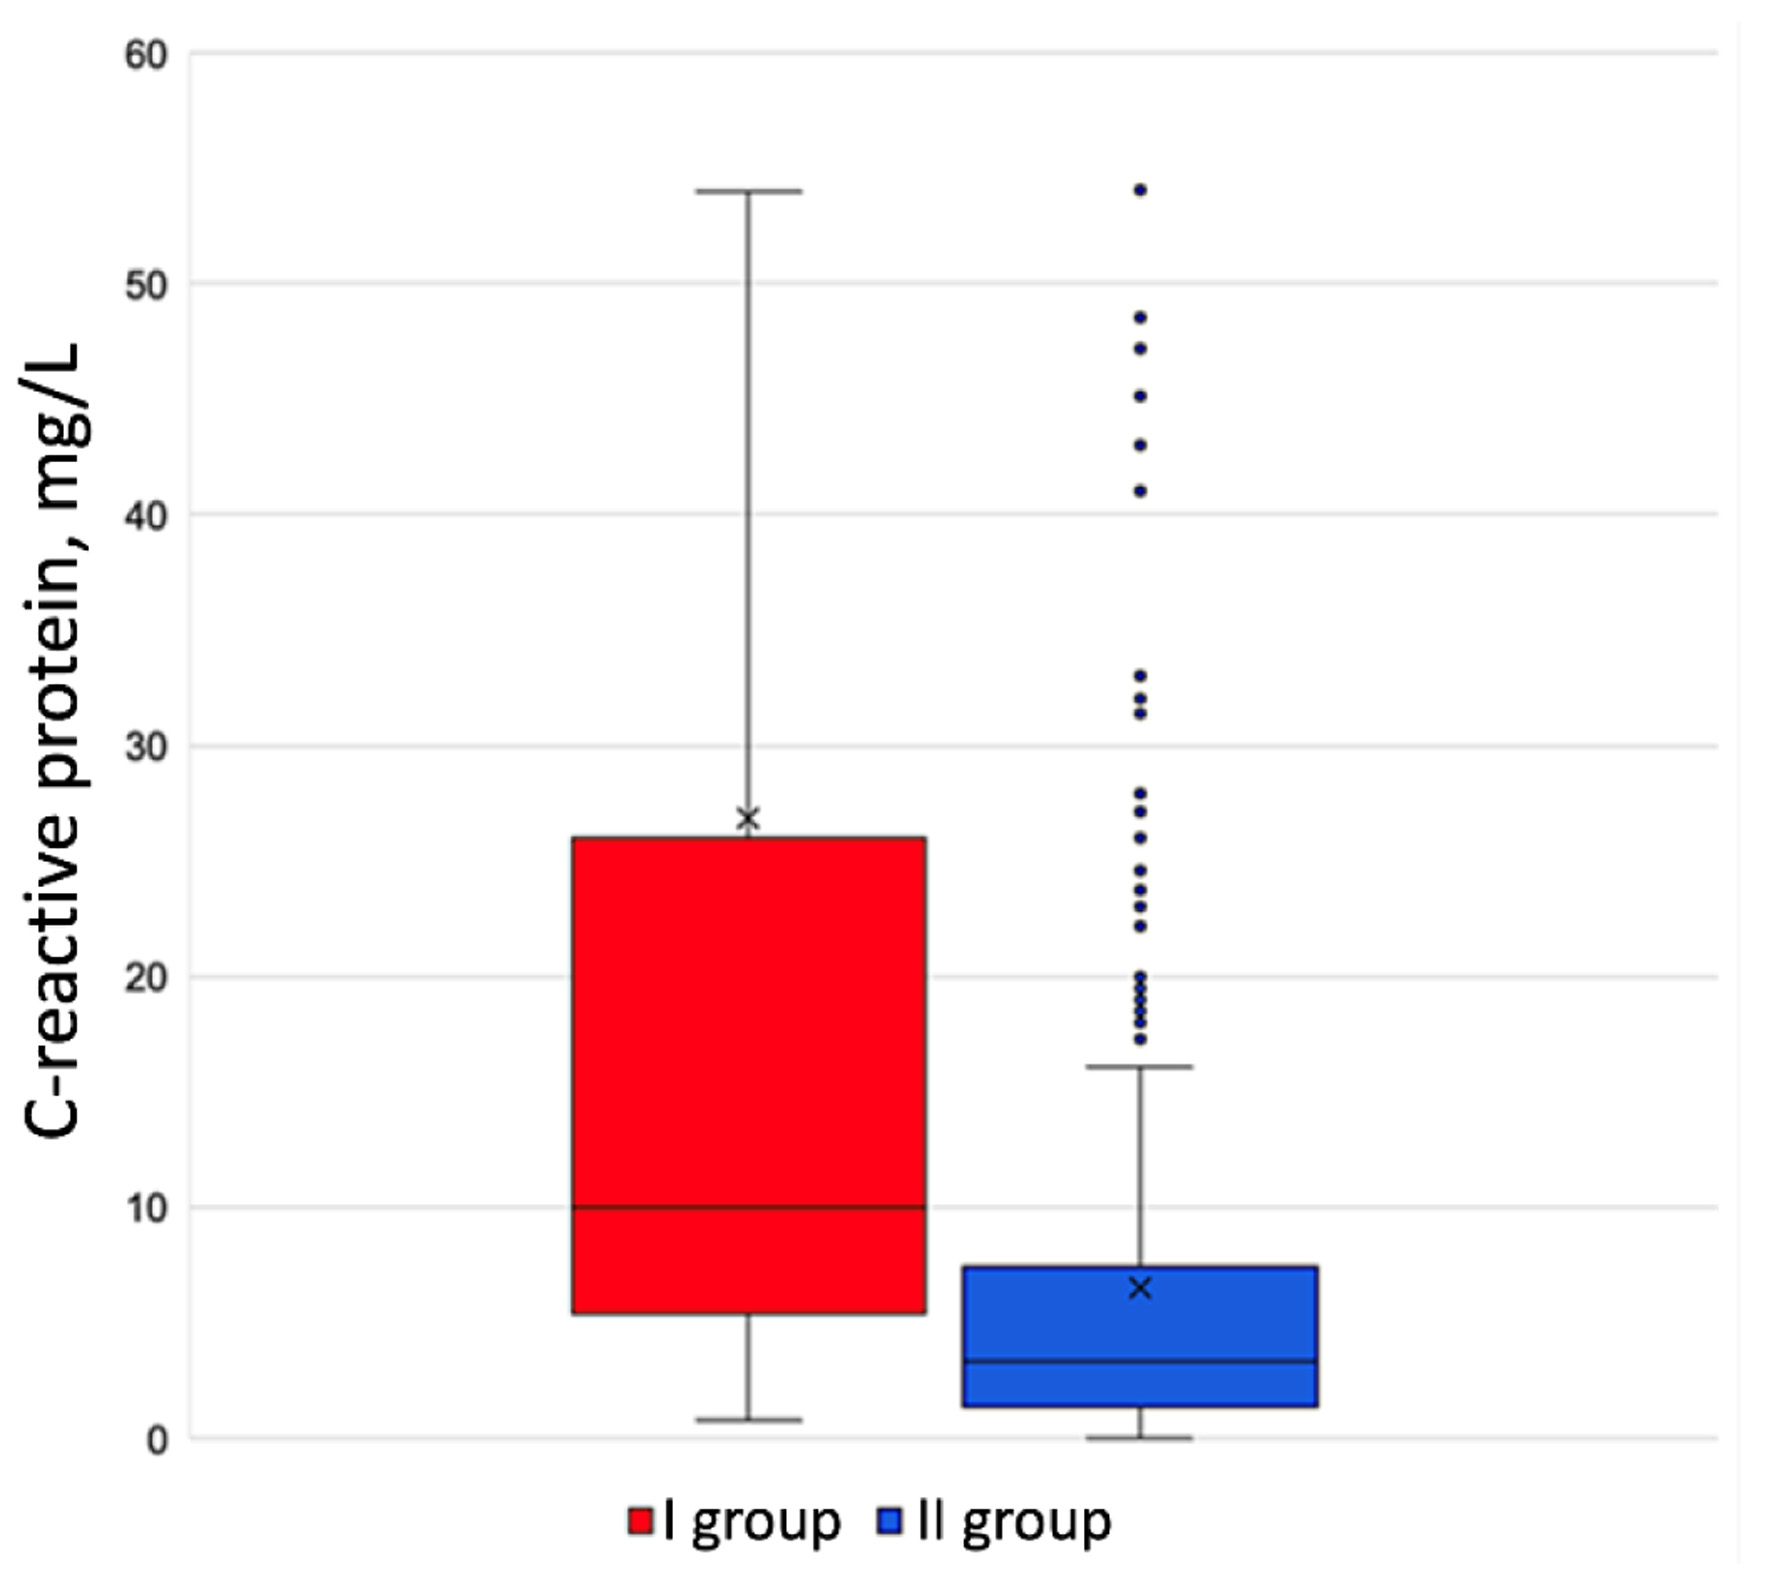
↓ Figure 1. C-reactive protein level in the
groups under review.
| Journal of Clinical Medicine Research, ISSN 1918-3003 print, 1918-3011 online, Open Access |
| Article copyright, the authors; Journal compilation copyright, J Clin Med Res and Elmer Press Inc |
| Journal website https://jocmr.elmerjournals.com |
Original Article
Volume 17, Number 9, October 2025, pages 529-535
Predictors of a Paroxysm of Atrial Fibrillation Developing in Patients With Exacerbated Chronic Obstructive Pulmonary Disease
Figures
Tables
| Clinical characteristics | Group I | Group II | P-value |
|---|---|---|---|
| COPD: chronic obstructive pulmonary disease; Me (Q1 - Q3): median and interquartile range. | |||
| Number of patients, n | 111 | 458 | - |
| Average age, years, Me (Q1 - Q3) | 69.0 (64.0 - 76.0) | 66.0 (58.0 - 72.0) | < 0.001 |
| Male, n (%) | 79 (71.2%) | 337 (73.6%) | 0.609 |
| COPD, bronchial obstruction degree, n (%) | |||
| Degree I | 0 (0.0%) | 26 (5.6%) | 0.012 |
| Degree II | 15 (13.5%) | 176 (38.4%) | < 0.001 |
| Degree III | 65 (58.6%) | 183 (40.0%) | < 0.001 |
| Degree IV | 31 (27.9%) | 73 (15.9%) | 0.003 |
| Arterial hypertension, n (%) | 111 (100%) | 389 (84.9%) | < 0.001 |
| Chronic coronary disease, n (%) | 32 (28.8%) | 46 (10.0%) | < 0.001 |
| Chronic heart failure, n (%) | 87 (78.3%) | 320 (69.9%) | < 0.001 |
| Chronic kidney disease, n (%) | 27(24.3%) | 98 (21.4%) | 0.156 |
| Type 2 diabetes mellitus, n (%) | 29 (26.1%) | 104 (22.7%) | 0.278 |
| Obesity, n (%) | 55 (49.5%) | 185 (40.3%) | 0.021 |
| Charlson Comorbidity Index, points | 5 (3 - 6) | 3 (2 - 5) | 0.004 |
| Forced expiratory volume in one second (FEV1), %, Me (Q1 - Q3) | 34.8% (23.7-57.6%) | 41.0% (27.5-65.4%) | 0.039 |
| Oxygen saturation (SpO2) on room air | 91.8% (89-95%) | 95.2% (91-97%) | 0.001 |
| Attribute | Group I | Group II | P-value |
|---|---|---|---|
| LA: left atrium; LVEDV: left ventricular end-diastolic volume; LVEF: left ventricular ejection fraction; LVESV: left ventricular end-systolic volume; LVMI: left ventricular mass index; RA: right atrium; RV: right ventricle; sPAP: systolic pulmonary artery pressure. | |||
| LVEF, % | 59.7% (56.7-61.3%) | 60.3% (58.2-62.9%) | 0.068 |
| LVEDV, mL | 112.7 (102; 122) | 110.2 (98; 121) | 0.480 |
| LVESV, mL | 43.6 (38 - 51) | 43.1 (34 - 47) | 0.149 |
| LVMI, g/m2 | 95.7 (87.2 - 119.1) | 87.9 (73.5 - 110.9) | 0.009 |
| LA, mL | 60.5 (54.7 - 71.2) | 54.6 (46.5 - 62.1) | 0.001 |
| RA area, cm2 | 20.9 (18.5 - 23.7) | 15.3 (13.9 - 18.8) | < 0.001 |
| RV, cm | 4.2 (3.7 - 4.4) | 3.6 (3.6 - 3.8) | 0.024 |
| sPAP, mm Hg | 45.8 (32 - 51) | 34.5 (29 - 44) | 0.011 |
| Attribute | Group I | Group II | P-value |
|---|---|---|---|
| ESR: erythrocyte sedimentation rate. | |||
| Hematocrit, % | 42.7% (37-46%) | 43.9% (39-46%) | 0.571 |
| Erythrocytes, × 1012/L | 4.6 (4.1 - 5.2) | 4.8 (4.4 - 5.2) | 0.085 |
| Hemoglobin, g/L | 140 (126 - 149) | 143 (130 - 154) | 0.128 |
| Leukocytes, × 109/L | 12.2 (6.7 - 12.9) | 11.3 (7.3 - 12.4) | 0.076 |
| Lymphocytes (%) | 19.7% (10.1-28.4%) | 22.7% (14.4-31.9%) | 0.051 |
| Monocytes (%) | 5.9% (4.4-8.4%) | 6.2% (4.8-8.2%) | 0.328 |
| Neutrophils (%) | 71.3% (61.7-81.2%) | 67.4% (53.7-78.4%) | 0.039 |
| Basophils (%) | 0.4% (0.2-0.7%) | 0.4% (0.2-0.8%) | 0.649 |
| Eosinophils (%) | 1.0% (0.2-2.2%) | 1.1% (0.3-2.6%) | 0.345 |
| Platelets, ×1012/L | 242 (185 - 301) | 256 (199 - 315) | 0.087 |
| ESR, mm/h | 28.4 (7.7 - 35.9) | 19.0 (4.2 - 23.1) | < 0.001 |
| Indicators | Univariate regression analysis | Multivariate regression analysis | ||||
|---|---|---|---|---|---|---|
| Unadjusted OR | 95% CI | P-value | Adjusted OR | 95% CI | P-value | |
| CI: confidence interval; COPD: chronic obstructive pulmonary disease; OR: odds ratio. | ||||||
| Arterial hypertension | 3.74 | 2.78 - 4.19 | 0.011 | 3.91 | 0.90 - 17.01 | 0.052 |
| Charlson Comorbidity Index above 4 points | 1.55 | 1.40 - 1.71 | < 0.001 | 1.61 | 1.27 - 2.05 | < 0.001 |
| Oxygen saturation (SpO2) falling below 92% | 1.96 | 1.86 - 2.13 | 0.025 | 2.58 | 0.97 - 6.87 | 0.067 |
| Right atrial area, cm2 | 1.39 | 1.22 - 1.57 | < 0.001 | 1.34 | 1.16 - 1.56 | < 0.001 |
| C-reactive protein, mg/L | 1.06 | 1.04 - 1.08 | < 0.001 | 1.14 | 1.04 - 1.24 | 0.004 |