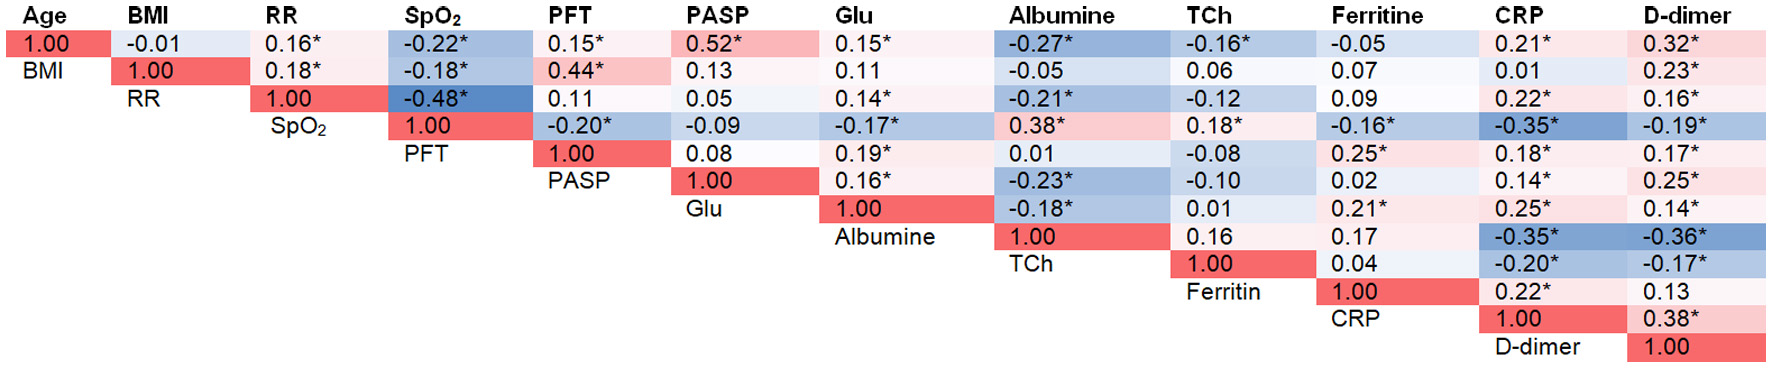
| Journal of Clinical Medicine Research, ISSN 1918-3003 print, 1918-3011 online, Open Access |
| Article copyright, the authors; Journal compilation copyright, J Clin Med Res and Elmer Press Inc |
| Journal website https://jocmr.elmerjournals.com |
Original Article
Volume 000, Number 000, October 2025, pages 000-000
Pericardial Fat Tissue as a Predictor of the Severity of Acute Coronavirus Infection COVID-19
Figures


Tables
| Severe COVID-19 (n = 133) | Moderate COVID-19 (n = 163) | Р | |
|---|---|---|---|
| *P < 0.05. AH: arterial hypertension; BMI: body mass index; COVID-19: coronavirus disease 2019; CRP: C-reactive protein; DBP: diastolic blood pressure; EF: ejection fraction; PASP: pulmonary artery systolic pressure; PFT: pericardial fat tissue; RR: respiration rate; SBP: systolic blood pressure; SpO2: oxygen saturation; T2DM: type 2 diabetes mellitus. | |||
| Age, years | 63.75 ± 12.94 | 58.88 ± 14.55 | 0.003* |
| Sex, male/female, n (%) | 67 (50.38)/66 (49.62) | 74 (45.40)/89 (54.60) | 0.394 |
| Weight, kg | 86.00 (75.00 - 100.00) | 80.50 (73.00 - 90.00) | 0.007* |
| BMI, kg/m2 | 30.76 (26.28 - 34.26) | 28.17 (25.40 - 31.62) | 0.006* |
| Obesity, n (%) | 60 (45.11) | 57 (34.97) | 0.083 |
| AH, n (%) | 70 (52.63) | 65 (39.88) | < 0.001* |
| T2DM, n (%) | 24 (18.05) | 18 (11.04) | 0.035 |
| Smoking, n (%) | 13 (9.77) | 18 (11.04) | 0.663 |
| RR, breaths/min | 24.00 (22.00 - 24.00) | 22.00 (21.00 - 22.00) | < 0.001* |
| Heart rate, /min | 89.00 (80.00 - 90.00) | 82.50 (75.00 - 92.00) | 0.021* |
| SBP, mm Hg | 120.00 (120.00 - 130.00) | 120.00 (120.00 - 130.00) | 0.799 |
| DBP, mm Hg | 80.00 (74.00 - 80.00) | 80.00 (70.00 - 80.00) | 0.342 |
| SpO2, % | 92.00 (90.00 - 92.00) | 96.00 (95.00 - 97.00) | < 0.001* |
| PFT, сm3 | 3.30 (2.40 - 4.10) | 2.75 (2.00 - 3.60) | 0.003* |
| EF, % | 61.00 (59.00 - 63.00) | 62.00 (61.00 - 63.00) | 0.026* |
| PASP, mm Hg | 26.00 (22.00 - 32.00) | 26.00 (22.00 - 29.00) | 0.352 |
| CRP | 62.20 (19.80 - 125.51) | 21.40 (7.91 - 68.00) | < 0.001* |
| Ferritin, ng/mL | 443.05 (262.20 - 648.00) | 322.50 (156.00 - 521.00) | 0.008* |
| Albumin, g/L | 37.10 (34.50 - 40.00) | 40.80 (38.70 - 44.00) | < 0.001* |
| Creatinine, µmol/L | 92.33 (79.00 - 114.89) | 89.33 (78.50 - 101.20) | 0.089 |
| Total cholesterol, mmol/L | 4.36 (3.61 - 5.21) | 4.87 (4.08 - 5.69) | 0.004* |
| Glucose, mmol/L | 6.30 (5.50 - 8.08) | 6.06 (5.37 - 6.70) | 0.046* |
| D-dimer, mg/mL | 0.92 (0.42 - 3.31) | 0.58 (0.32 - 1.37) | 0.008* |
| Attribute | Model 1 | Model 2 | Model 3 | Model 4 |
|---|---|---|---|---|
| *P < 0.05. Model 1: unadjusted (PFT volume only). Model 2: adjusted for age. Model 3: adjusted for age, hypertension history, blood glucose, and total cholesterol. Model 4: fully adjusted for age, hypertension history, blood glucose, total cholesterol, albumin, CRP, D-dimer, and ferritin. COVID-19: coronavirus disease 2019; CRP: C-reactive protein; PFT: pericardial fat tissue. | ||||
| Pericardial fat tissue volume | 1.27 (1.08 - 1.50)* | 1.24 (1.05 - 1.47)* | 1.34 (1.01 - 1.76)* | 2.68 (1.06 - 6.73)* |
| Age | - | 1.02 (1.01 - 1.04)* | 1.02 (0.99 - 1.05) | 1.02 (0.93 - 1.12) |
| Arterial hypertension | - | - | 2.38 (0.73 - 7.76) | 0.13 (0.01 - 3.32) |
| Glucose | - | - | 1.00 (0.91 - 1.09) | 1.03 (0.77 - 1.39) |
| Total cholesterol | - | - | 0.66 (0.49 - 0.90)* | 1.12 (0.48 - 2.64) |
| Albumine | - | - | - | 0.97 (0.80 - 1.18) |
| CRP | - | - | - | 1.01 (0.99 - 1.03) |
| D-dimer | - | - | - | 0.93 (0.77 - 1.12) |
| Ferritine | - | - | - | 0.99 (0.99 - 1.00) |