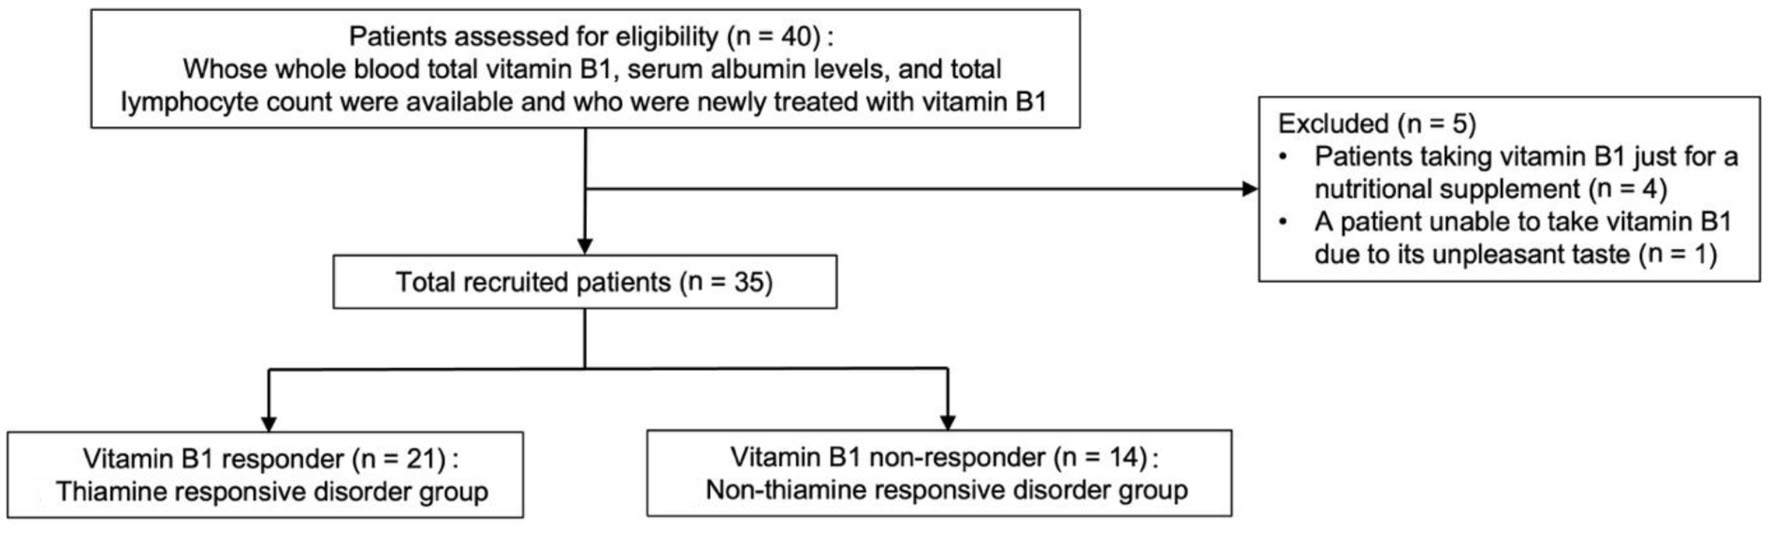
↓ Figure 1. Flowchart depicting study participant
enrollment.
| Journal of Clinical Medicine Research, ISSN 1918-3003 print, 1918-3011 online, Open Access |
| Article copyright, the authors; Journal compilation copyright, J Clin Med Res and Elmer Press Inc |
| Journal website https://jocmr.elmerjournals.com |
Original Article
Volume 17, Number 9, October 2025, pages 490-498
Association of Sex Difference With Thiamine Responsive Disorders in Internal Medicine: A Pilot Case-Control Study
Figure
Tables
| Reference interval at our hospital | TRD group (n = 21) | Non-TRD group (n = 14) | P-value | Missing (%) | |
|---|---|---|---|---|---|
| Significance: *P < 0.05; †P < 0.1. Data are presented as the number (percentage) using Pearson’s Chi-square test or Fisher’s exact test (two-sided), and median (interquartile range) using Wilcoxon rank-sum test as appropriate. Alb: albumin; ALT: alanine aminotransferase; AST: asparate aminotransferase; BMI: body mass index; BUN: blood urea nitrogen; CONUT: Controlling Nutritional Status; Cre: creatinine; eGFR: estimated glomerular filtration rate; F: female; γGT: gamma-glutamyl transpeptidase; Hb: hemoglobin; M: male; MCV: mean corpuscular volume; Plt: platelet count; PNI: Prognostic Nutritional Index; RBC: red blood cell count; TRD: thiamine responsive disorder; WBC: white blood cell count. | |||||
| Sex (n, %) | 0.023* | 0 | |||
| Male | 10 (47.6) | 1 (7.1) | |||
| Female | 11 (52.4) | 13 (92.9) | |||
| Age (years) | 52 (33.5 - 70.5) | 43 (24.8 - 76.3) | 0.960 | 0 | |
| BMI (kg/m2) | 19.8 (17.8 - 22.2) | 21.9 (17.3 - 24.8) | 51.4 | ||
| Diet (n, %) | 45.7 | ||||
| Normal amount | 7 (50) | 3 (60) | |||
| Unbalanced or small amount | 7 (50) | 2 (40) | |||
| Alcohol consumption (n, %) | 48.6 | ||||
| Never | 6 (37.5) | 2 (100) | |||
| Monthly or less | 1 (6.3) | 0 (0) | |||
| 2 - 4 times a month | 1 (6.3) | 0 (0) | |||
| 2 - 3 times a week | 0 (0) | 0 (0) | |||
| 4 or more times a week | 8 (50) | 0 (0) | |||
| Specific comorbidity | 2.9 | ||||
| Gastrointestinal tract diseases (including surgery) (n, %) | 3 (14.3) | 0 (0) | 0.251 | ||
| Specific medication | 0 | ||||
| Diuretics (n, %) | 2 (9.5) | 0 (0) | 0.506 | ||
| Whole blood total vitamin B1 concentration (nmol/L) | 80 - 219 | 93.1 (74.8 - 106.4) | 88.1 (82.3 - 111.4) | 0.589 | 0 |
| WBC (/µL) | 3,300 - 8,600 | 5,300 (4,100 - 6,300) | 6,400 (4,950 - 8,050) | 0.035* | 0 |
| Neutrophils (%) | 43.0 - 79.0 | 60.2 (55.3 - 69.6) | 65.3 (55.8 - 74.4) | 0.429 | |
| Lymphocytes (%) | 15.0 - 47.0 | 28.7 (22.4 - 32.9) | 27.1 (18.9 - 36.4) | 0.840 | |
| Monocytes (%) | 3.0 - 10.0 | 6.1 (4.9 - 8) | 4.7 (3.7 - 5.8) | 0.008* | |
| Eosinophils (%) | 1.0 - 5.0 | 1.6 (0.6 - 3.7) | 1.3 (0.5 - 2.9) | 0.489 | |
| Basophils (%) | 0.0 - 1.0 | 0.5 (0.4 - 0.7) | 0.5 (0.3 - 0.6) | 0.721 | |
| RBC (×104/µL) | 435 - 555 (M), 386 - 492 (F) | 434 (381.5 - 468) | 462 (427 - 480.3) | 0.089† | 0 |
| Hb (g/dL) | 13.7 - 16.8 (M), 11.6 - 14.8 (F) | 13 (11.4 - 14.5) | 13.4 (11.8 - 14.2) | 0.973 | 0 |
| MCV (fL) | 83.6 - 98.2 | 92.6 (88.0 - 97.8) | 88.7 (85.7 - 91.1) | 0.031* | 0 |
| Plt (×103/µL) | 158 - 348 | 263 (190.5 - 301) | 253.5 (214.3 - 338.8) | 0.480 | 0 |
| AST (U/L) | 13 - 30 | 19 (16.5 - 60.5) | 16 (14.5 - 23) | 0.028* | 0 |
| ALT (U/L) | 10 - 42 (M), 7 - 23 (F) | 15 (12 - 26) | 12 (8.5 - 15.8) | 0.098† | 0 |
| γGT (U/L) | 13 - 64 (M), 9 - 32 (F) | 17 (11.5 - 153.8) | 16.5 (11.3 - 27.8) | 0.533 | 8.6 |
| Alb (g/dL) | 4.1 - 5.1 | 4.1 (3.7 - 4.5) | 4.2 (3.9 - 4.7) | 0.417 | 0 |
| BUN (mg/dL) | 8 - 20 | 11 (8 - 15) | 10 (7.5 - 16) | 0.893 | 8.6 |
| Cre (mg/dL) | 0.65 - 1.07 (M), 0.46 - 0.79 (F) | 0.7 (0.6 - 0.9) | 0.7 (0.6 - 0.7) | 0.711 | 0 |
| eGFR (mL/min/1.73 m2) | 60.0- | 85.4 (60.7 - 107.5) | 77.6 (69.7 - 98.0) | 0.637 | 2.9 |
| PNI | 41- | 47.0 (42.7 - 52.9) | 52.0 (48.4 - 54.0) | 0.077† | 0 |
| Modified CONUT score (n, %) | 0 | ||||
| Normal (0 - 1) | 11 (52.4) | 11 (78.6) | 0.162 | ||
| Low risk (2 - 4) | 9 (42.9) | 3 (21.4) | 0.282 | ||
| Medium risk (5 - 8) | 1 (4.8) | 0 (0) | 1.000 | ||
| High risk (9 - 12) | 0 (0) | 0 (0) | |||
| TRD group (n = 21) | Non-TRD group (n = 14) | P-value | |||
|---|---|---|---|---|---|
| Male | Female | Male | Female | ||
| Data are presented as the number (percentage) using Pearson’s Chi-square test or Fisher’s exact test (two-sided). Significance: *P < 0.1. OD: orthostatic dysregulation; TRD: thiamine responsive disorder. | |||||
| Malaise and unidentified complaint (n, %) | 3 (30) | 7 (70) | 0 (0) | 5 (100) | 0.728 |
| Early satiety, loss of appetite, nausea and dyspepsia (n, %) | 4 (66.7) | 2 (33.3) | 0 (0) | 5 (100) | 0.721 |
| OD (lightheadedness and syncope) (n, %) | 1 (16.7) | 5 (83.3) | 1 (33.3) | 2 (66.7) | 0.712 |
| Double and blurred vision (n, %) | 2 (66.7) | 1 (33.3) | 0 (0) | 0 (0) | 0.259 |
| Leg weakness (n, %) | 3 (100) | 0 (0) | 0 (0) | 0 (0) | 0.259 |
| Leg edema (n, %) | 2 (100) | 0 (0) | 0 (0) | 1 (100) | 1.000 |
| Forgetfulness (n, %) | 1 (50) | 1 (50) | 0 (0) | 1 (100) | 1.000 |
| Fatigability, palpitation, diaphoresis and shortness of breath on exertion (n, %) | 0 (0) | 0 (0) | 0 (0) | 3 (100) | 0.056* |
| Palpitation (n, %) | 0 (0) | 2 (100) | 0 (0) | 0 (0) | 0.506 |
| Whole body pain (n, %) | 0 (0) | 0 (0) | 0 (0) | 2 (100) | 0.153 |
| Abdominal pain (n, %) | 0 (0) | 0 (0) | 0 (0) | 1 (100) | 0.400 |
| Feverish (n, %) | 0 (0) | 1 (100) | 0 (0) | 0 (0) | 1.000 |
| Vertigo (n, %) | 1 (100) | 0 (0) | 0 (0) | 0 (0) | 1.000 |
| Dizziness (n, %) | 0 (0) | 0 (0) | 0 (0) | 1 (100) | 0.400 |
| Ear fullness (n, %) | 1 (100) | 0 (0) | 0 (0) | 0 (0) | 1.000 |
| Irritability (n, %) | 0 (0) | 1 (100) | 0 (0) | 0 (0) | 1.000 |
| Variable | Univariate logistic regression analysis | Multivariate logistic regression analysis (forced entry method) | ||
|---|---|---|---|---|
| OR (95% CI) | P-value | Adjusted OR (95% CI) | P-value | |
| Significance: *P < 0.05; †P < 0.1. An odds ratio (confidence interval) and a P-value were calculated based on likelihood ratio. ALT: alanine aminotransferase; AST: asparate aminotransferase; CI: confidence interval; CONUT: Controlling Nutritional Status; γGT: gamma-glutamyl transpeptidase; MCV: mean corpuscular volume; OR: odds ratio; PNI: Prognostic Nutritional Index. | ||||
| Sex | ||||
| Male | 1.00 (reference) | 1.00 (reference) | ||
| Female | 0.08 (0.0043 - 0.55) | 0.007* | 0.03 (0.0009 - 0.32) | 0.002* |
| Age (1-year increments) | 1.00 (0.97 - 1.03) | 0.955 | 0.96 (0.91 - 1.00) | 0.066† |
| AST, ALT, γGT, and MCV | ||||
| All normal | 1.00 (reference) | 1.00 (reference) | ||
| Any abnormal | 2.26 (0.51 - 12.27) | 0.291 | 0.80 (0.08 - 6.54) | 0.829 |
| PNI and modified CONUT score | ||||
| All normal | 1.00 (reference) | 1.00 (reference) | ||
| Any abnormal | 3.33 (0.77 - 18.0) | 0.109 | 5.75 (0.87 - 65.6) | 0.070† |