Figures
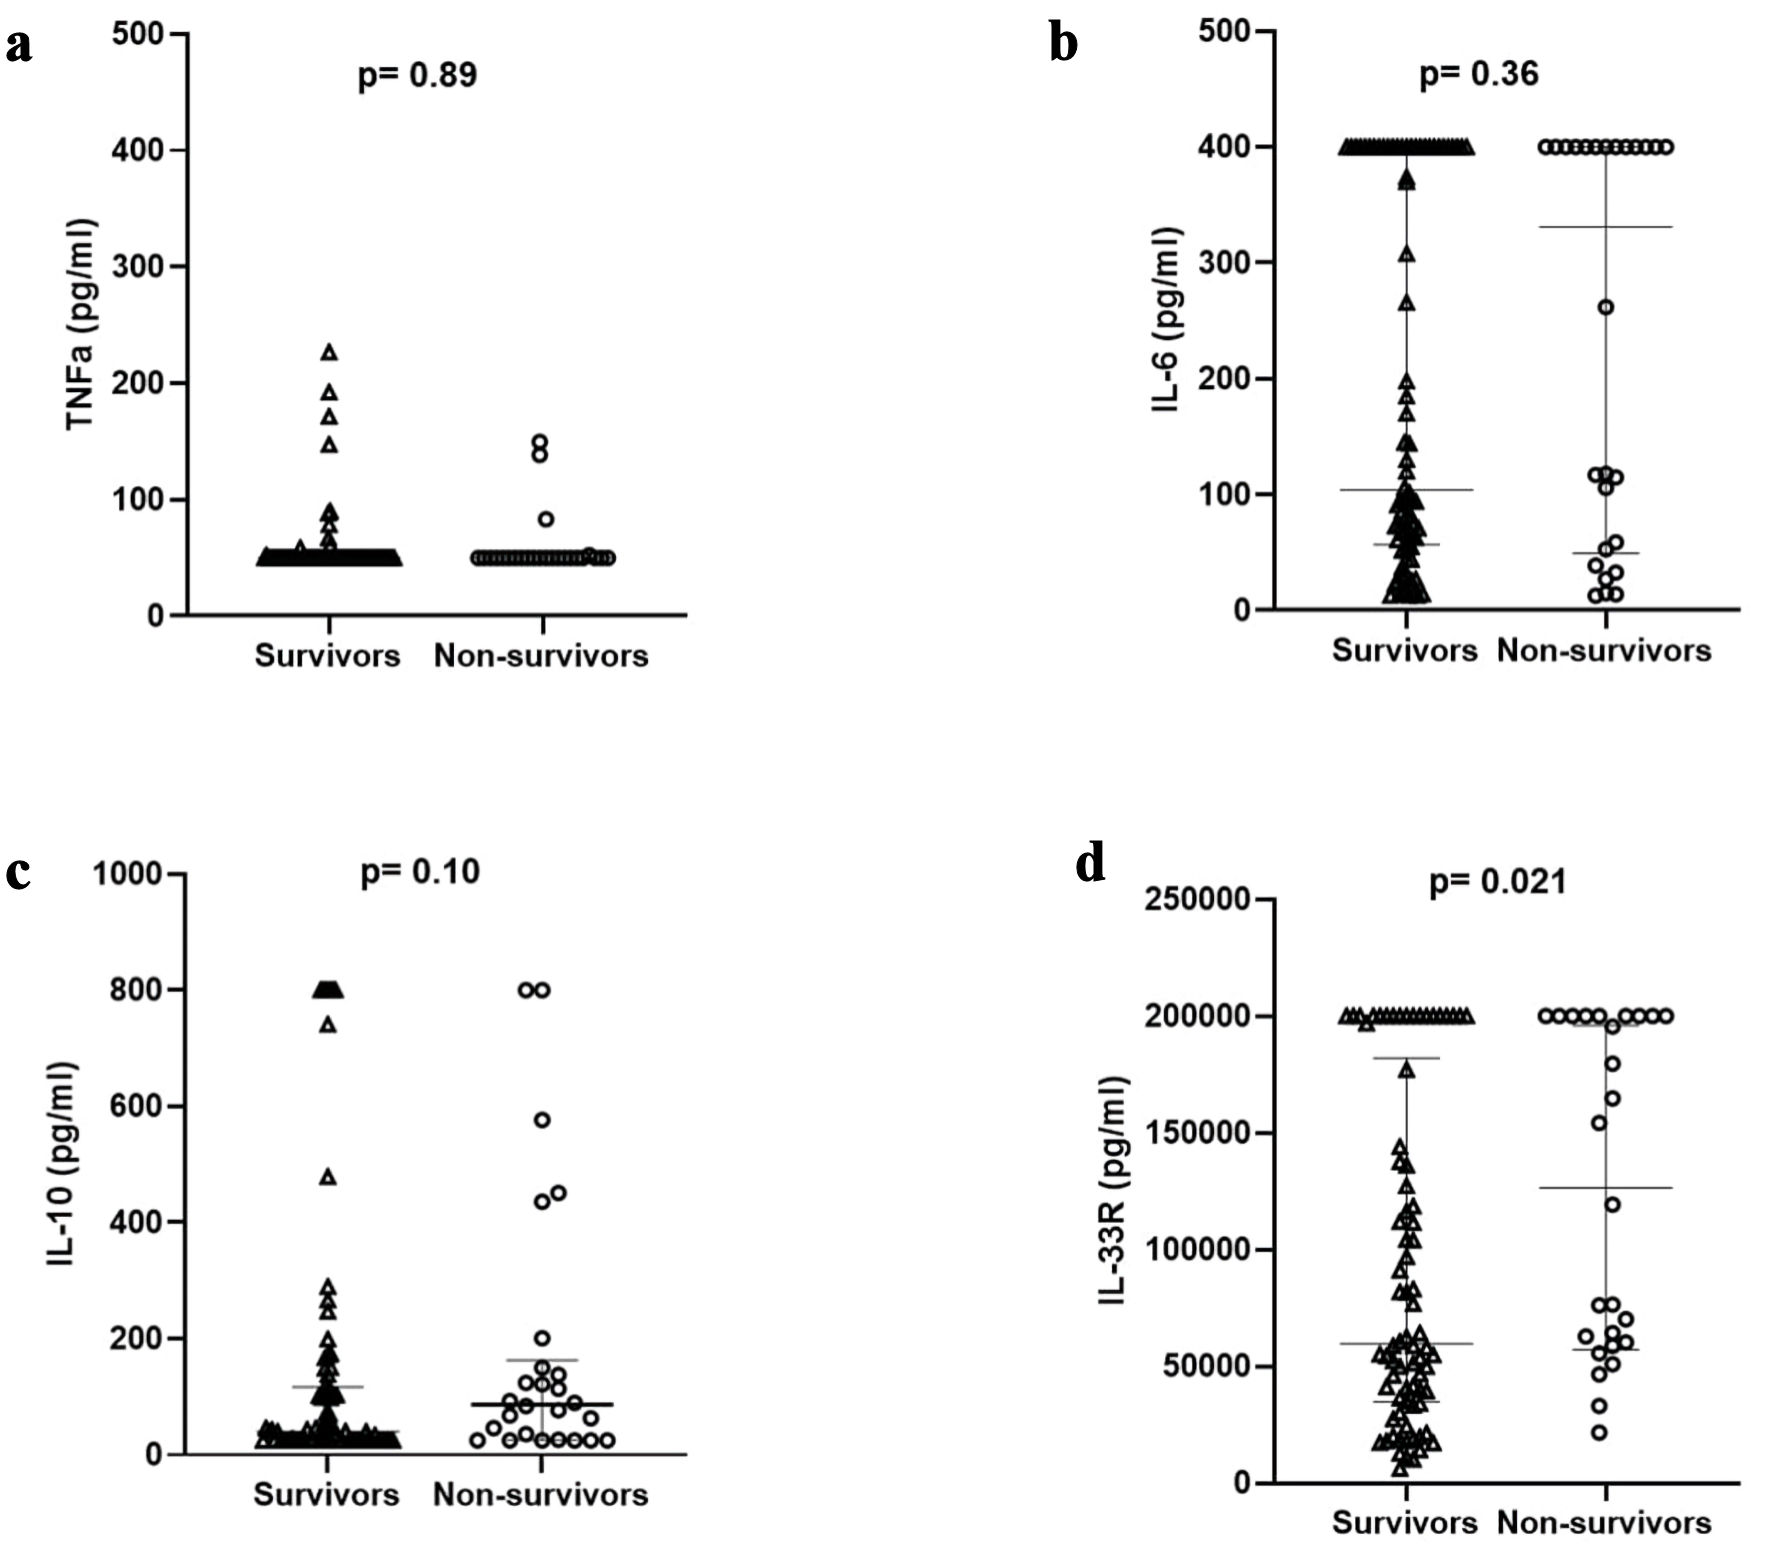
↓ Figure 1. Cytokine differences regarding
outcome in study population. TNF: tumor necrosis factor; IL: interleukin; IL-33R: interleukin-33
receptor.
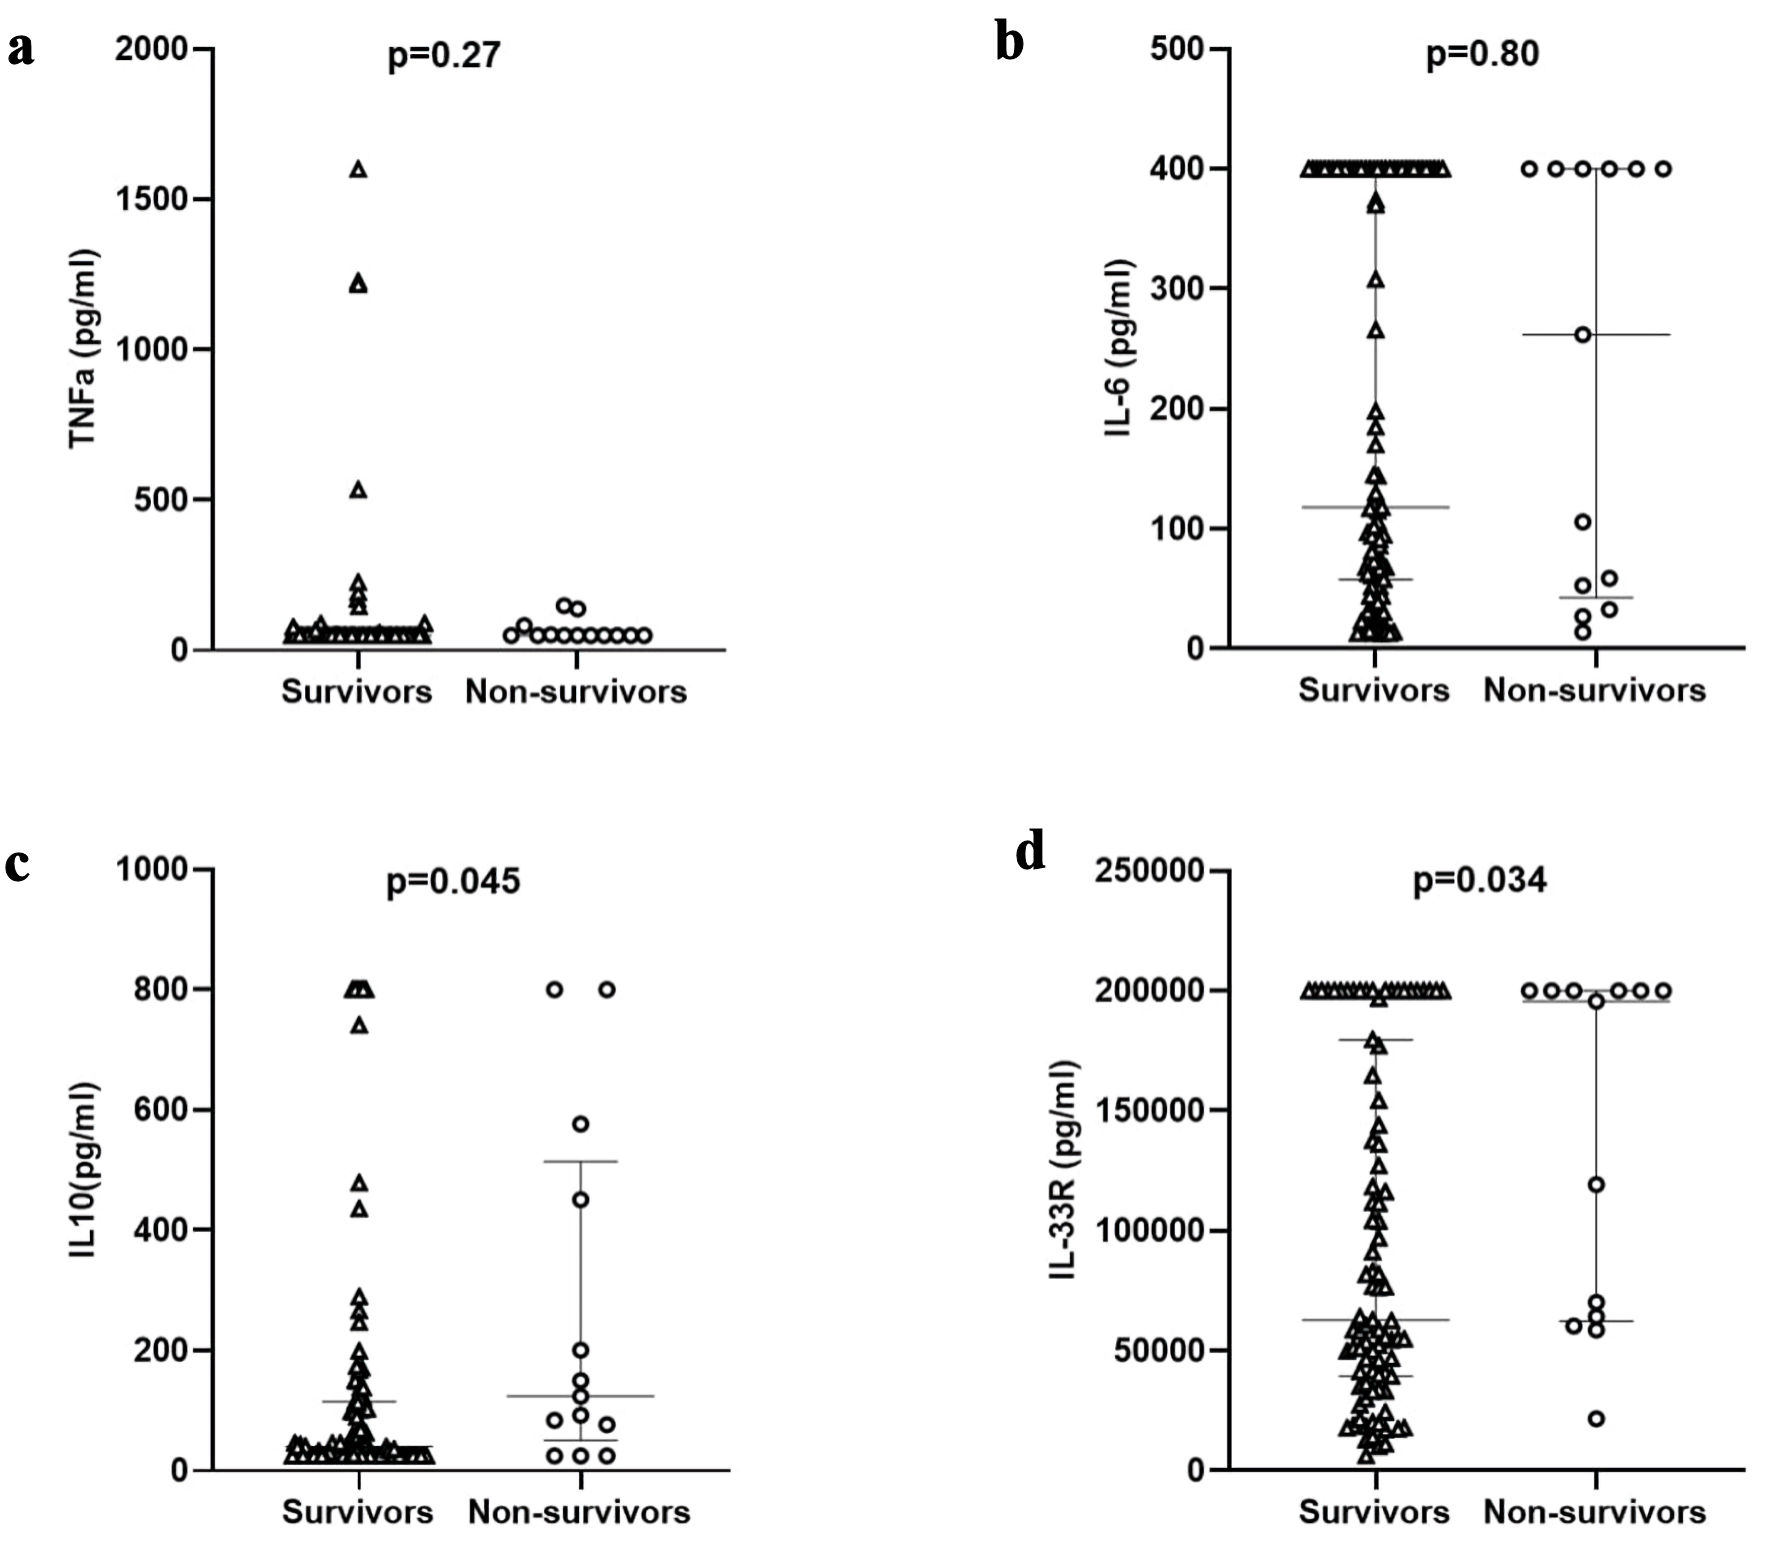
↓ Figure 2. Cytokine differences regarding early
outcome (in 72 h) in study population. TNF: tumor necrosis factor; IL: interleukin; IL-33R:
interleukin-33 receptor.
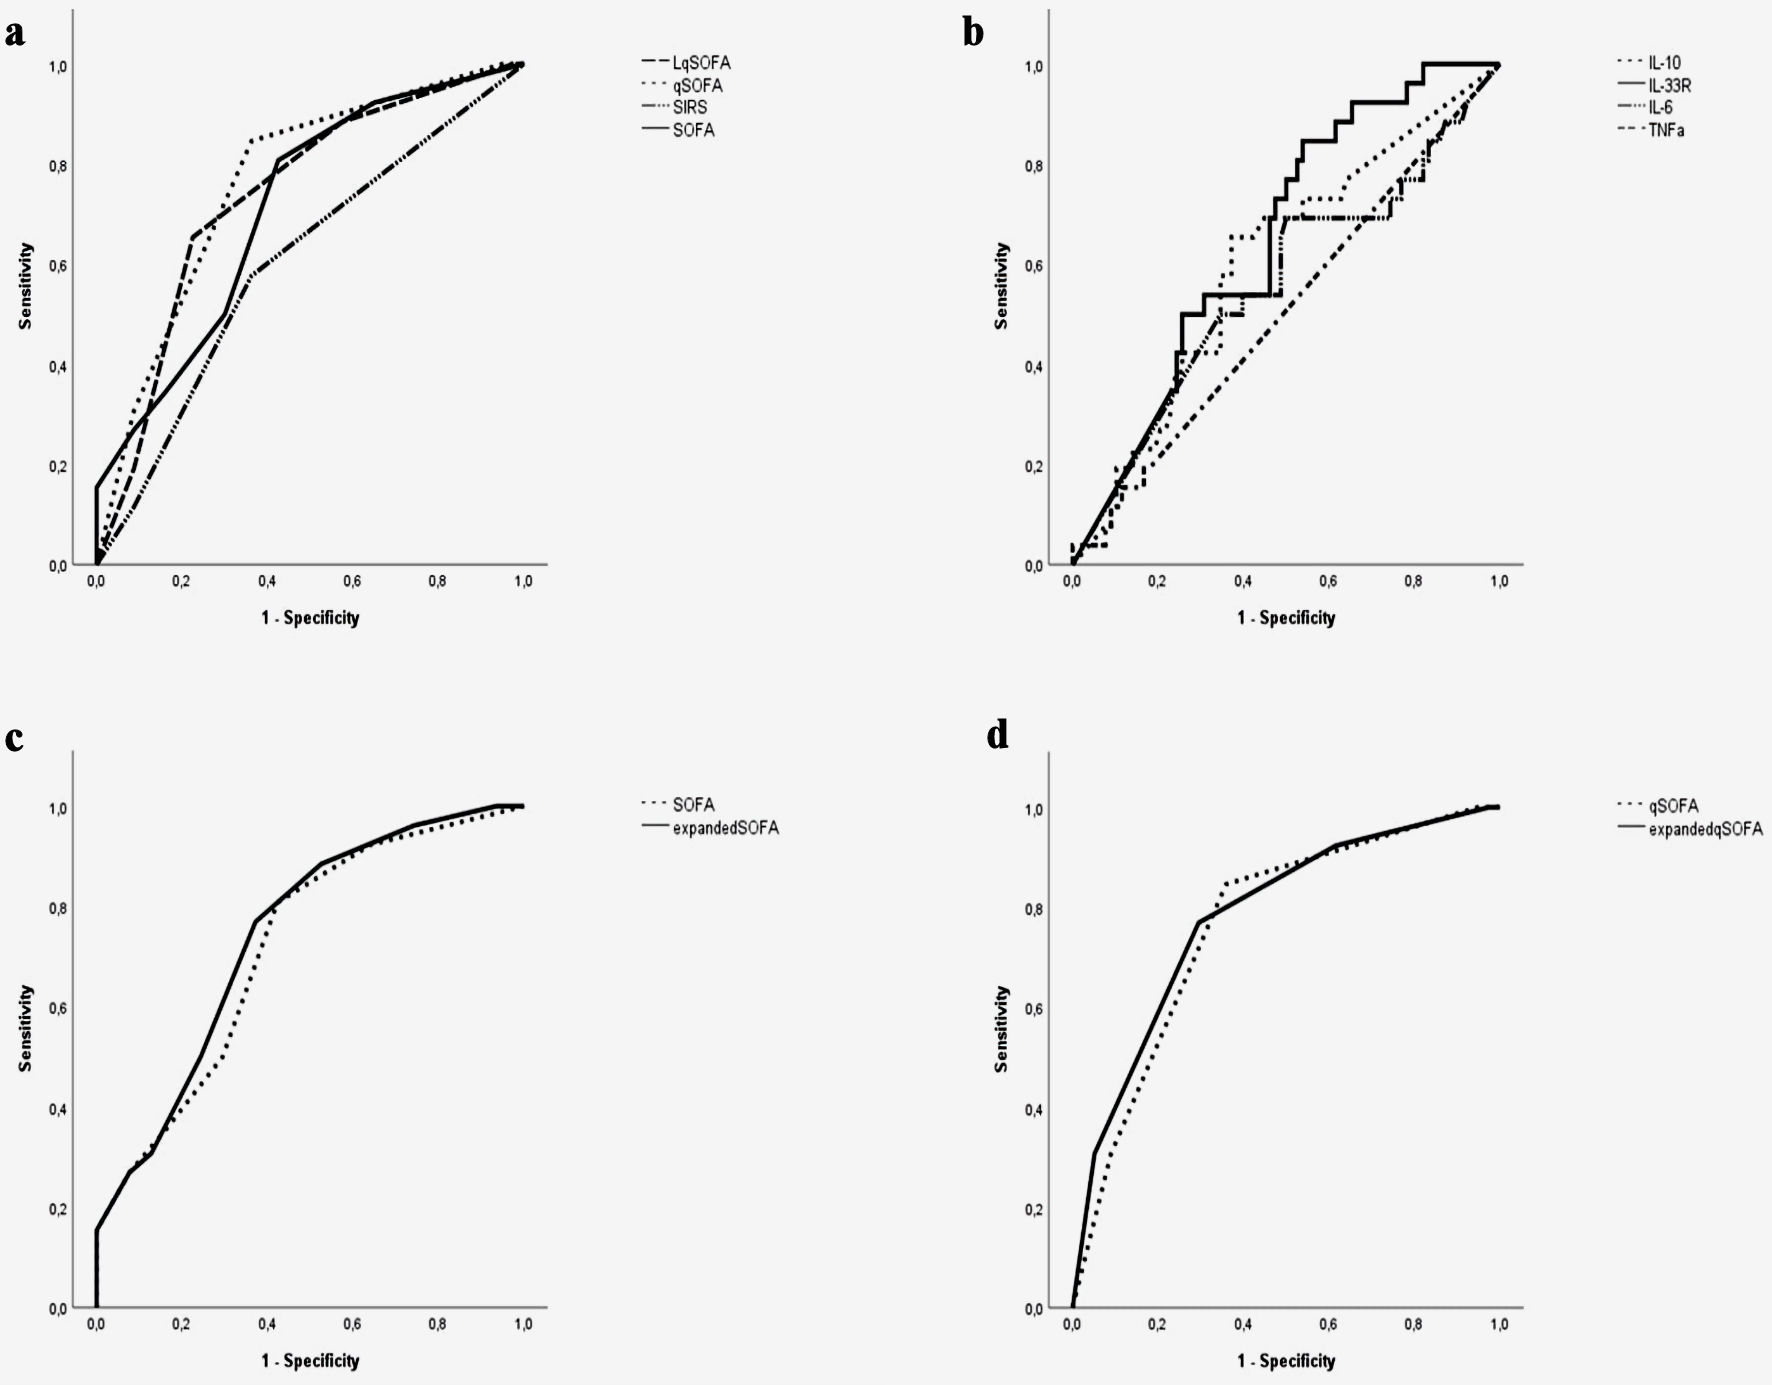
↓ Figure 3. The area under the receiver operating
characteristic (ROC) curve of SIRS, SOFA, qSOFA, and LqSOFA (a), IL-6, IL-10, TNF-α, IL-33R (b),
expanded SOFA-IL-33R (SOFA combined with cutoff value of IL-33R) and expanded qSOFA-IL-33R (qSOFA
combined with cutoff value of IL-33R) scores (c, d), respectively, in predicting in-hospital mortality
of sepsis patients. LqSOFA: lactate quick SOFA; qSOFA: quick SOFA; SIRS: systemic inflammatory response
syndrome; SOFA: Sequential Organ Failure Assessment; TNF: tumor necrosis factor; IL: interleukin;
IL-33R: interleukin-33 receptor.
↓ Figure 4. The area under the receiver operating
characteristic (ROC) curve of expanded SOFA-IL-33R (SOFA combined with cutoff value of IL-33R) (a),
expanded qSOFA-IL-33R (qSOFA combined with cutoff value of IL-33R) (b), expanded SOFA-IL-10 (SOFA
combined with cutoff value of IL-10) (c) and expanded qSOFA-IL10 (qSOFA combined with cutoff value of
IL-10) (d) in predicting early (within 72 h) in-hospital mortality of sepsis patients. qSOFA: quick
SOFA; SOFA: Sequential Organ Failure Assessment; IL-33R: interleukin-33 receptor.

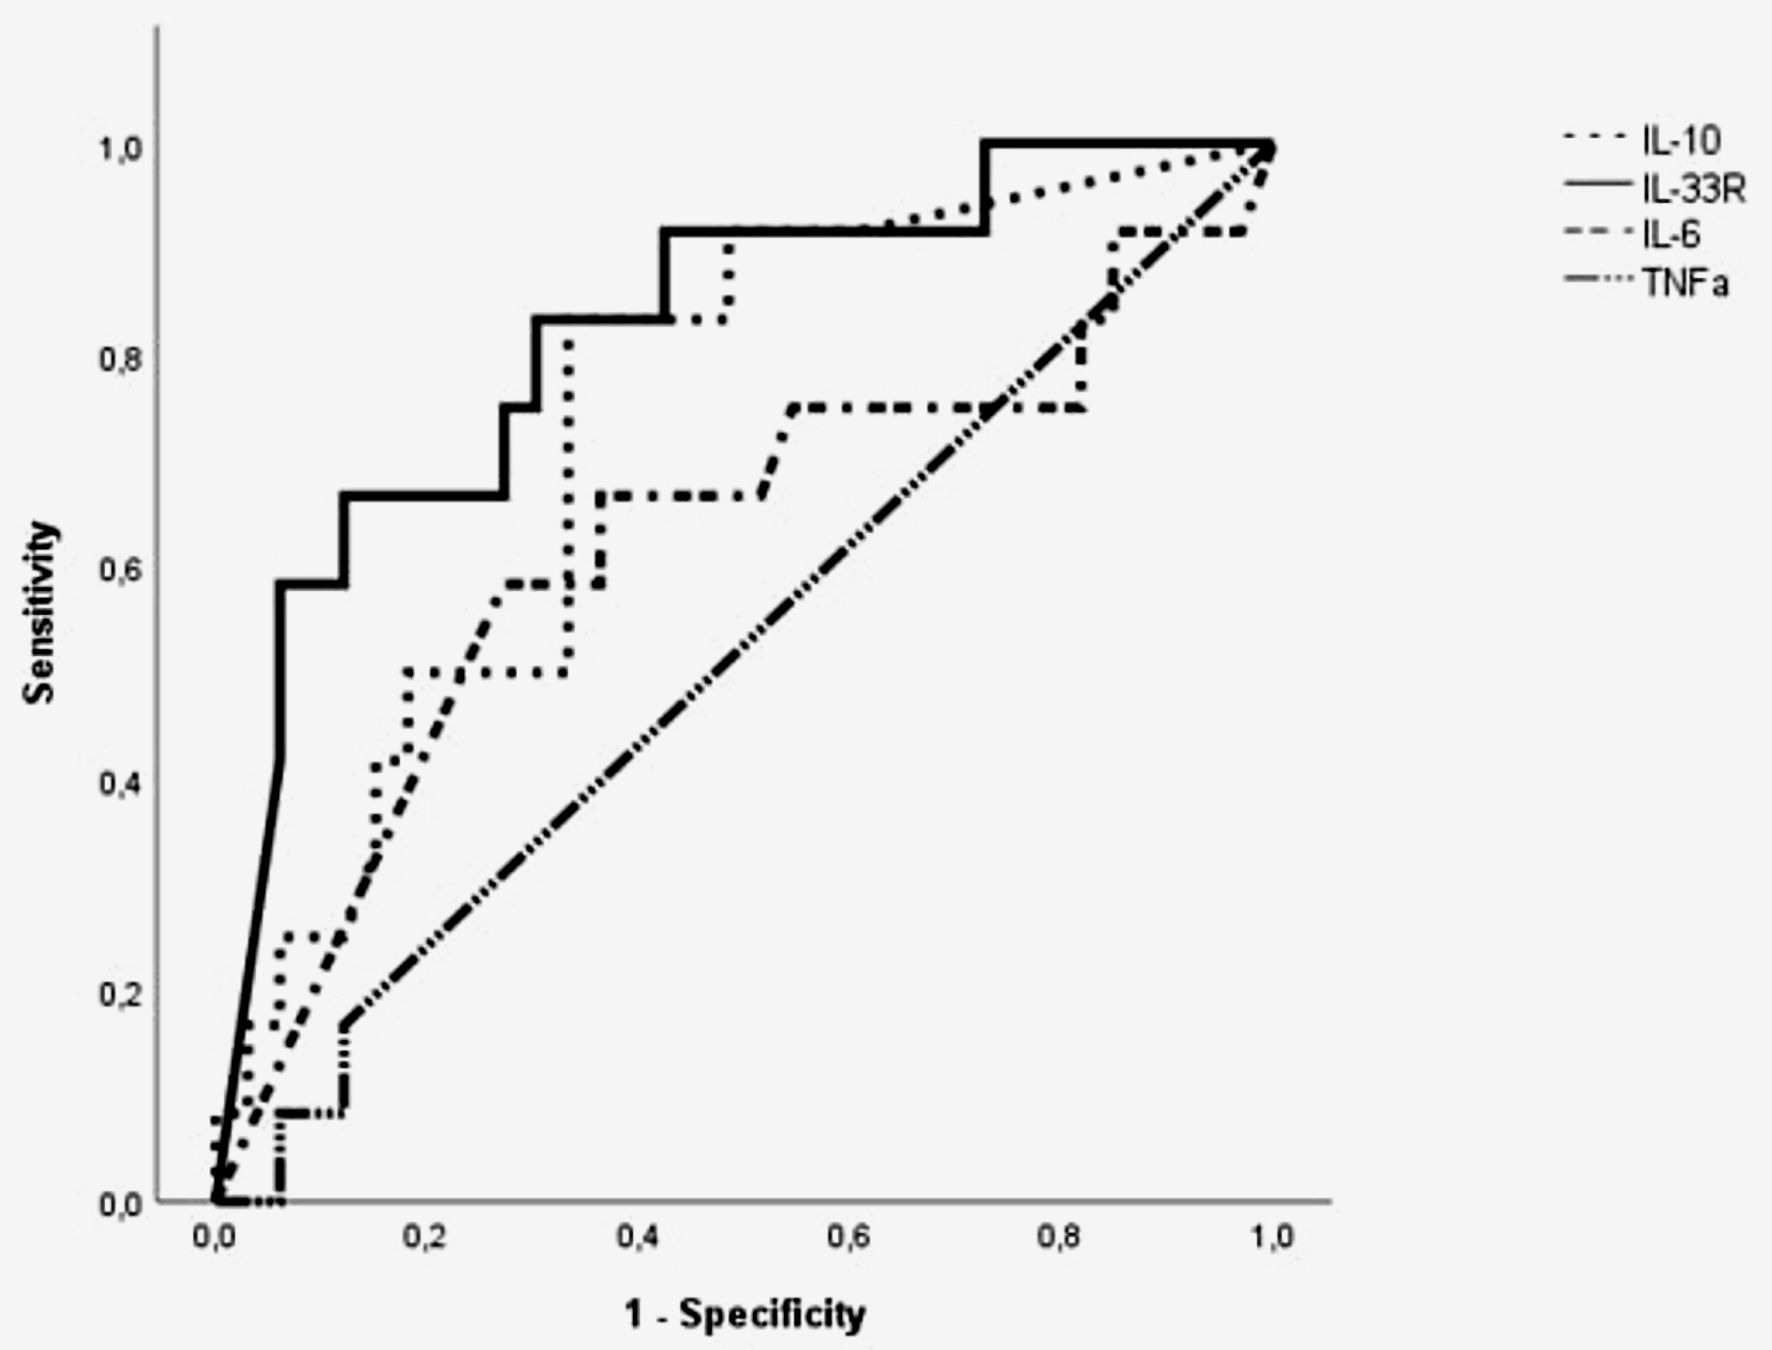
↓ Figure 5. The area under the receiver operating
characteristic (ROC) curve of IL-6, IL-10, TNF-α, IL-33R in predicting in-hospital mortality of
sepsis patients with lower respiratory tract infections. TNF: tumor necrosis factor; IL: interleukin;
IL-33R: interleukin-33 receptor.
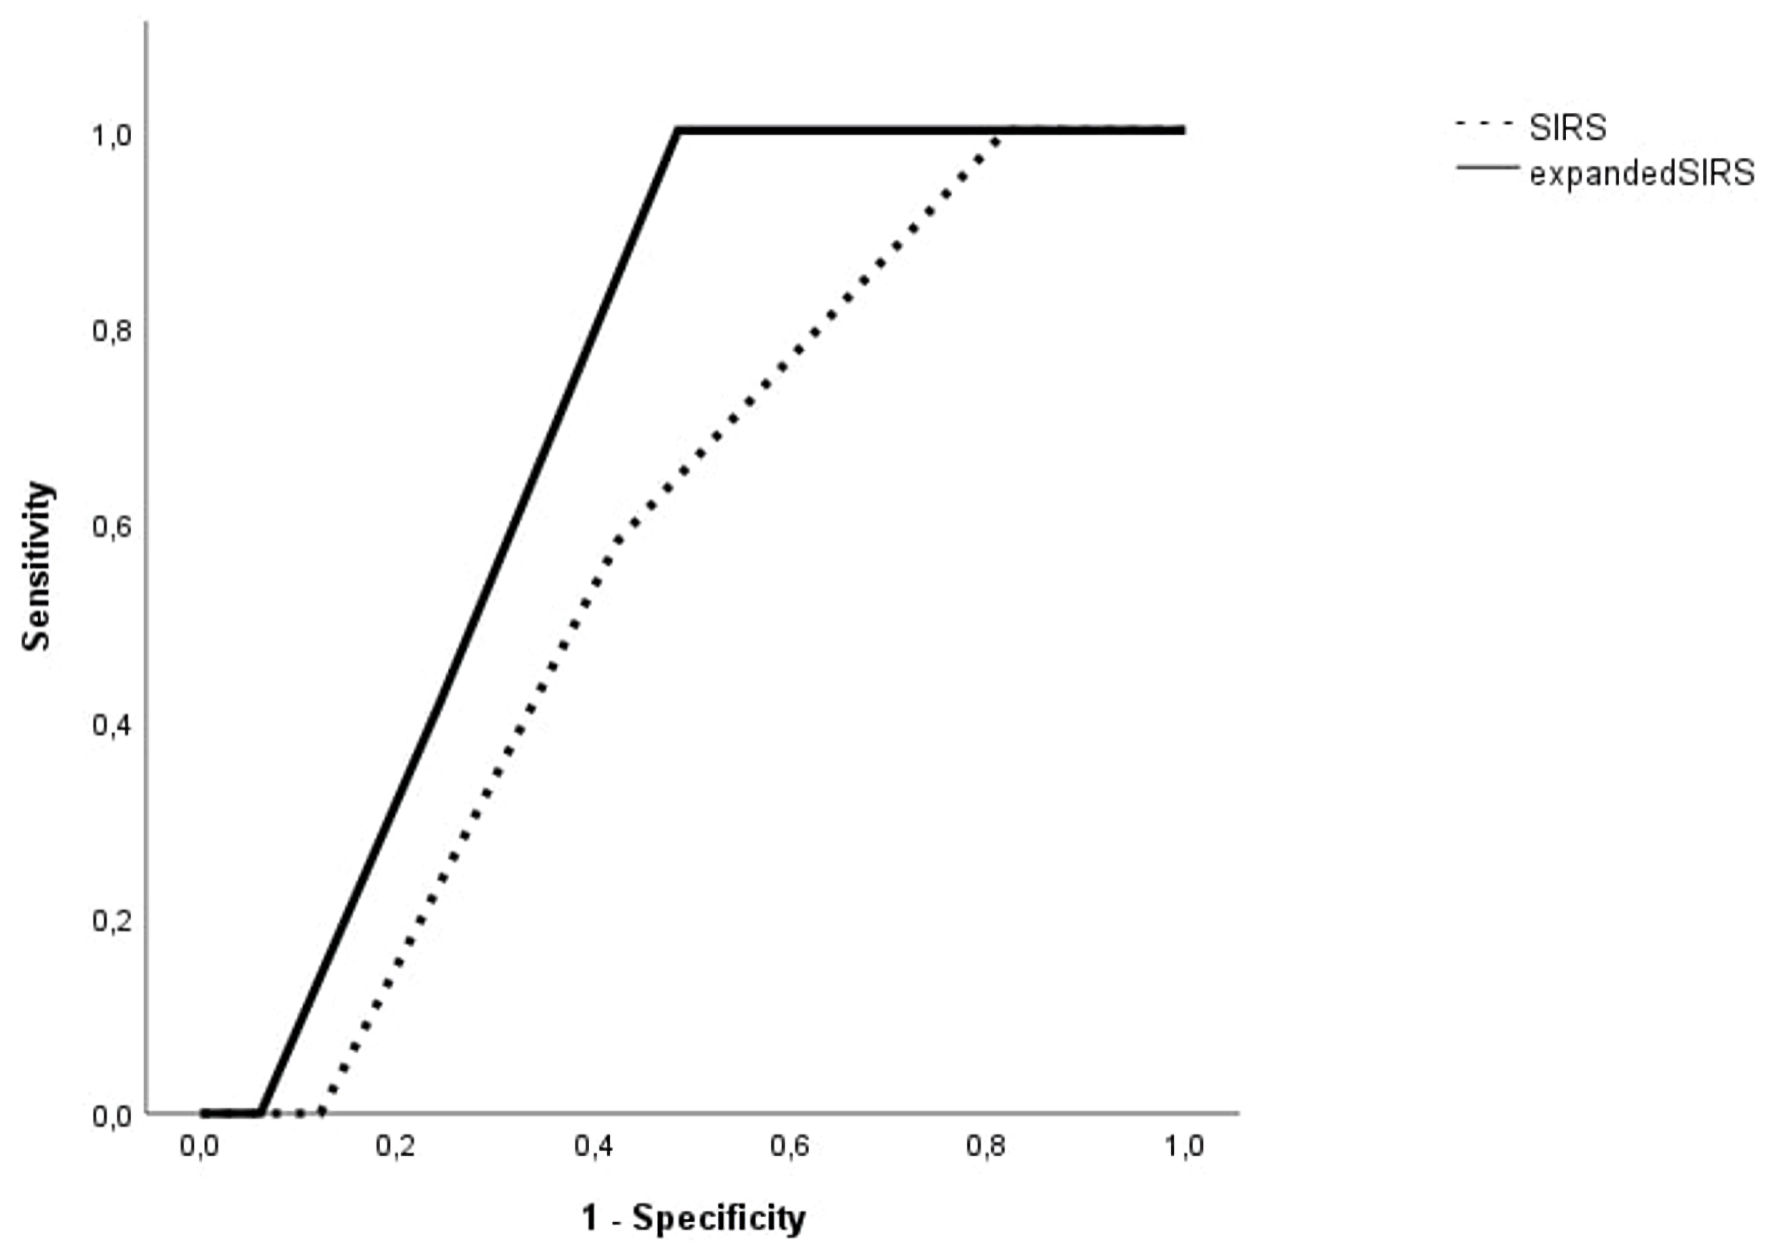
↓ Figure 6. The area under the receiver operating
characteristic (ROC) curve of SIRS and expanded SIRS (SIRS combined with cutoff value of IL-33R) in
predicting in-hospital mortality of sepsis patients with lower respiratory tract infections. SIRS:
systemic inflammatory response syndrome; IL-33R: interleukin-33 receptor.
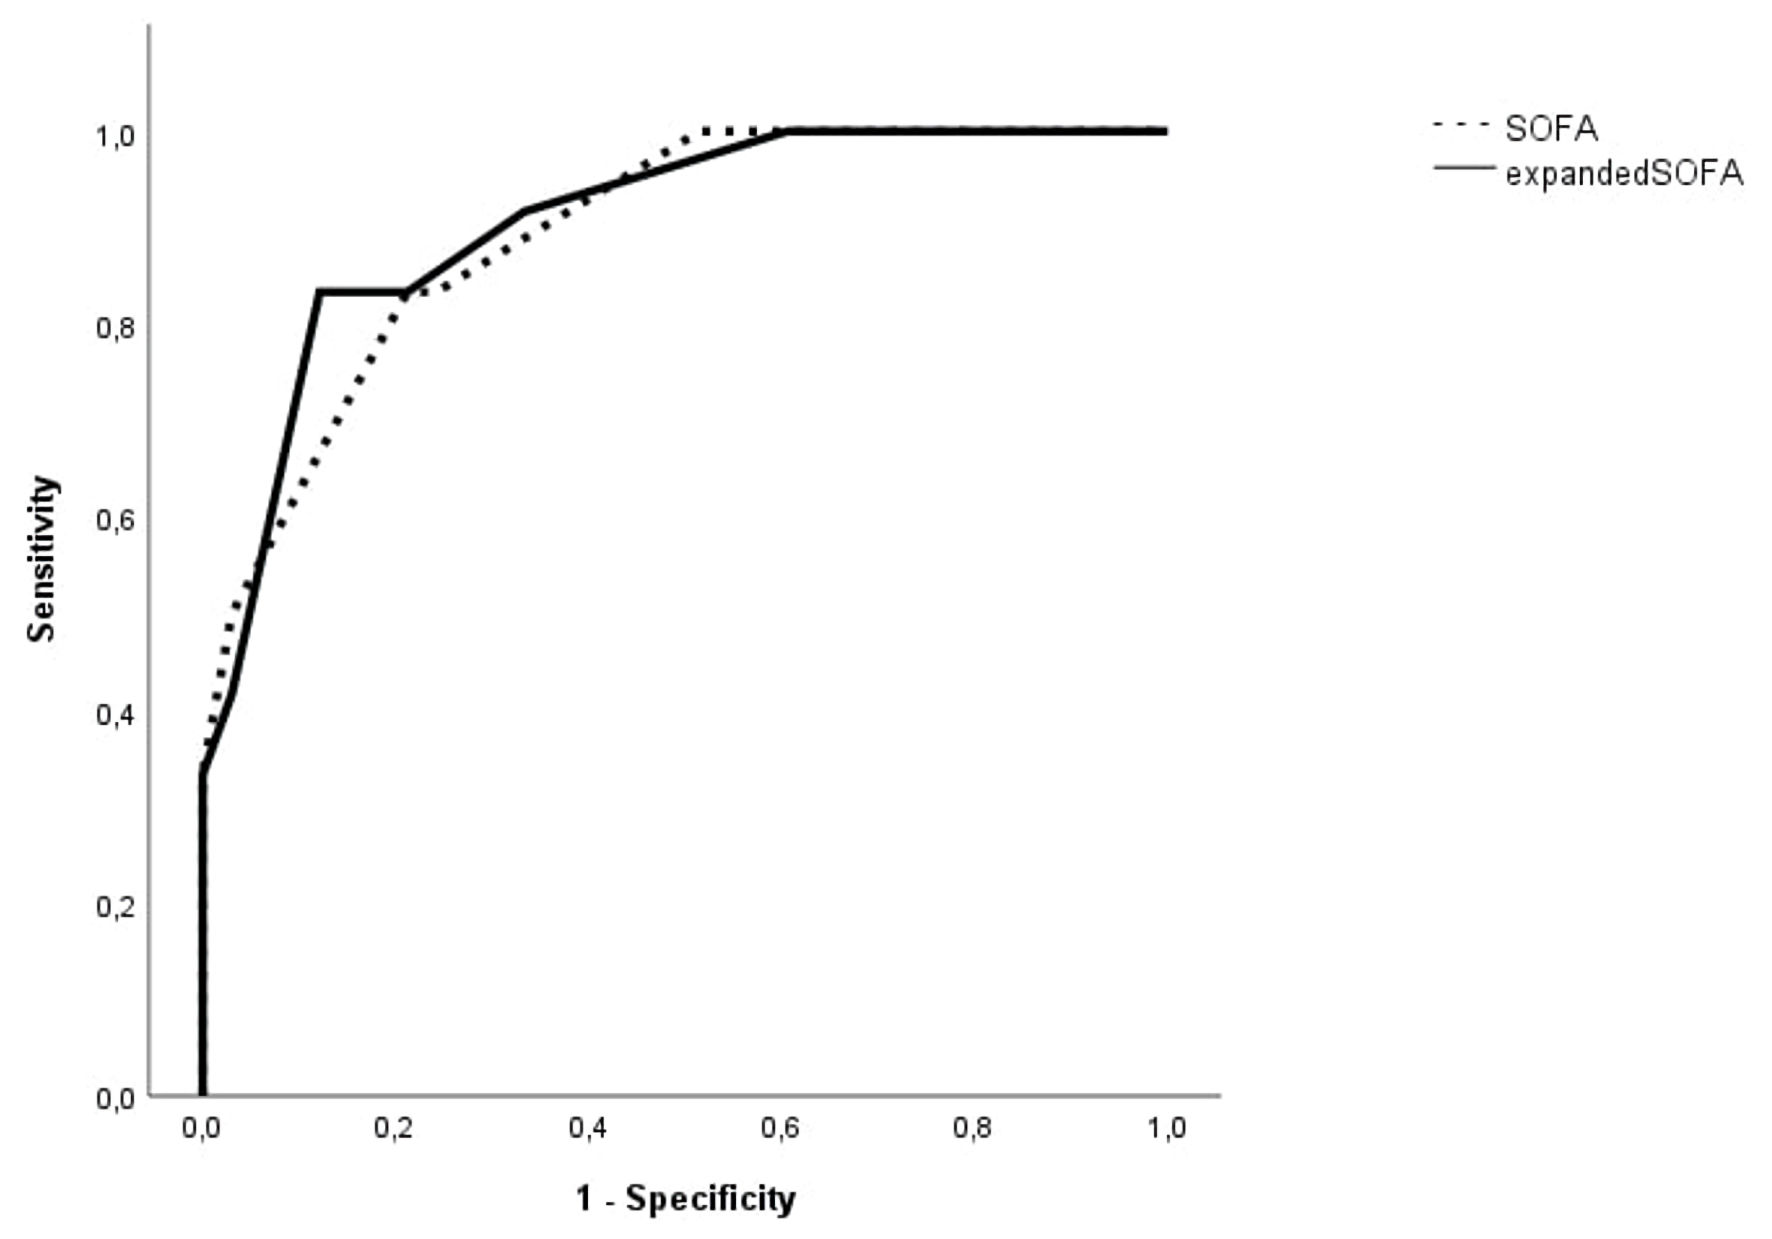
↓ Figure 7. The area under the receiver operating
characteristic (ROC) curve of SOFA and expanded SOFA (SOFA combined with cutoff value of IL-33R) in
predicting in-hospital mortality of sepsis patients with lower respiratory tract infections. SOFA:
Sequential Organ Failure Assessment; IL-33R: interleukin-33 receptor.
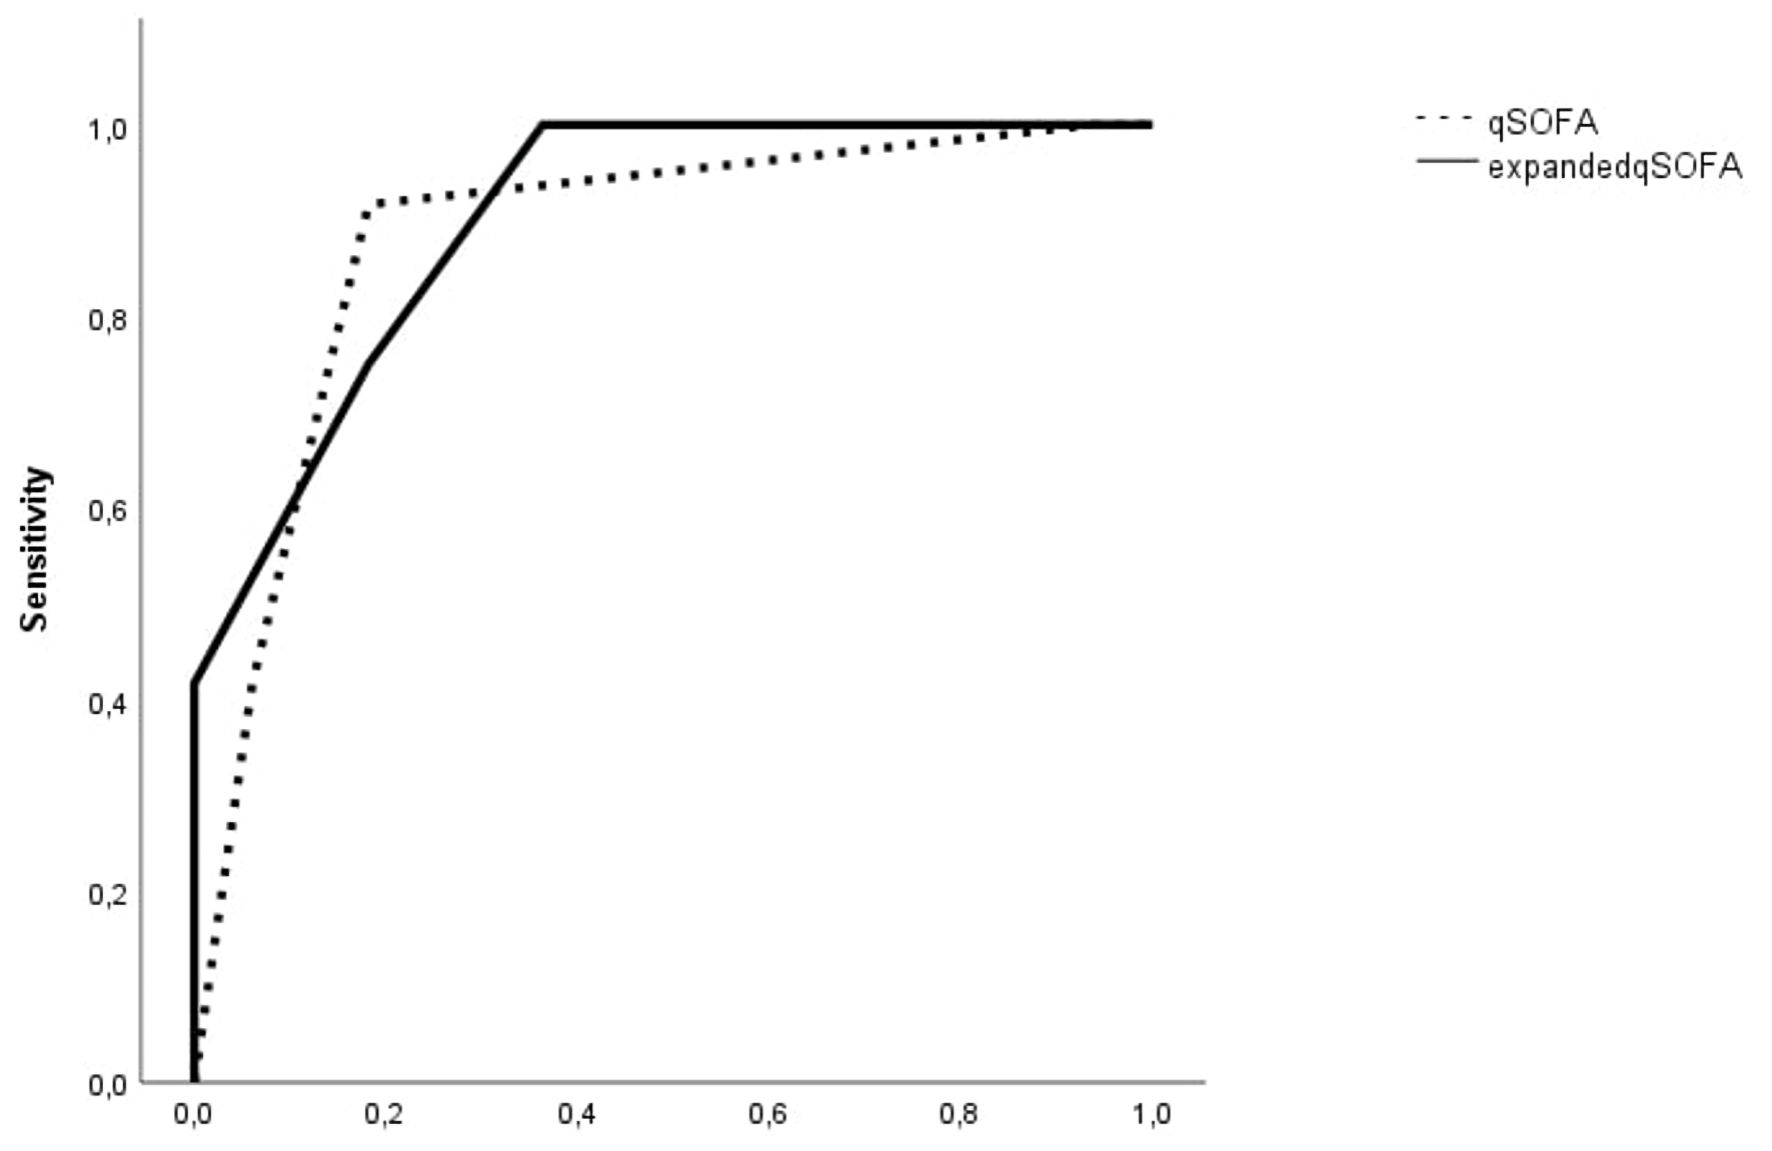
↓ Figure 8. The area under the receiver operating
characteristic (ROC) curve of qSOFA and expanded qSOFA (qSOFA combined with cutoff value of IL-33R) in
predicting in-hospital mortality of sepsis patients with lower respiratory tract infections. qSOFA:
quick SOFA; SOFA: Sequential Organ Failure Assessment; IL-33R: interleukin-33 receptor.
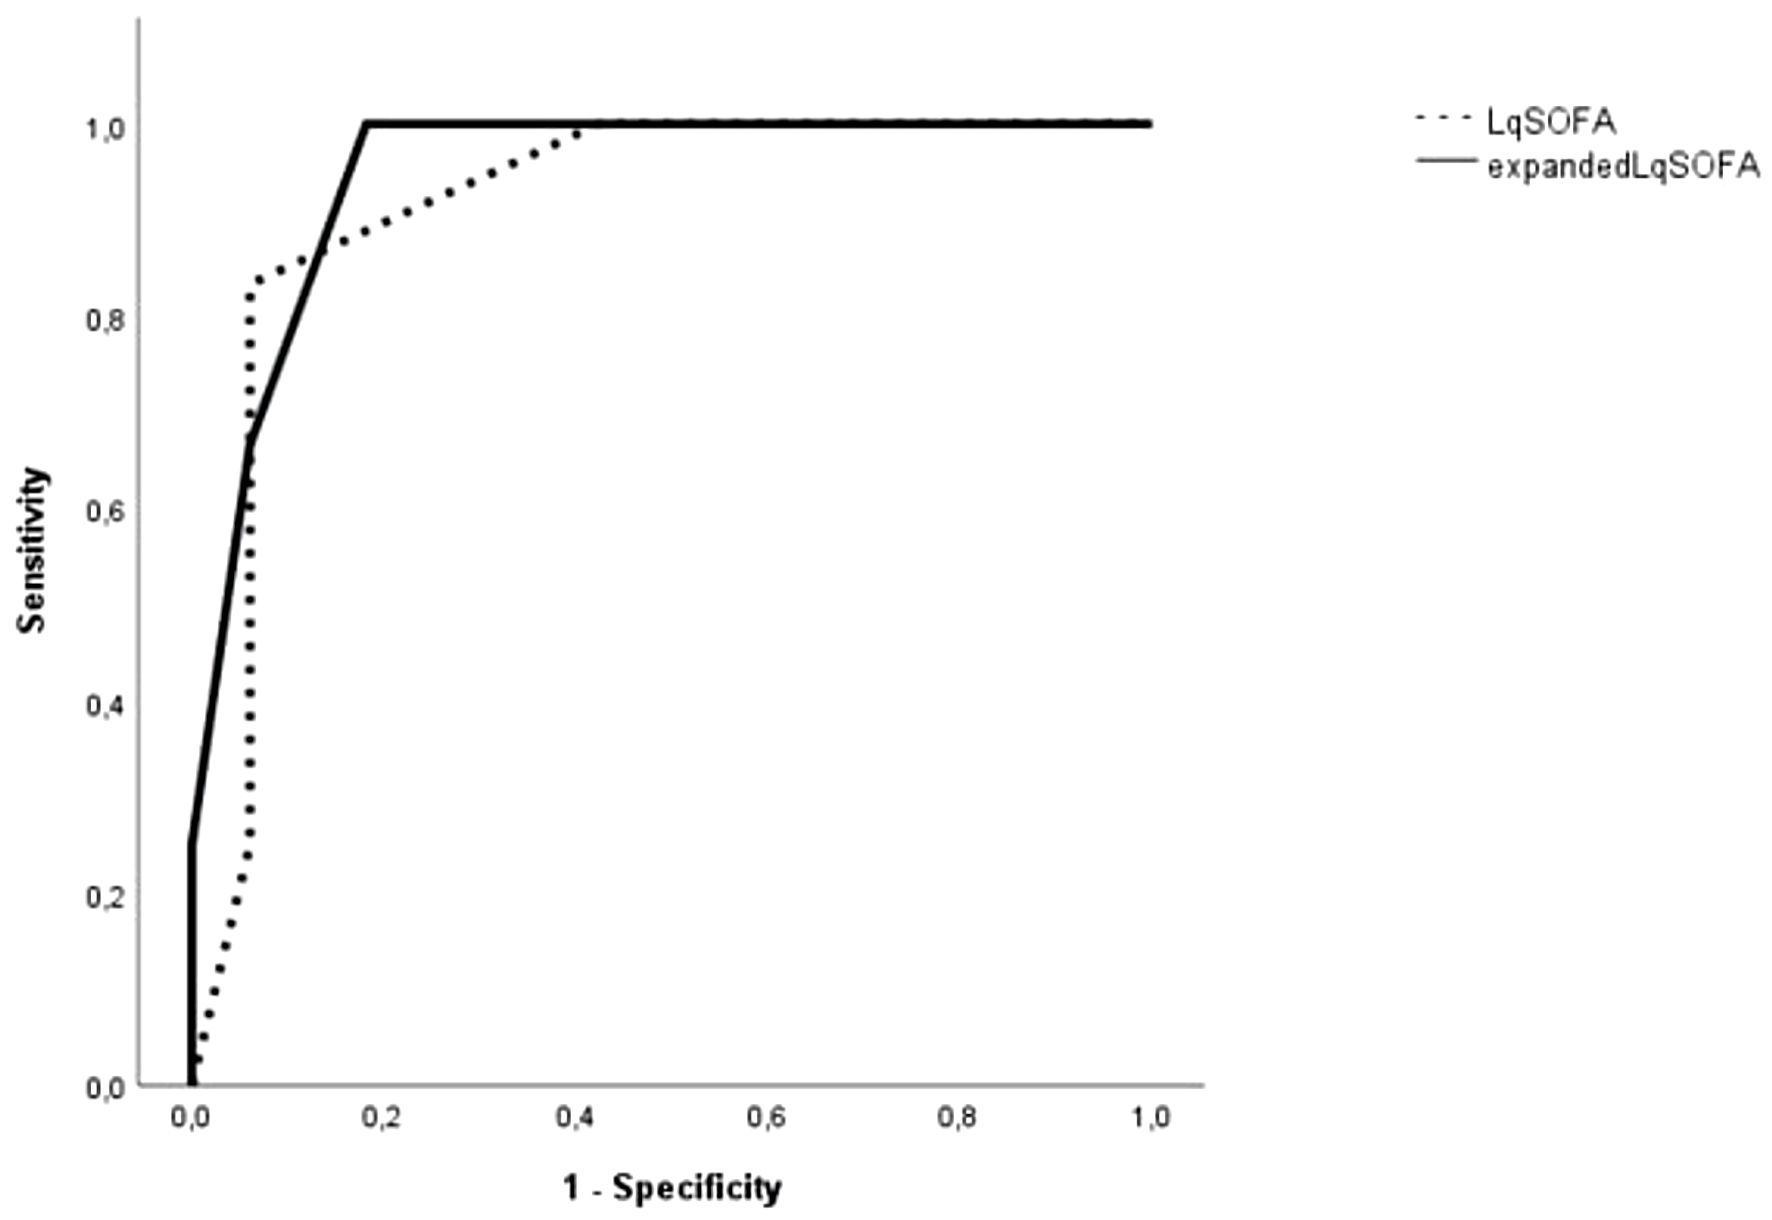
↓ Figure 9. The area under the receiver operating
characteristic (ROC) curve of LqSOFA and expanded LqSOFA (LqSOFA combined with cutoff value of IL-33R)
in predicting in-hospital mortality of sepsis patients with lower respiratory tract infections. LqSOFA:
lactate quick SOFA; SOFA: Sequential Organ Failure Assessment; IL-33R: interleukin-33 receptor.
Table
↓ Table 1. Study Population Demographics and Baseline
Characteristics
|
Survival |
P |
| No
|
Yes
|
| BTI: biliary tract infections; CKD: khronic kidney disease; CNS: central nervous system;
COPD: chronic obstructive pulmonary disease; CRP: C-reactive protein; CVD: cardiovascular disease;
LqSOFA: lactate quick SOFA; NS: not statistically significant; qSOFA: quick SOFA; RTI: respiratory
tract infections; SIRS: systemic inflammatory response syndrome; SOFA: Sequential Organ Failure
Assessment; TNF: tumor necrosis factor; UTI: urinary tract infections; WBC: white blood cells; IL:
interleukin. |
| Number |
26 |
80 |
|
| Age |
83.5(73.3 - 88.3) |
79 (66.5 - 85.8) |
NS (0.09) |
| Male |
7 (27%) |
43 (53.8%) |
0.023 |
| Female |
19 (73%) |
37 (46.3%) |
0.023 |
| Type of infection |
|
|
|
| RTI |
12 (46.2%) |
34 (42.5%) |
|
| UTI |
2 (7.7%) |
22 (27.5%) |
|
| Colitis |
1 (3.8%) |
4 (5%) |
|
| Mixed infections |
9 (34.6%) |
9 (11.3%) |
|
| BTI |
2 (7.7%) |
6 (7.5%) |
|
| CNS infections |
0 |
3 (3.8%) |
|
| Other |
0 |
2 (2.5%) |
|
| Bacteremia |
5 (19.2%) |
13 (16.3%) |
|
| Comorbidities |
|
|
|
| CVD |
19 (73%) |
57 (71.3%) |
NS (0.86) |
| Diabetes |
6 (23%) |
28 (35%) |
NS (0.26) |
| CKD |
1 (4%) |
8 (10%) |
NS (0.33) |
| COPD |
2 (7.7%) |
18 (22.5%) |
NS (0.09) |
| Neoplasm |
1 (4%) |
9 (11.3%) |
NS (0.26) |
| SOFA |
4.5 (4 - 7) |
3 (2 - 5) |
0.001 |
| SIRS |
3 (2 - 3) |
2 (2 - 3) |
NS (0.09) |
| qSOFA |
2 (2 - 3) |
1 (1 - 2) |
< 0.001 |
| LqSOFA |
3 (2 - 3) |
2 (1 - 2) |
< 0.001 |
| Lactate (mmol/L) |
2.6 (1.6 - 4.8) |
2 (1.5 - 3.3) |
NS (0.17) |
| CRP (mg/dL) |
14.6 (11.6 - 19) |
12.4 (4 - 22.3) |
NS (0.29) |
| WBC (cells/µL) |
14,495 (7,440 - 17,490) |
13,685 (8,660 - 18,380) |
NS (0.69) |
| Cytokines |
|
|
|
| IL-6 (pg/mL) |
331 (49.5 - 400) |
104 (57.3 - 400) |
NS (0.36) |
| IL-10 (pg/mL) |
87 (25.8 - 162.8) |
40 (25 - 116.8) |
NS (0.11) |
| TNF-α (pg/mL) |
50 (50 - 50) |
50 (50 - 50) |
NS (0.89) |
| IL-33R (pg/mL) |
136,800 (59,932 - 200,000) |
59,693 (34,920 - 182,035) |
0.021 |