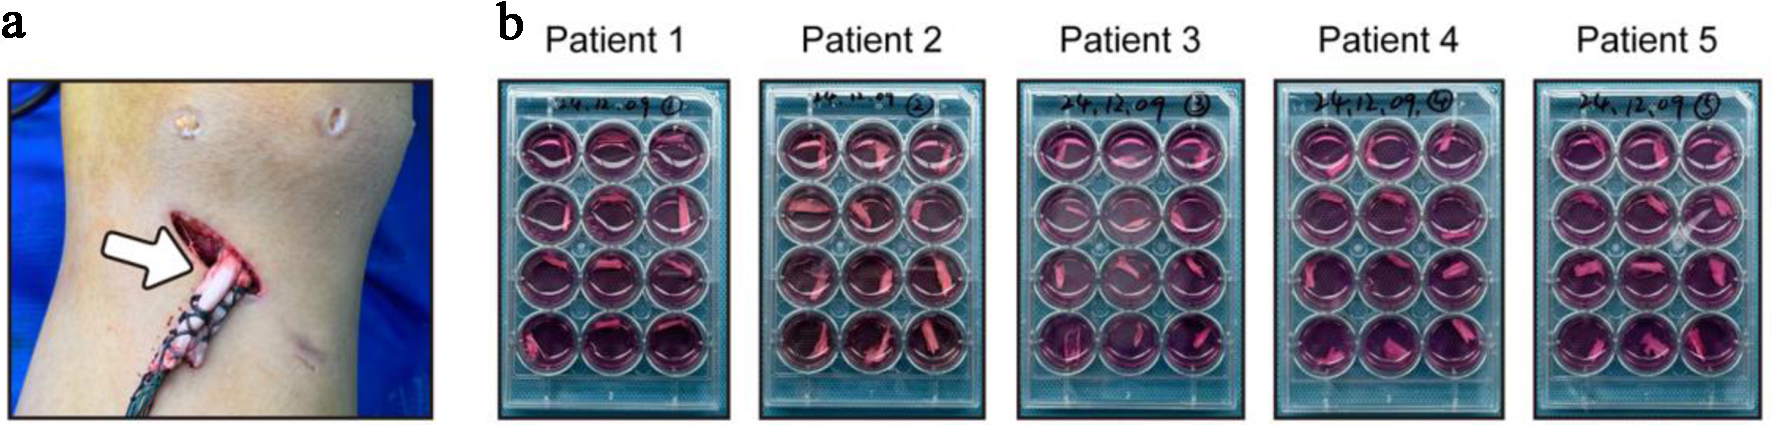
Journal of Clinical Medicine Research, ISSN 1918-3003 print, 1918-3011 online, Open Access
Article copyright, the authors; Journal compilation copyright, J Clin Med Res and Elmer Press Inc
Journal website https://jocmr.elmerjournals.com

Original Article

Volume 17, Number 11, November 2025, pages 634-641


Loadless Tendon Explant Model Exhibits Spontaneous Degradative Phenotypes: An In Vitro Study of Human Tendons

Figures

Figure 1.
Figure 1. Redundant tendon tissues were intraoperatively harvested and cultured without load in vitro. (a) Redundant tendon tissues were intraoperatively harvested from patients after anterior cruciate ligament reconstruction. (b) Tendon tissues were divided into 12 equal parts and cultured without load.
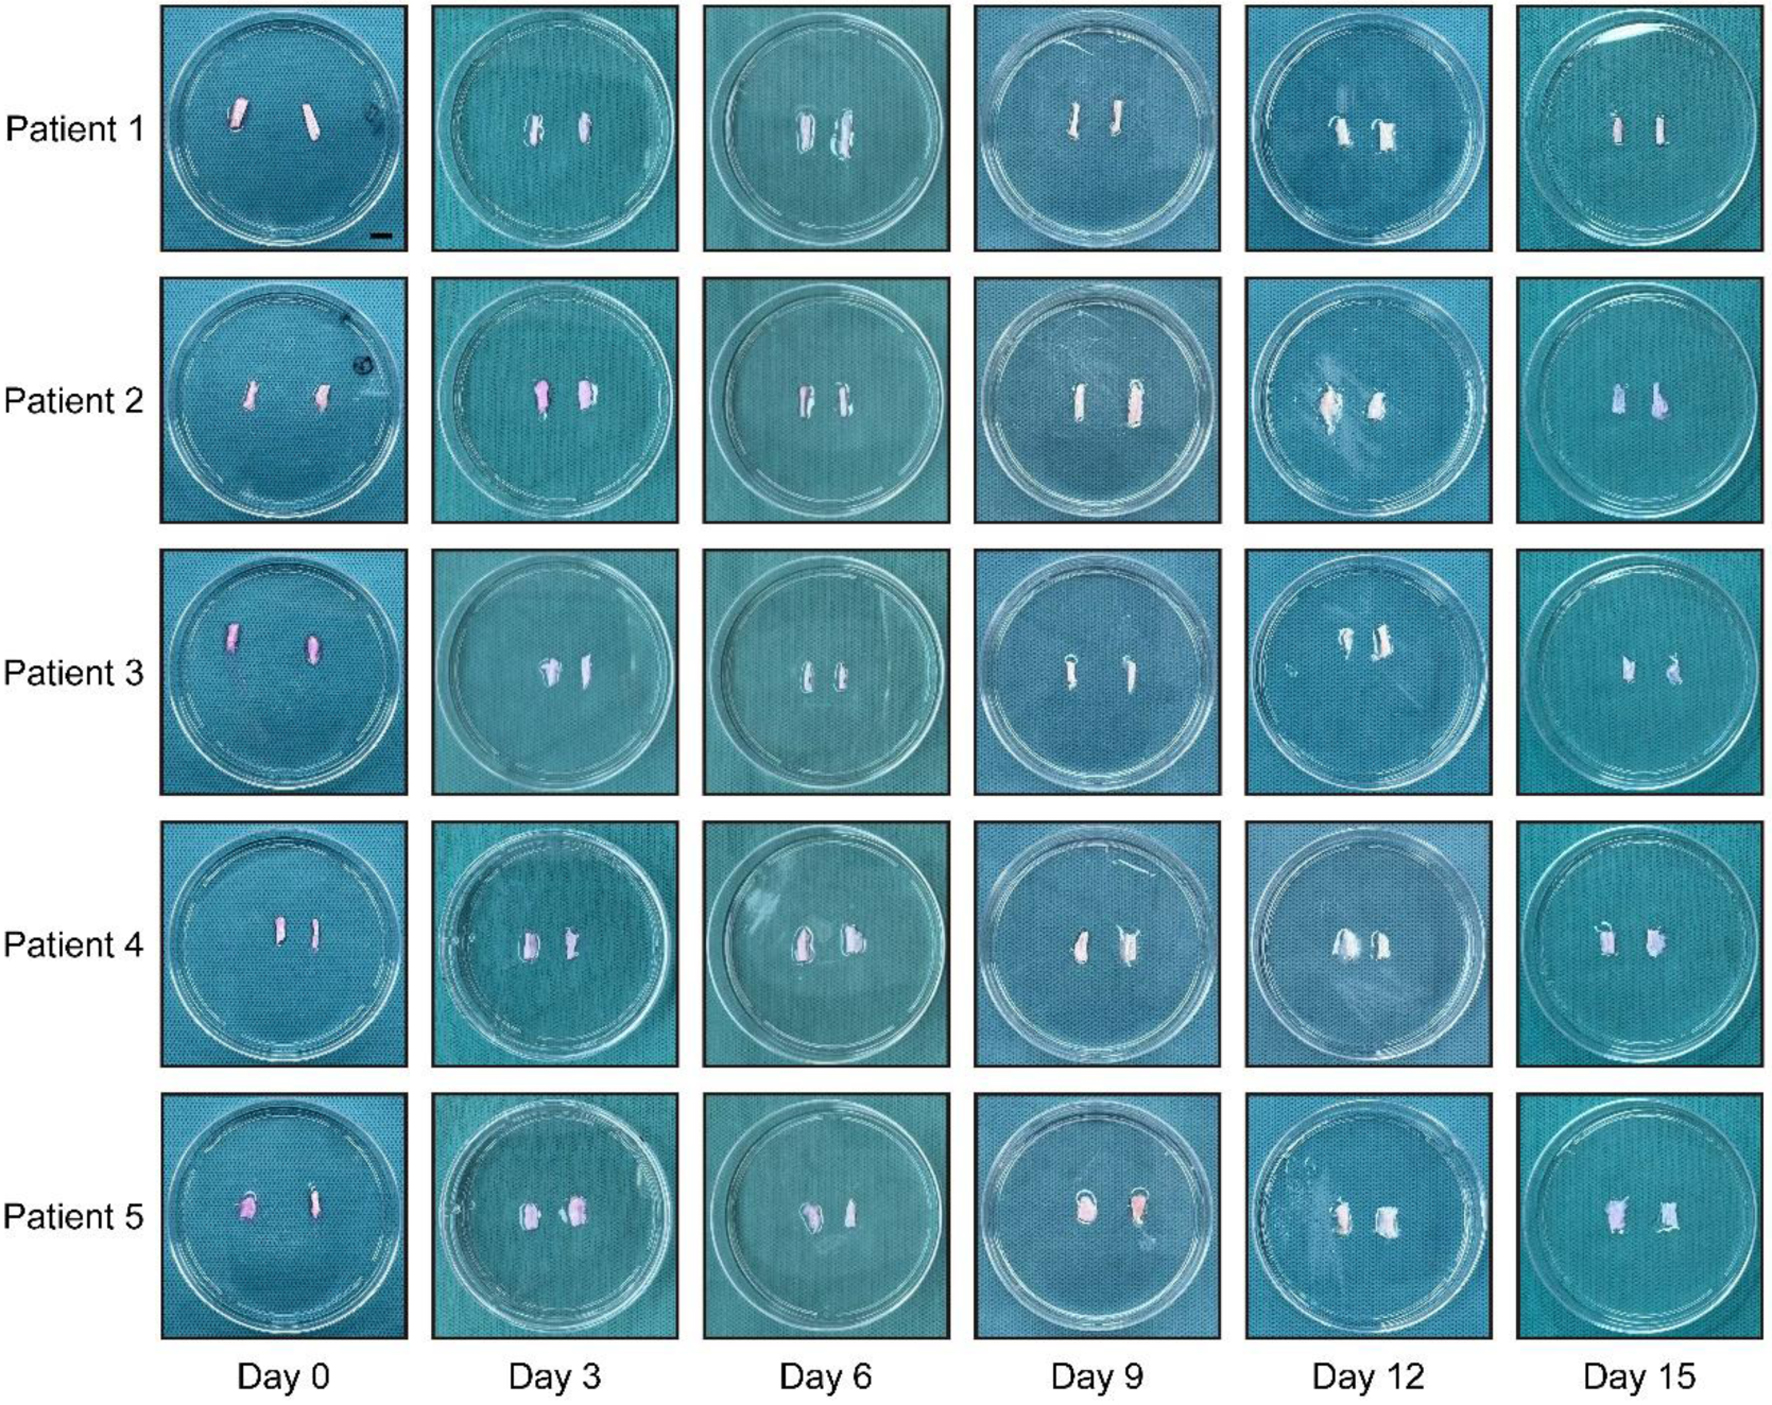
Figure 2.
Figure 2. Loadless tendon explants underwent spontaneous disintegration. Images showing morphological changes of tendon explants on day 0, 3, 6, 9, 12, and 15 from the five patients, respectively. Scale bar = 1 cm.
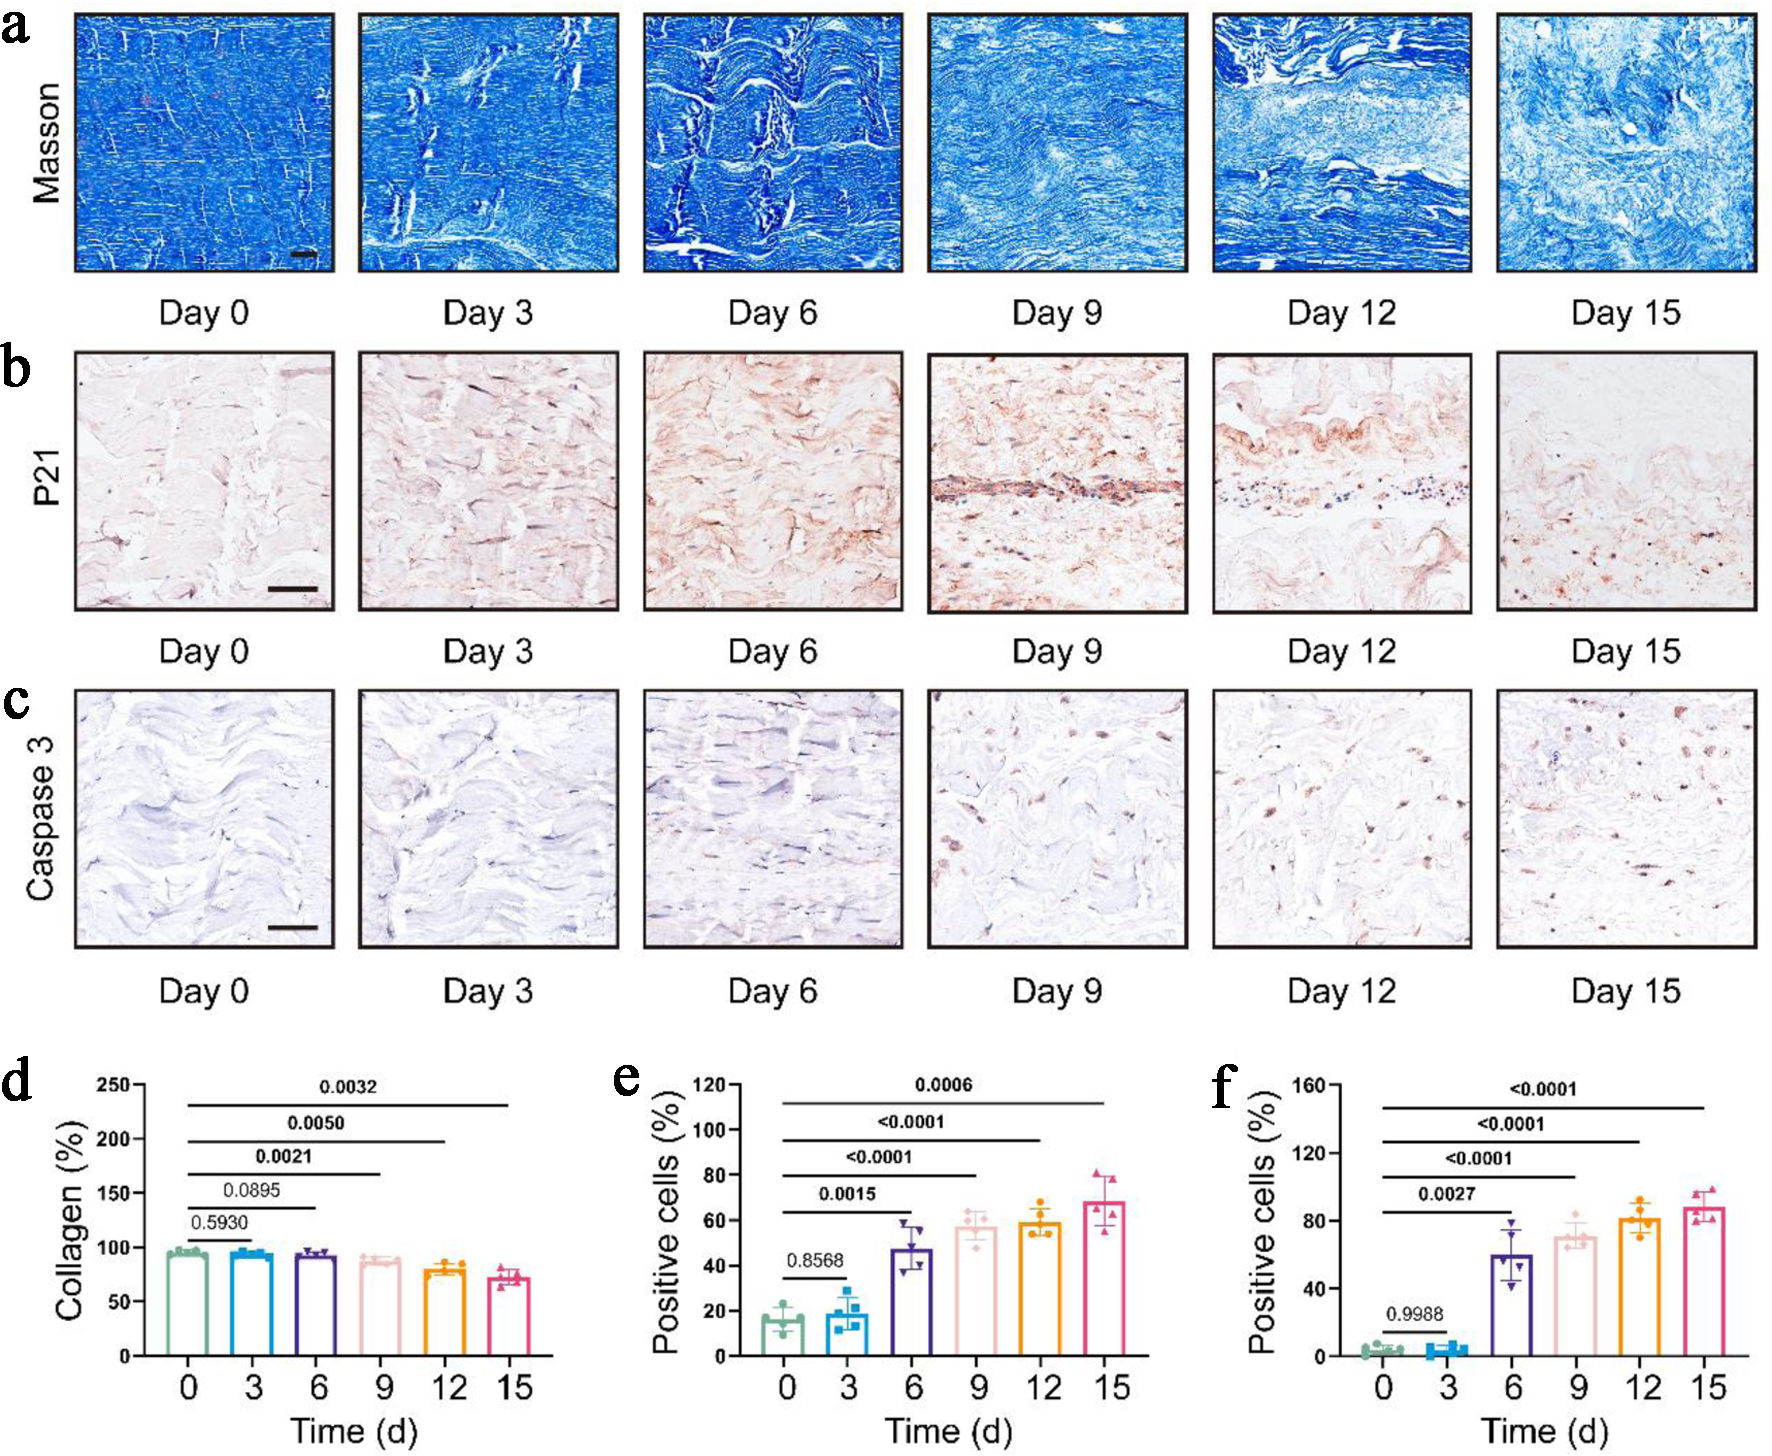
Figure 3.
Figure 3. Cell and matrix in loadless tendon explants demonstrated degradative phenotypes. (a) Representative images of Masson staining at different time points. Scale bar = 100 µm. (b, c) Representative images of immunohistochemical staining of P21 and Caspase 3 at different time points, respectively. Scale bar = 100 µm. (d-f) Quantitative analysis of collagen fiber density (d), P21-positive cell rate (e), and Caspase 3-positive cell rate (f), respectively. Data were presented as mean ± SD (n = 5). Repeated measures one-way ANOVA (compared to day 0) were adopted for statistical analysis. The P values have been annotated accordingly, with values indicating statistical significance bolded. ANOVA: analysis of variance; SD: standard deviation.
Figure 4.
Figure 4. Western blot showing decreasing trend of Collagen I and MMP 13 expression in tendon explants over time. Representative images showing Collagen I and MMP 13 expressions from day 0 to day 15 (a) or from day 0 to day 4 (b). MMP: metalloproteinase 13.

Table

Table 1. Baseline Data of the Five Patients
 
P1 (male)P2 (male)P3 (male)P4 (male)P5 (male)Mean ± SD
Alb: albumin; BMI: body mass index; Cr: creatinine; Hb: hemoglobin; PLT: platelet count; SD: standard deviation; UA: uric acid; WBC: white blood cell count.
Age (years)243031354633.2 ± 8.17
BMI (kg/m2)27.6224.0721.0126.4224.2124.67 ± 2.54
WBC (× 109/L)7.535.6110.079.407.828.09 ± 1.74
PLT (× 109/L)1.911.812.352.302.332.14 ± 0.26
Hb (g/L)161144134155144147.6 ± 10.55
Alb (g/L)42.541.443.641.941.842.24 ± 0.86
Cr (µmol/L)69.0108.195.672.872.083.5 ± 17.38
UA (mmol/L)466.8400.0388.1377.0332.7392.92 ± 48.51