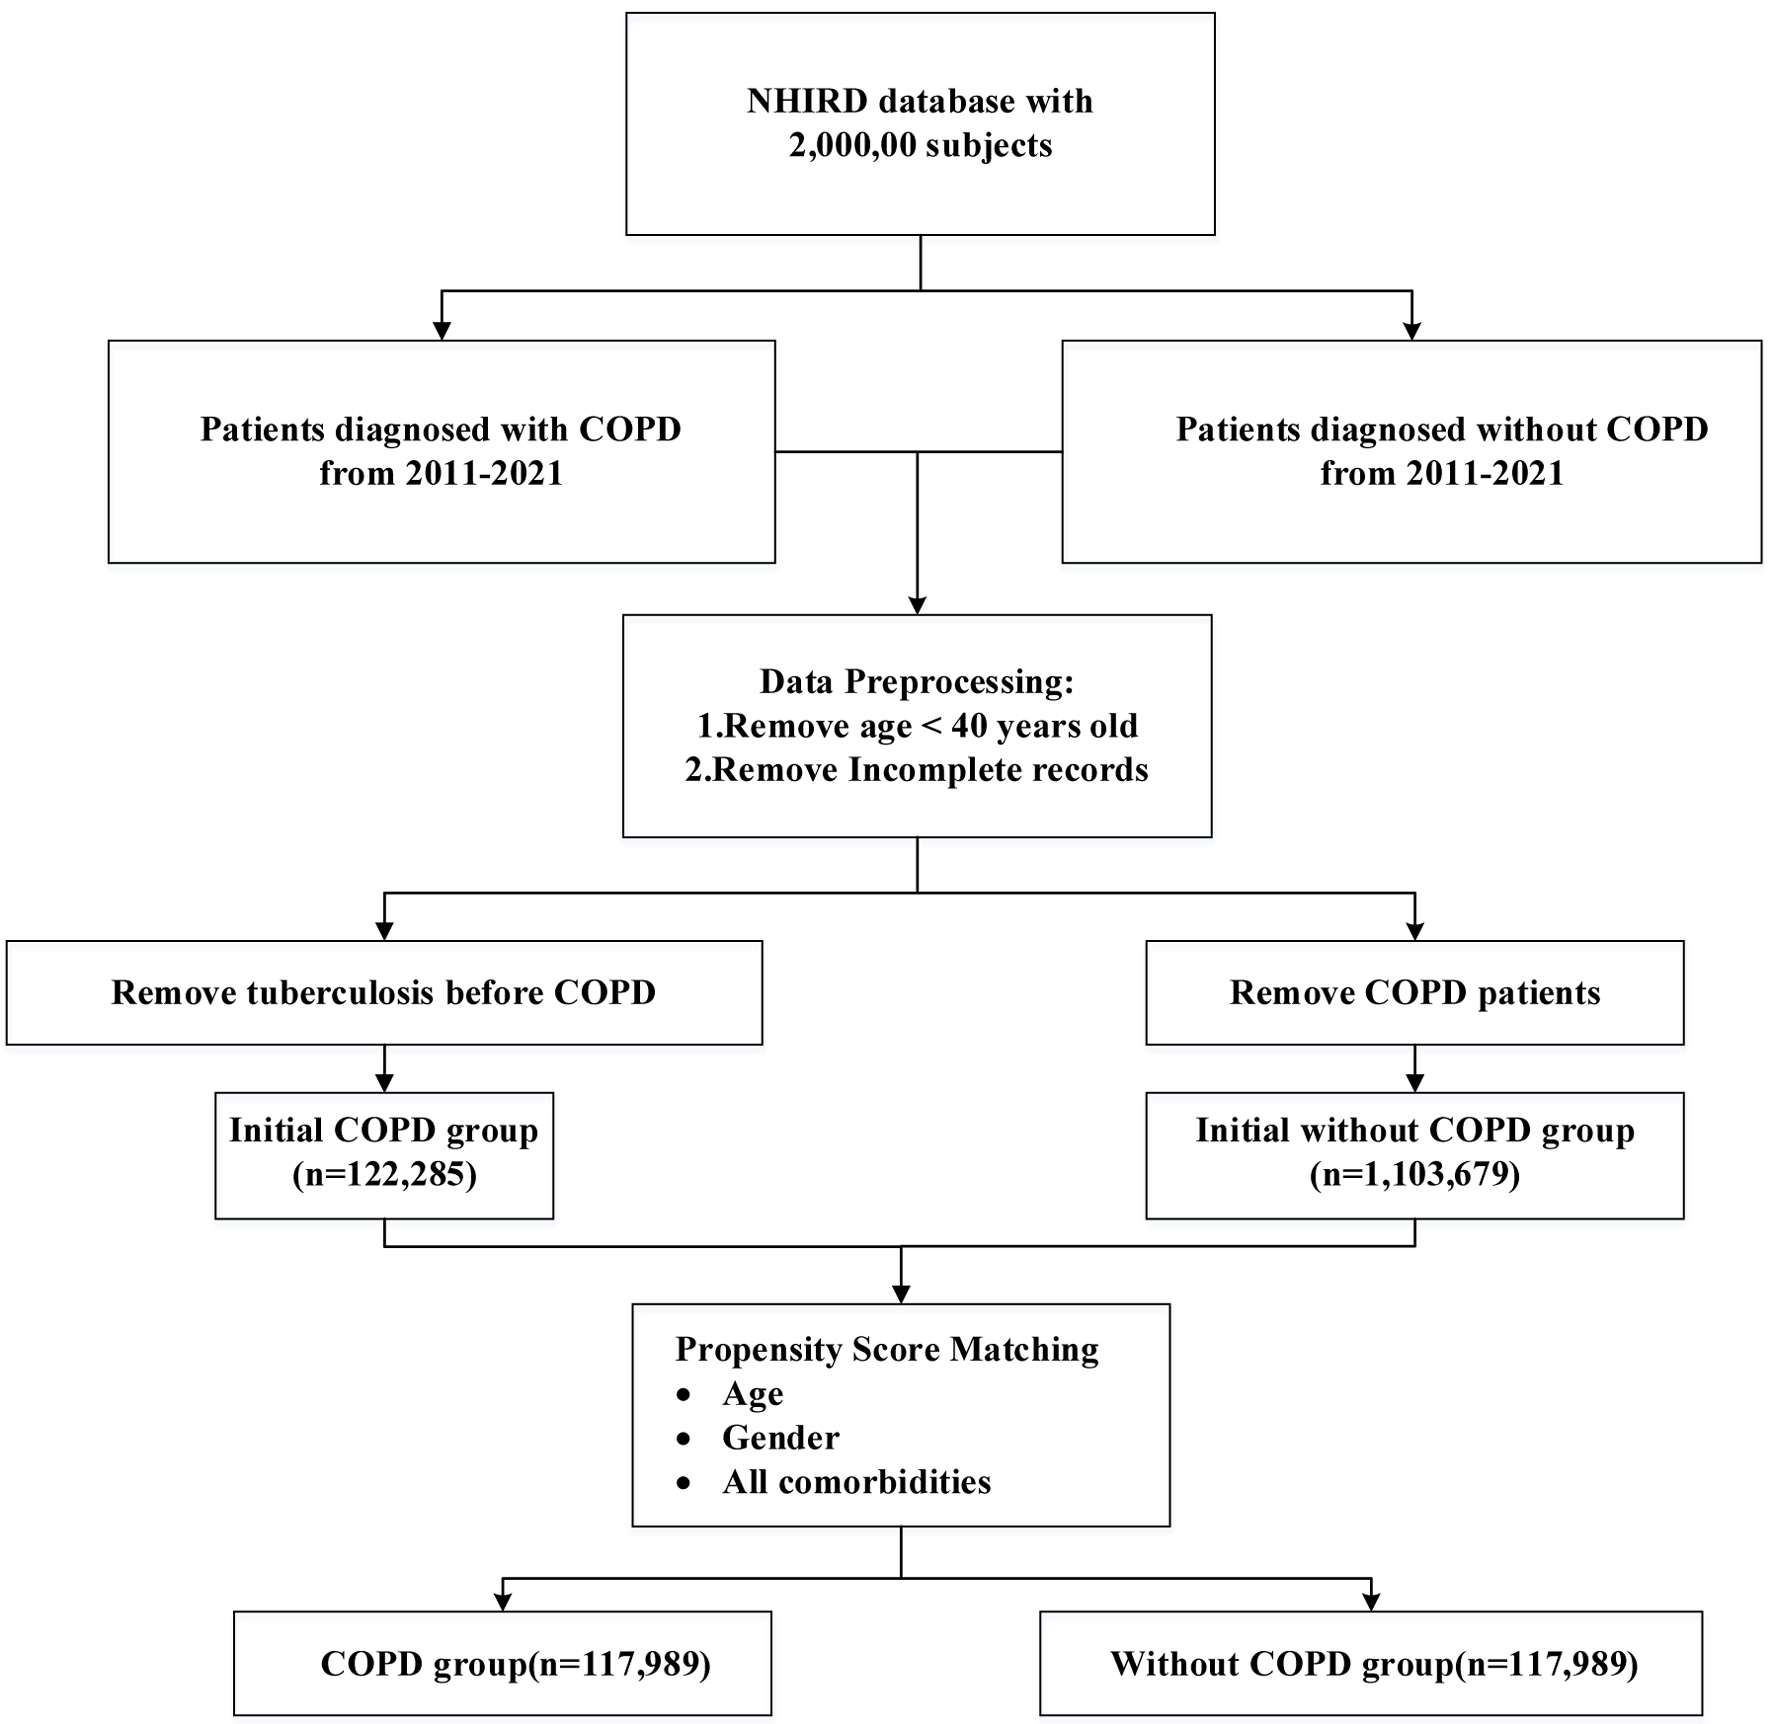
↓ Figure 1. Flowchart of subject enrollment.
| Journal of Clinical Medicine Research, ISSN 1918-3003 print, 1918-3011 online, Open Access |
| Article copyright, the authors; Journal compilation copyright, J Clin Med Res and Elmer Press Inc |
| Journal website https://jocmr.elmerjournals.com |
Original Article
Volume 17, Number 11, November 2025, pages 642-652
The Risk of Tuberculosis in Chronic Obstructive Pulmonary Disease Across Different Comorbidities
Figures
Tables
| Variables | COPD (n = 117,989) | Without-COPD (n = 117,989) | Standardized mean difference |
|---|---|---|---|
| COPD: chronic obstructive pulmonary disease; SD: standard deviation. | |||
| Age (%) | |||
| 40 - 49 | 15,371 (13.03) | 15,351 (13.01) | |
| 50 - 59 | 26,456 (22.42) | 26,419 (22.39) | |
| 60 - 69 | 33,389 (28.3) | 33,063 (28.02) | |
| ≥ 70 | 42,773 (36) | 43,156 (36.58) | |
| Mean (± SD) | 64.583 (± 12.18) | 64.625 (± 12.19) | 0.003 |
| Gender (%) | |||
| Male | 65,038 (55.12) | 64,409 (54.59) | 0.011 |
| Female | 52,951 (44.88) | 53,580 (45.41) | |
| Comorbidities (%) | |||
| Diabetes mellitus | 40,030 (33.93) | 39,159 (33.19) | 0.016 |
| Hypertension | 75,707 (64.16) | 75,814 (64.26) | 0.002 |
| Hyperlipidemia | 40,751 (34.54) | 40,609 (34.42) | 0.003 |
| Coronary artery disease | 36,005 (30.52) | 36,400 (30.85) | 0.007 |
| End-stage renal disease | 19,213 (16.28) | 18,953 (16.06) | 0.006 |
| Hepatitis B or C | 7,369 (6.25) | 7,288 (6.18) | 0.003 |
| Pneumoconiosis | 457 (0.39) | 316 (0.27) | 0.021 |
| Lung cancer | 7,899 (6.69) | 7,558 (6.41) | 0.012 |
| Rheumatoid arthritis | 3,144 (2.66) | 3,098 (2.63) | 0.002 |
| Head and neck cancer | 4,974 (4.22) | 4,693 (3.98) | |
| Outcomes (%) | |||
| Tuberculosis | 221 (0.19) | 176 (0.15) | 0.009 |
| Characteristics | COPD (n = 117,989) | Non-COPD (n = 117,989) | aHR (95%CI) | P-value | ||||
|---|---|---|---|---|---|---|---|---|
| Event | TFP (PY) | IR | Event | TFP (PY) | IR | |||
| aHR: adjusted hazard ratio; CI: confidence interval; COPD: chronic obstructive pulmonary disease; IR: incident rate per 10,000 person-years; PY: per 10,000 person-years; TFP: total follow-up period. | ||||||||
| Tuberculosis | 221 | 690,506.3 | 3.20 | 176 | 1,213,800 | 1.45 | 1.74 (1.423 - 2.135) | < 0.001 |
| Age | ||||||||
| 40 - 49 | 12 | 82,838.7 | 1.45 | 4 | 144,864.6 | 0.28 | 3.64 (1.16 - 11.46) | 0.027 |
| 50 - 59 | 36 | 152,159.3 | 2.37 | 21 | 269,416.5 | 0.78 | 2.16 (1.244 - 3.74) | < 0.001 |
| 60 - 69 | 53 | 189,244.0 | 2.80 | 47 | 339,772.1 | 1.38 | 1.66 (1.11 - 2.48) | 0.014 |
| ≥ 70 | 120 | 266,264.3 | 4.51 | 104 | 459,746.5 | 2.26 | 1.59 (1.22 - 2.08) | < 0.001 |
| Gender | ||||||||
| Male | 153 | 386,644.6 | 3.96 | 115 | 653,822.8 | 1.76 | 1.80 (1.41 - 2.3) | < 0.001 |
| Female | 68 | 303,861.7 | 2.24 | 61 | 559,976.8 | 1.09 | 1.59 (1.11 - 2.26) | 0.011 |
| Diabetes mellitus | ||||||||
| Presence | 77 | 248,046.2 | 3.10 | 77 | 418,748.7 | 1.84 | 1.31 (0.95 - 1.81) | 0.097 |
| Absence | 144 | 442,460 | 3.25 | 99 | 795,051 | 1.25 | 2.09 (1.61 - 2.72) | < 0.001 |
| Hypertension | ||||||||
| Presence | 146 | 468,761.9 | 3.11 | 128 | 807,871.7 | 1.58 | 1.61 (1.27 - 2.06) | < 0.001 |
| Absence | 75 | 221,744.4 | 3.38 | 48 | 405,928 | 1.18 | 2.03 (1.40 - 2.94) | < 0.001 |
| Hyperlipidemia | ||||||||
| Presence | 73 | 248,683.1 | 2.94 | 57 | 439,668.1 | 1.30 | 1.83 (1.28 - 2.61) | < 0.001 |
| Absence | 148 | 441,823.2 | 3.35 | 119 | 774,131.6 | 1.54 | 1.71 (1.34 - 2.19) | < 0.001 |
| Coronary artery disease | ||||||||
| Presence | 79 | 230,300.4 | 3.43 | 73 | 391,213.1 | 1.87 | 1.55 (1.12 - 2.15) | 0.008 |
| Absence | 142 | 460,205.9 | 3.09 | 103 | 822,586.6 | 1.25 | 1.85 (1.427 - 2.399) | < 0.001 |
| End-stage renal disease | ||||||||
| Presence | 48 | 122,849.1 | 3.91 | 58 | 204,352.9 | 2.84 | 1.17 (0.79 - 1.72) | 0.441 |
| Absence | 173 | 567,657.1 | 3.05 | 118 | 1,009,447 | 1.17 | 2.00 (1.57 - 2.54) | < 0.001 |
| Hepatitis B or C | ||||||||
| Presence | 19 | 45,944.76 | 4.14 | 19 | 78,950.59 | 2.41 | 1.20 (0.63 - 2.29) | 0.584 |
| Absence | 202 | 644,561.5 | 3.13 | 157 | 1,134,849 | 1.38 | 1.82 (1.47 - 2.25) | < 0.001 |
| Pneumoconiosis | ||||||||
| Presence | 5 | 3,295.30 | 15.17 | 3 | 3,309.62 | 9.06 | 1.21 (0.29 - 5.06) | 0.796 |
| Absence | 216 | 687,211 | 3.14 | 173 | 1,210,490 | 1.43 | 1.75 (1.42 - 2.14) | < 0.001 |
| Lung cancer | ||||||||
| Presence | 23 | 47,726.22 | 4.82 | 28 | 78,702.87 | 3.56 | 1.11 (0.63 - 1.95) | 0.714 |
| Absence | 198 | 642,780.1 | 3.08 | 148 | 1,135,097 | 1.30 | 1.86 (1.50 - 2.31) | < 0.001 |
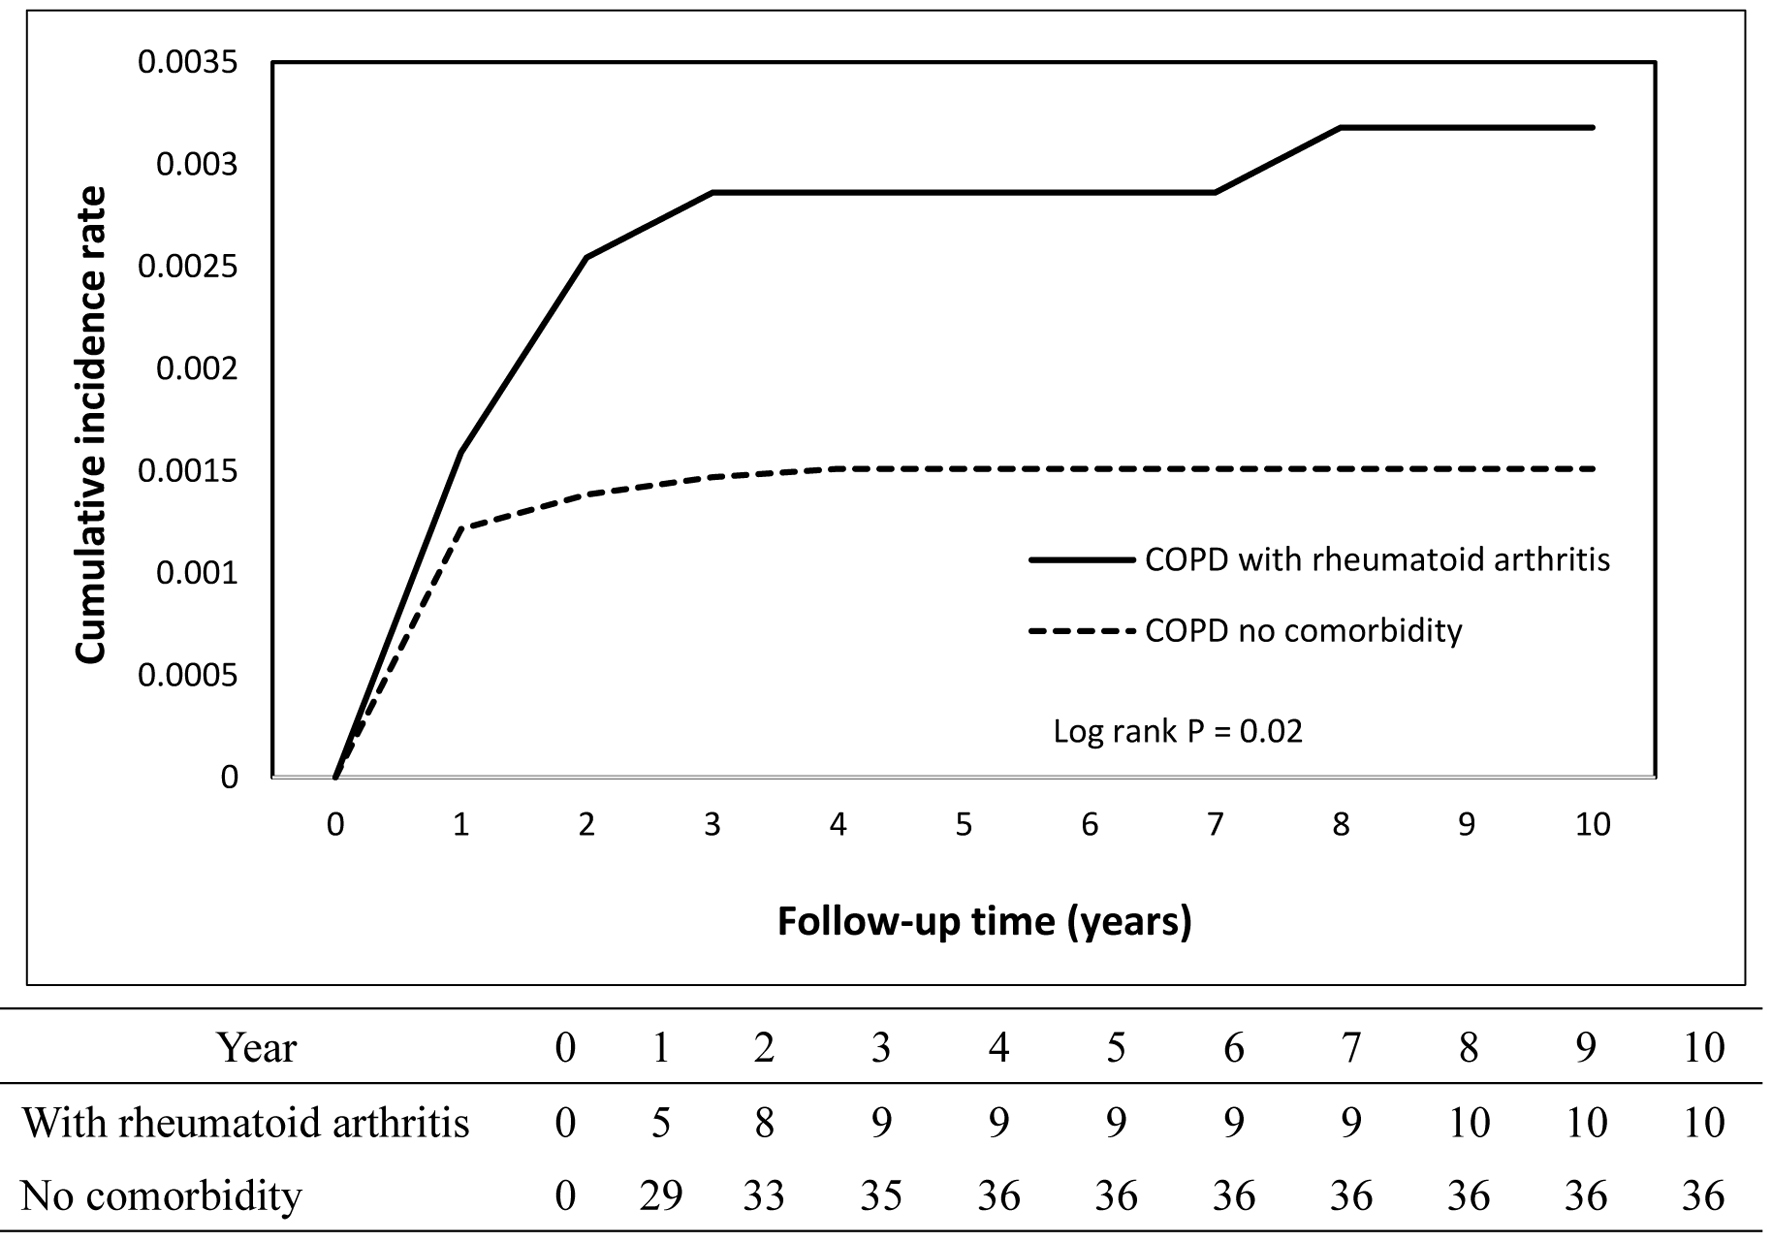
| Rheumatoid arthritis | ||||||||
| Presence | 10 | 18,919.67 | 5.29 | 0 | 33,426.95 | - | - | - |
| Absence | 211 | 671,586.6 | 3.14 | 176 | 1,180,373 | 1.49 | 1.67 (1.36 - 2.05) | < 0.001 |
| Head and neck cancer | ||||||||
| Presence | 11 | 28,943.24 | 3.80 | 11 | 48,490.89 | 2.27 | 1.41 (0.60 - 3.31) | 0.434 |
| Absence | 210 | 661,563 | 3.17 | 165 | 1,165,309 | 1.42 | 1.76 (1.43 - 2.17) | < 0.001 |
| Comorbidity | Number | Event | aHR (95% CI) | P-value |
|---|---|---|---|---|
| aNumber/n (%); bEvent/Number (%). *P < 0.05. aHR: adjusted hazard ratio; CI: confidence interval; COPD: chronic obstructive pulmonary disease. | ||||
| No comorbidity | 23,832 (20.20)a | 36 (0.15)b | - | - |
| Diabetes mellitus | 40,030 (33.93) | 77 (0.19) | 1.19 (0.80 - 1.76) | 0.400 |
| Hypertension | 75,707 (64.16) | 146 (0.19) | 1.16 (0.80 - 1.67) | 0.436 |
| Hyperlipidemia | 40,751 (34.54) | 73 (0.18) | 1.10 (0.74 - 1.65) | 0.631 |
| Coronary artery disease | 36,005 (30.52) | 79 (0.22) | 1.27 (0.86 - 1.89) | 0.236 |
| End-stage renal disease | 19,213 (16.28) | 48 (0.25) | 1.51 (0.98 - 2.32) | 0.065 |
| Hepatitis B or C | 7,369 (6.25) | 19 (0.26) | 1.63 (0.94 - 2.85) | 0.085 |
| Pneumoconiosis | 457 (0.39) | 5 (1.09) | 6.94 (2.72 - 17.71) | 0.001* |
| Lung cancer | 7,899 (6.69) | 23 (0.29) | 1.81 (1.07 - 3.05) | 0.027* |
| Rheumatoid arthritis | 3,144 (2.66) | 10 (0.32) | 2.05 (1.01 - 4.12) | 0.046* |
| Head and neck cancer | 4,974 (4.22) | 11 (0.22) | 1.42 (0.72 - 2.79) | 0.312 |