Journal of Clinical Medicine Research, ISSN 1918-3003 print, 1918-3011 online, Open Access
Article copyright, the authors; Journal compilation copyright, J Clin Med Res and Elmer Press Inc
Journal website https://jocmr.elmerjournals.com

Original Article

Volume 17, Number 9, October 2025, pages 518-528


Clinical Significance of the Cardio-Ankle Vascular Index as a Cardiovascular Disease Risk Factor in Japanese Elderly Patients With Obesity

Figures

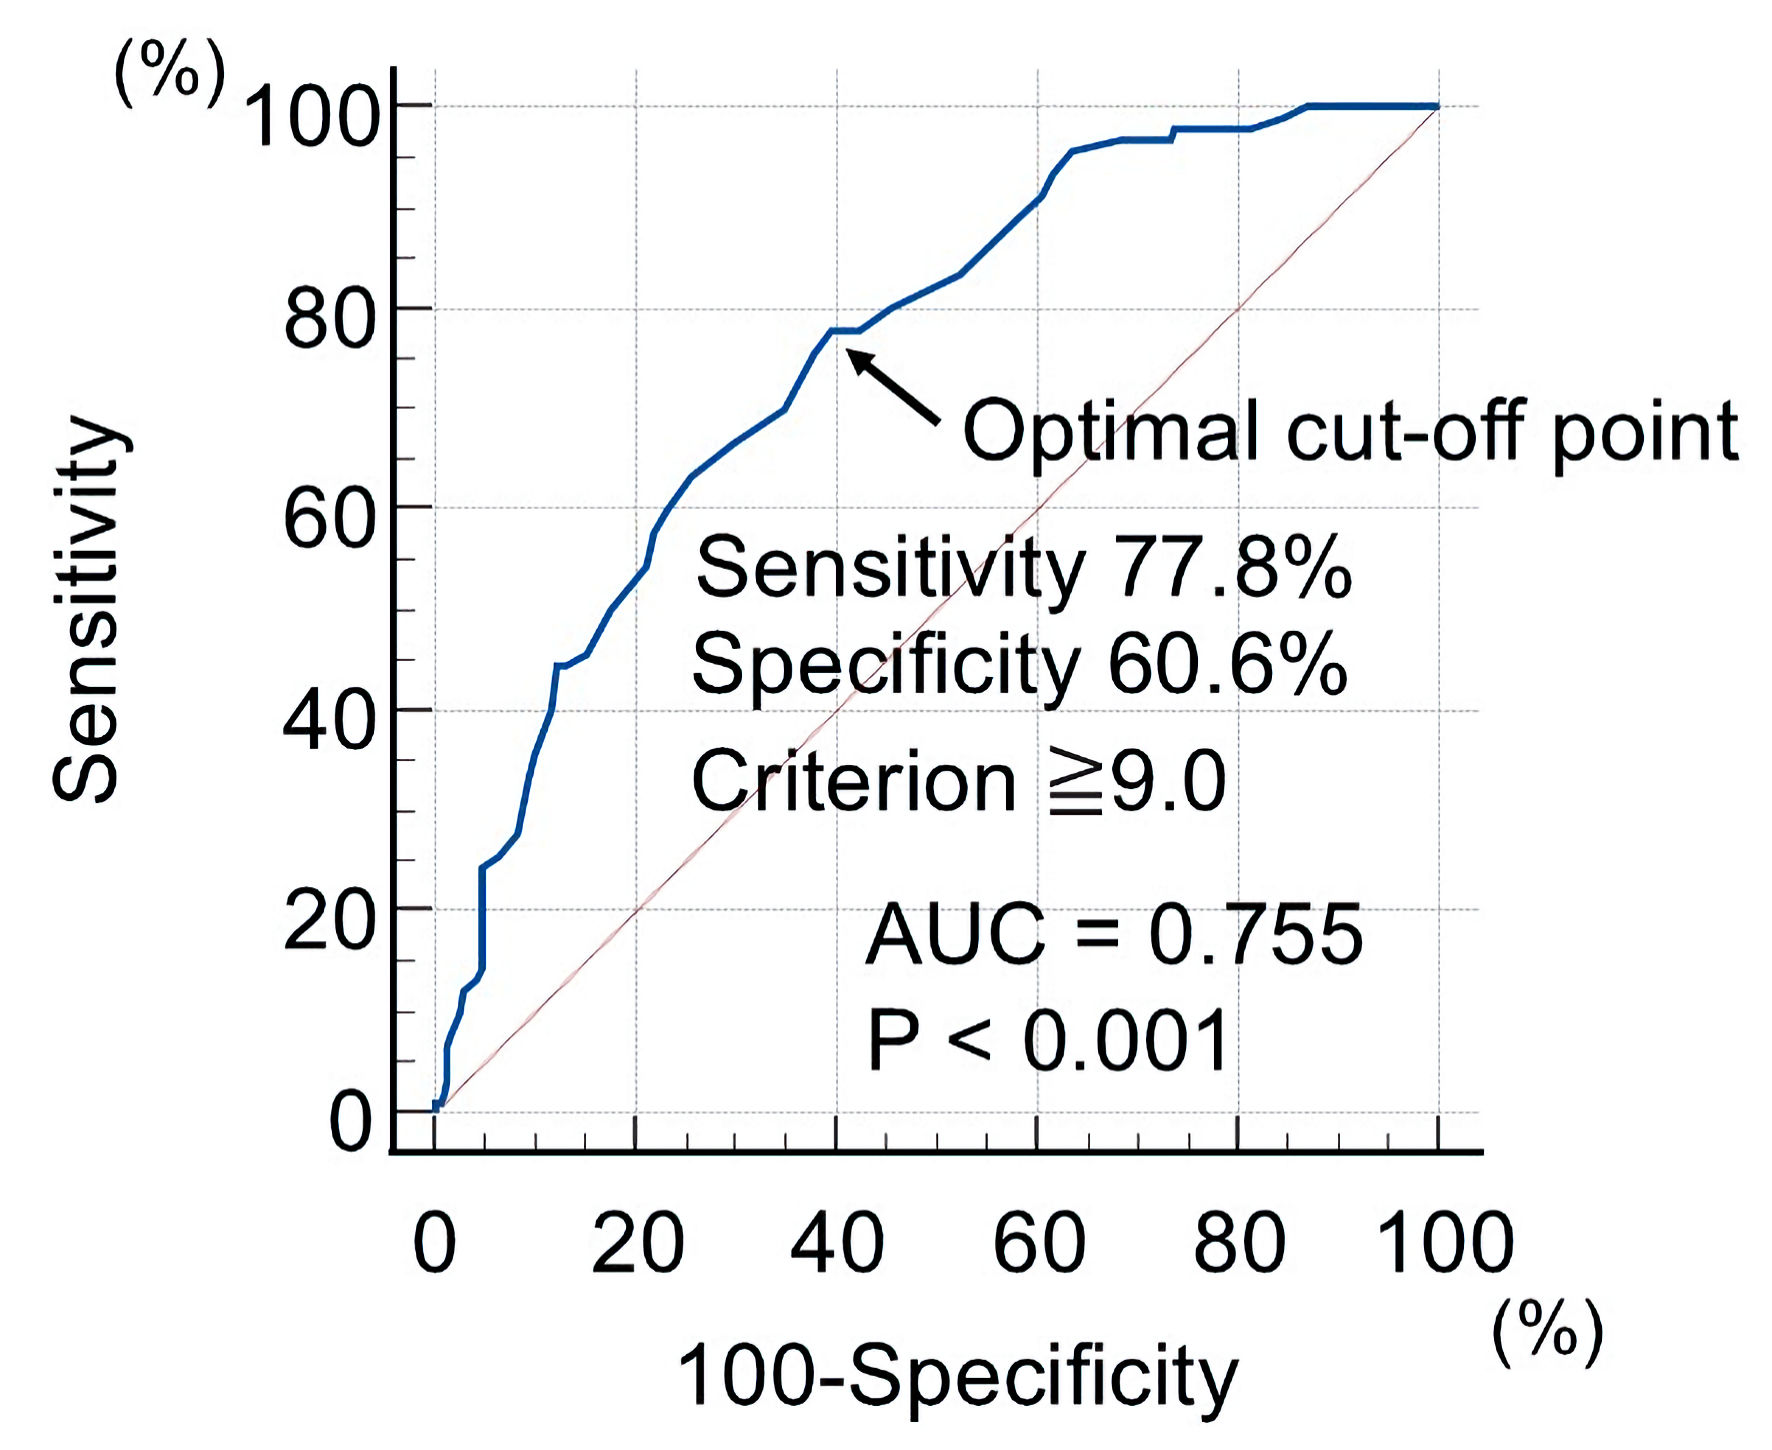
↓  Figure 1. Optimal cut-off value of CAVI to detect primary CVD events using receiver operating characteristic curve analysis. The patients were divided into two groups based on the optimal cut-off value of the CAVI (cut-off value: 9.0): high CAVI group (group H) and a low CAVI group (group L). CAVI: cardio-ankle vascular index; CVD: cardiovascular disease; AUC: area under the curve.
Figure 1.
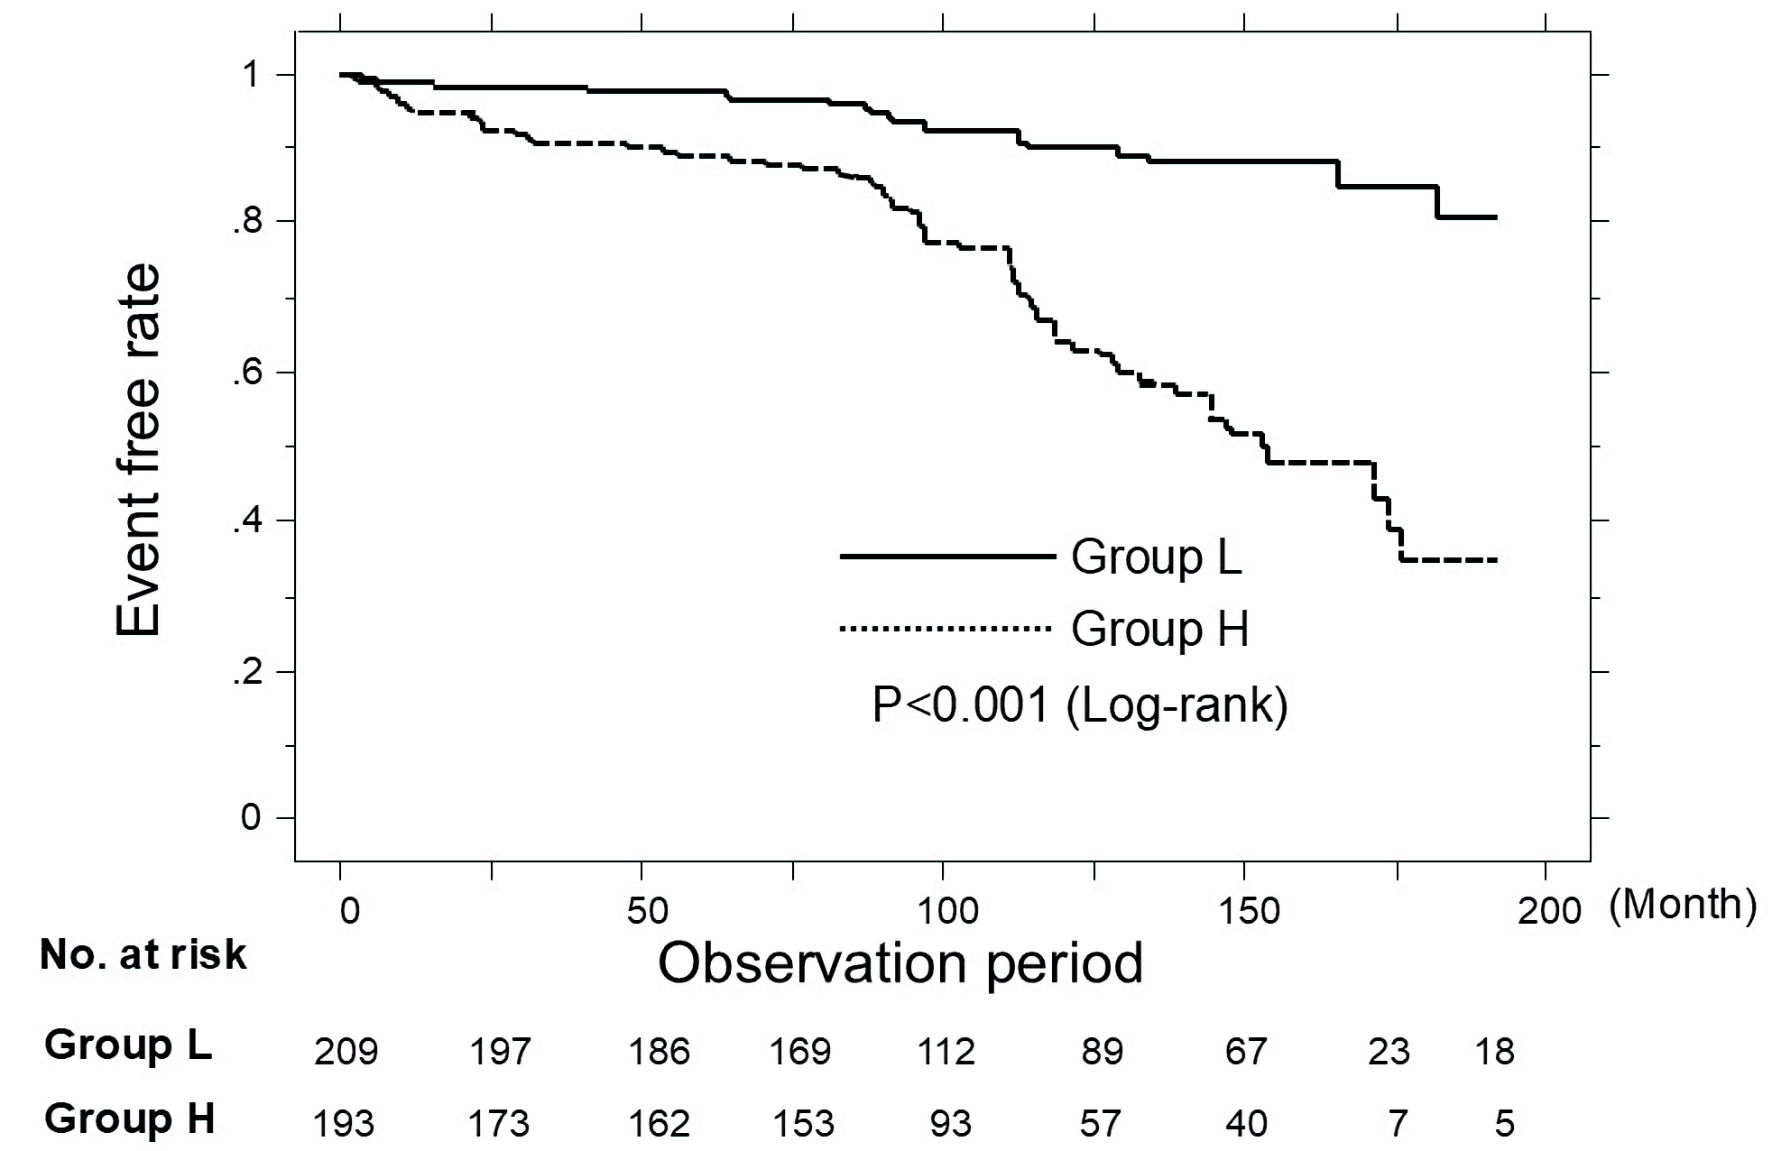
↓  Figure 2. Kaplan-Meier curve analysis for the incidence of primary CVD events in all patients. During the observation period, group H had a significantly higher incidence of primary CVD events than group L (P < 0.001, log-rank test). CVD: cardiovascular disease.
Figure 2.
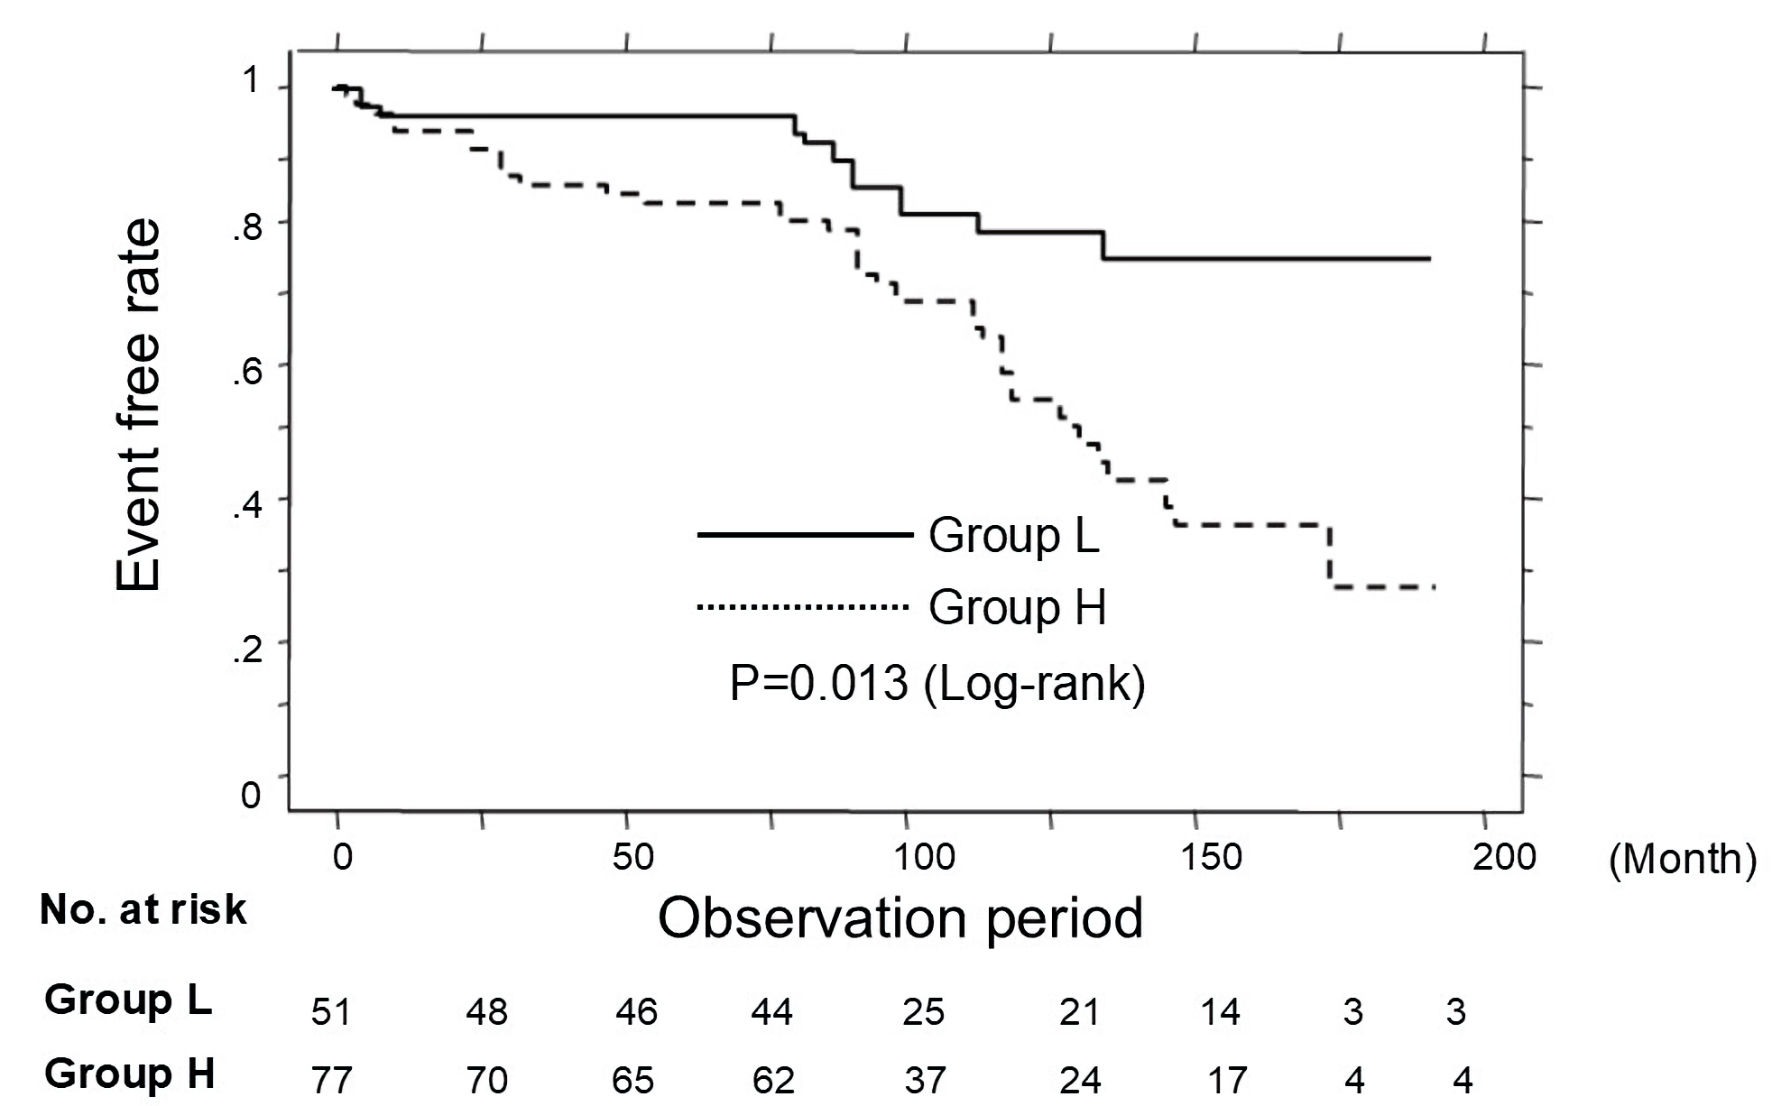
↓  Figure 3. Kaplan-Meier curve analysis in patients not using RAS inhibitor and statin. During the observation period, group H had a significantly higher incidence of primary CVD events than group L (P = 0.013, log-rank test). CVD: cardiovascular disease.
Figure 3.

Tables

↓  Table 1. Baseline Clinical Characteristics
 
Characteristics Overall Group L Group H P value
Continuous values are mean ± SD. CAVI: cardio-ankle vascular index; BMI: body mass index; VFA: visceral fat area; SFA: subcutaneous fat area; SBP: systolic blood pressure; DBP: diastolic blood pressure; LDL-C: low-density lipoprotein cholesterol; TG: triglyceride; HDL-C: high-density lipoprotein cholesterol; FBG: fasting blood glucose; HOMA-IR: homeostasis model assessment of insulin resistance; Pre-LpL mass: preheparin serum lipoprotein lipase mass; U-8-iso-PGF2α: urinary 8-iso-prostaglandinF2α; RAS: renin-angiotensin system; Ca: calcium; SD: standard deviation.
N (male/female) 402 (147/255) 209 (73/136) 193 (74/119) 0.478
Age (years) 72 ± 5 72 ± 5 73 ± 5 0.165
CAVI 9.0 ± 1.2 8.1 ± 0.6 10.6 ± 0.8 < 0.001
BMI (kg/m2) 27.7 ± 2.2 27.9 ± 2.2 27.4 ± 2.2 0.007
VFA (cm2) 134 ± 56 123 ± 52 146 ± 53 < 0.001
SFA (cm2) 210 ± 72 216 ± 72 203 ± 72 0.056
VFA/SFA 0.7 ± 0.4 0.7 ± 0.4 0.8 ± 0.5 0.003
Smoker, n (%) 98 (24) 44 (21) 54 (28) 0.107
Hypertension, n (%) 310 (77) 162 (78) 148 (77) 0.844
SBP (mm Hg) 136 ± 15 135 ± 15 136 ± 16 0.494
DBP (mm Hg) 86 ± 11 86 ± 11 86 ± 11 0.943
Diabetes mellitus, n (%) 138 (34) 62 (30) 76 (39) 0.041
Dyslipidemia, n (%) 309 (77) 163 (78) 146 (76) 0.579
LDL-C (mg/dL) 127 ± 40 126 ± 39 129 ± 41 0.533
TG (mg/dL) 145 ± 60 144 ± 62 147 ± 58 0.555
HDL-C (mg/dL) 49 ± 16 50 ± 17 47 ± 14 0.045
FBG (mg/dL) 111 ± 25 106 ± 22 115 ± 27 < 0.001
HOMA-IR 2.2 ± 1.4 1.7 ± 1.0 2.8 ± 1.6 < 0.001
Pre-LpL mass (ng/mL) 68 ± 16 71 ± 17 65 ± 18 < 0.001
U-8-iso-PGF2α (pg/mg Cr) 335 ± 156 302 ± 130 371 ± 174 < 0.001
Medication
  RAS inhibitors, n (%) 194 (48) 116 (56) 78 (40) 0.002
  Ca blocker, n (%) 186 (46) 99 (47) 87 (45) 0.646
  Statin, n (%) 147 (37) 86 (41) 61 (32) 0.037
  Fibrate, n (%) 57 (14) 31 (15) 26 (14) 0.697
  Sulfonylurea, n (%) 64 (16) 36 (17) 28 (15) 0.458


↓  Table 2. Clinical Characteristics at Registration of Patients With and Without Cardiovascular Disease Events
 
Characteristics CVD events (-) CVD events (+) P value
N = 312 N = 90
Continuous values are mean ± SD. CVD: cardiovascular disease; BMI: body mass index; VFA: visceral fat area; SFA: subcutaneous fat area; SBP: systolic blood pressure; DBP: diastolic blood pressure; LDL-C: low-density lipoprotein cholesterol; TG: triglyceride; HDL-C: high-density lipoprotein cholesterol; FBG: fasting blood glucose; HOMA-IR: homeostasis model assessment of insulin resistance; Pre-LpL mass: preheparin serum lipoprotein lipase mass; U-8-iso-PGF2α: urinary 8-iso-prostaglandinF2α; RAS: renin-angiotensin system; SD: standard deviation.
Male/female 107/205 40/50 0.131
Age (years) 71 ± 5 73 ± 5 0.003
BMI (kg/m2) 27.7 ± 2.2 27.8 ± 2.3 0.754
VFA (cm2) 129 ± 56 153 ± 52 < 0.001
SFA (cm2) 211 ± 72 207 ± 71 0.647
VFA/SFA 0.7 ± 0.4 0.8 ± 0.5 0.052
Smoker, n (%) 74 (24) 24 (27) 0.675
Hypertension, n (%) 239 (77) 71 (79) 0.65
SBP (mm Hg) 136 ± 15 135 ± 16 0.788
DBP (mm Hg) 86 ± 11 86 ± 12 0.999
Dyslipidemia, n (%) 233 (75) 76 (84) 0.053
Diabetes mellitus, n (%) 88 (28) 50 (56) < 0.001
LDL-C (mg/dL) 128 ± 41 127 ± 35 0.822
TG (mg/dL) 145 ± 61 145 ± 58 0.996
HDL-C (mg/dL) 49 ± 15 50 ± 18 0.487
FBG (mg/dL) 106 ± 23 128 ± 25 < 0.001
HOMA-IR 1.9 ± 1.1 3.4 ± 1.6 < 0.001
Pre-LpL mass (ng/mL) 71 ± 17 59 ± 18 < 0.001
U-8-iso-PGF2α (pg/mg Cr) 310 ± 135 424 ± 89 < 0.001
RAS inhibitors, n (%) 165 (53) 29 (32) < 0.001
Ca blocker, n (%) 149 (48) 37 (41) 0.266
Statin, n (%) 129 (41) 18 (20) < 0.001
Fibrate, n (%) 48 (15) 9 (10) 0.198
Sulfonylurea, n (%) 51 (16) 13 (14) 0.665


↓  Table 3. Multivariate Cox Regression Analysis for Cardiovascular Disease Events
 
Variable HR 95% CI P value
HR: hazard ratio; CI: confidence interval; RAS: renin-angiotensin system; Pre-LpL mass: preheparin serum lipoprotein lipase mass concentration; HOMA-IR: homeostasis model assessment for insulin resistance; U-8-iso-PGF2α: urinary 8-iso-prostaglandinF2α; VFA: visceral fat area.
Use of RAS inhibitors 0.44 0.27 - 0.73 0.001
Group H 2.40 1.37 - 4.24 0.002
Pre-LpL mass (≤ 52 ng/mL) 2.28 1.46 - 3.56 0.003
HOMA-IR (≥ 2.0) 2.16 1.21 - 3.87 0.009
Age (≥ 75years) 1.72 1.12 - 2.64 0.013
Use of Statin 0.47 0.25 - 0.89 0.015
U-8-iso-PGF2α (≥ 310 pg/mg Cr) 1.83 1.11 - 3.02 0.018
Diabetes mellitus 1.32 0.85 - 2.06 0.224
VFA (≥ 130 cm2) 1.29 0.80 - 2.09 0.304