| Journal of Clinical Medicine Research, ISSN 1918-3003 print, 1918-3011 online, Open Access | 
| Article copyright, the authors; Journal compilation copyright, J Clin Med Res and Elmer Press Inc | 
| Journal website https://jocmr.elmerjournals.com | 
Original Article
Volume 17, Number 10, October 2025, pages 565-573
Effectiveness of Short-Acting Oral Antihypertensives in Asymptomatic Markedly Elevated Blood Pressure: An Inverse Probability Treatment Weighted Study
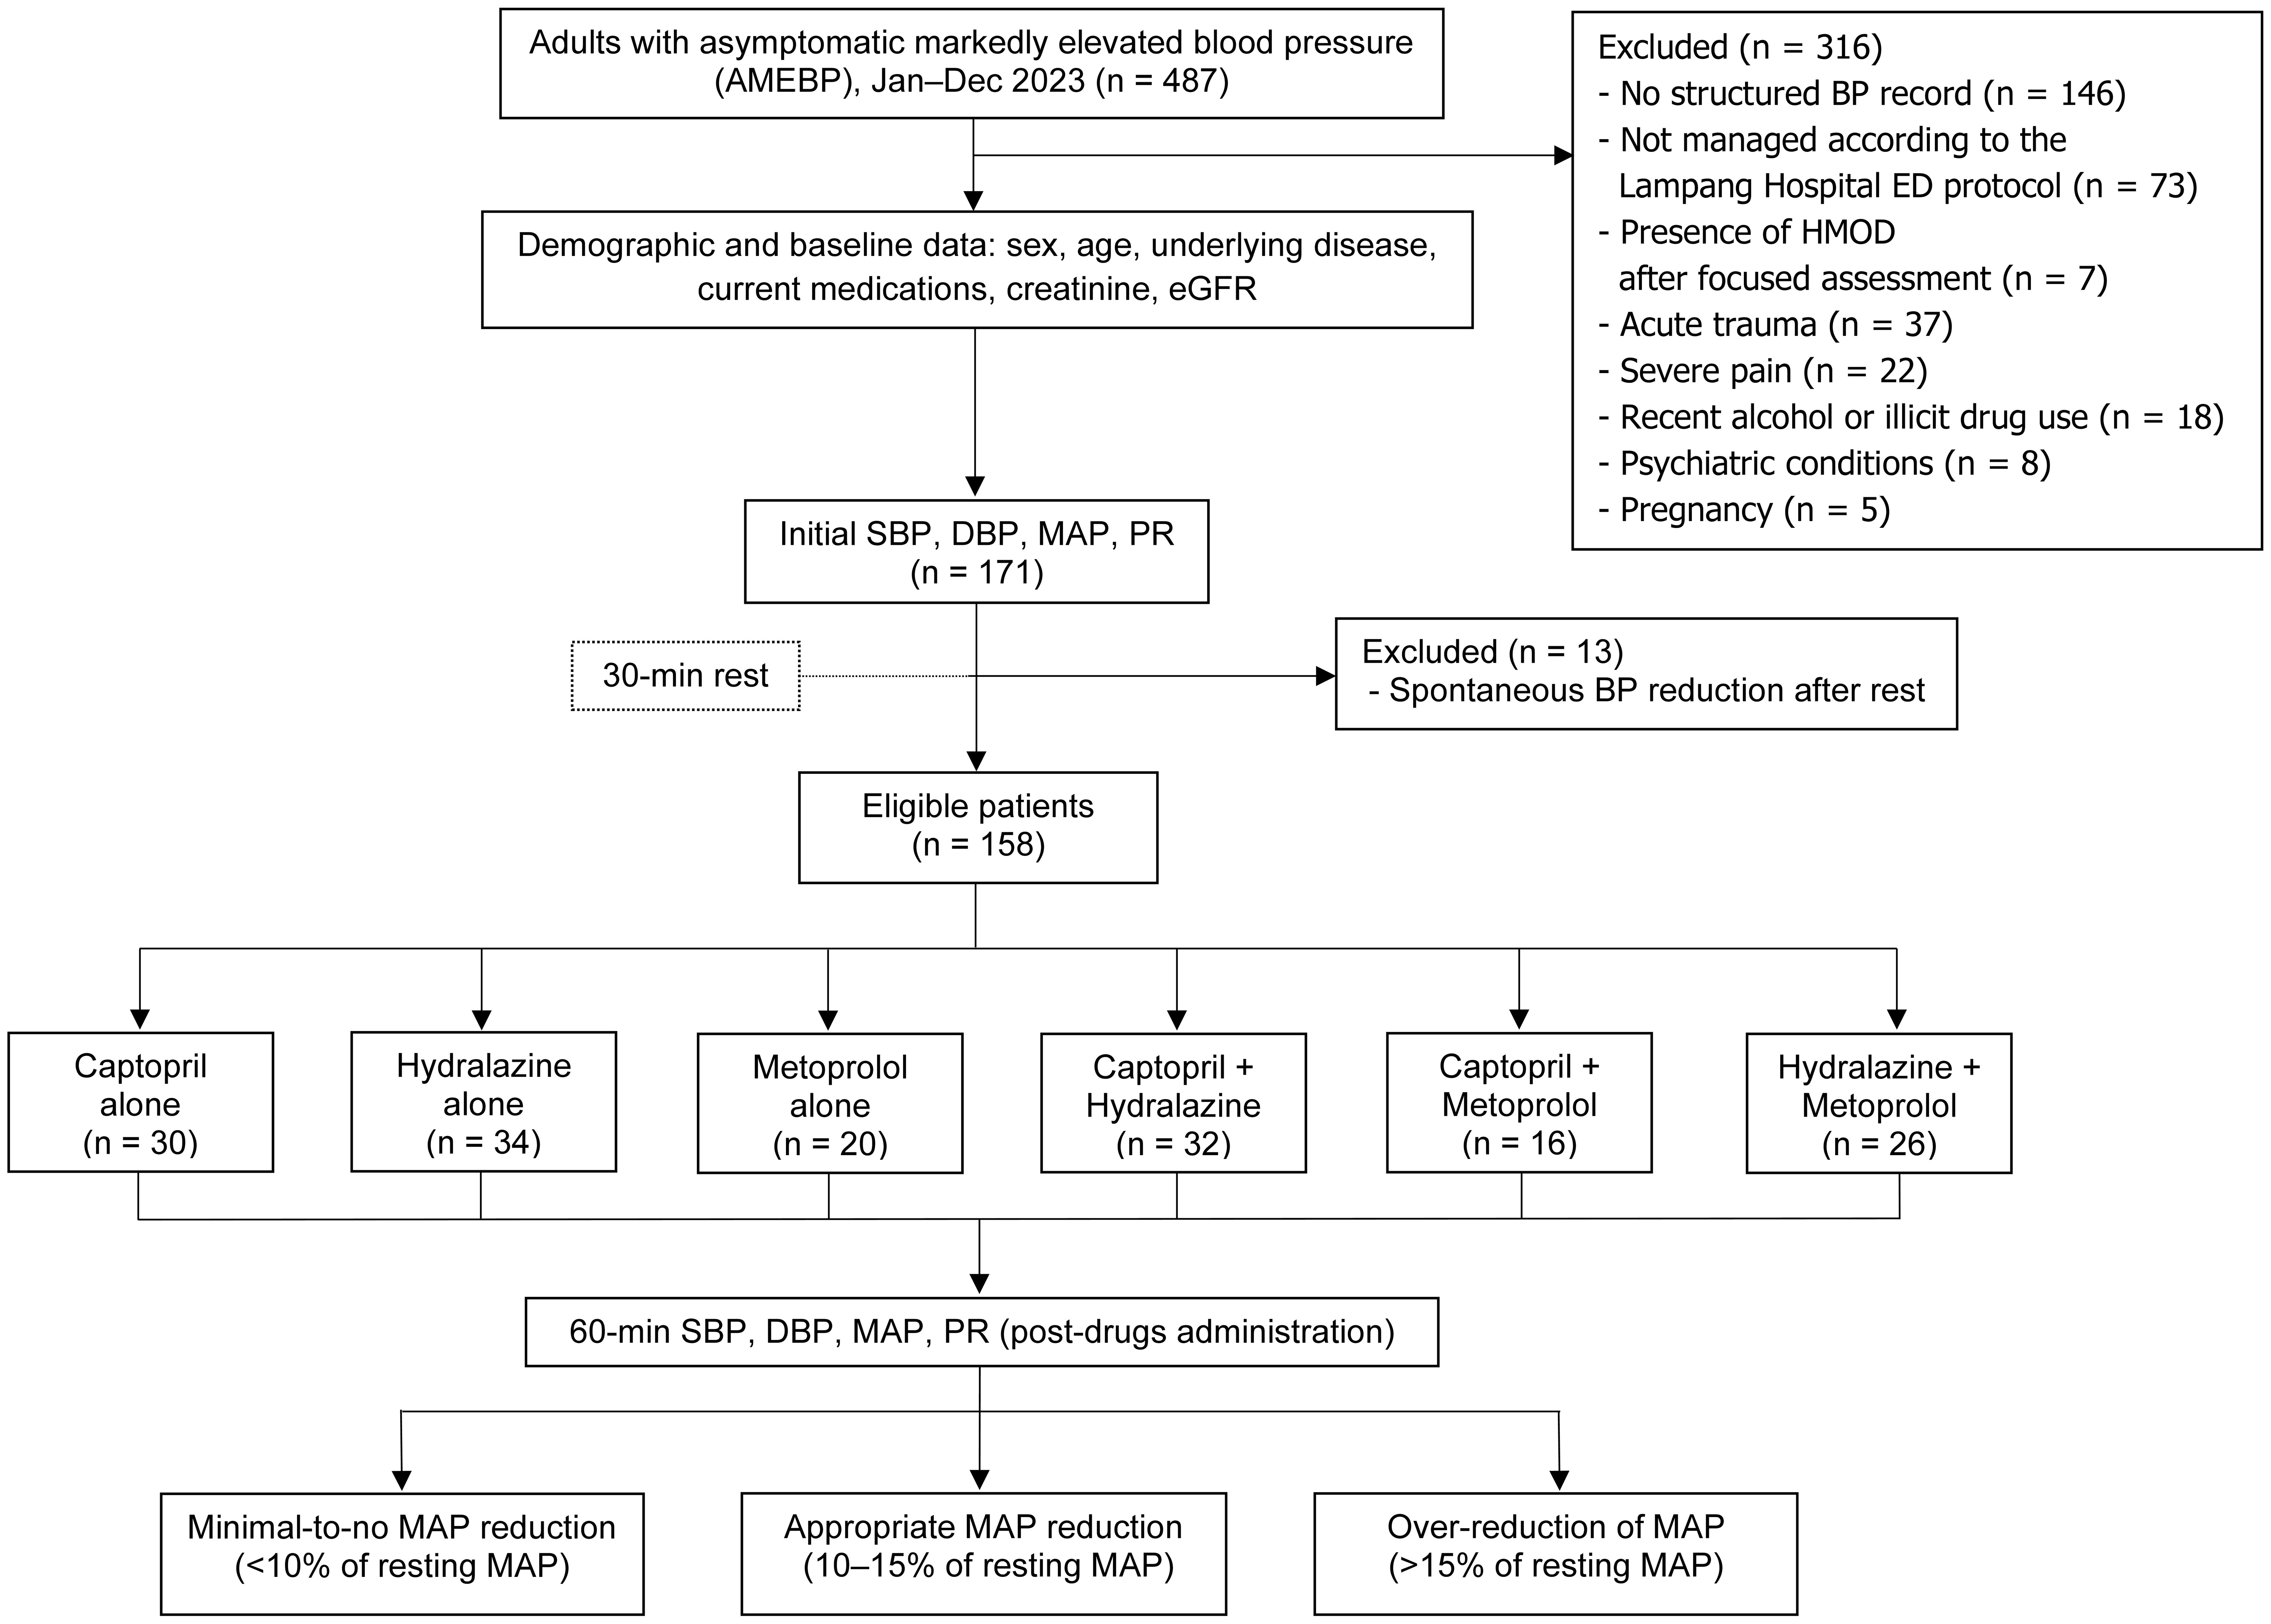
Figure

Tables
| Characteristics | Missing | Captopril (n = 30), n (%) | Hydralazine (n = 34), n (%) | Metoprolol (n = 20), n (%) | Captopril + hydralazine (n = 32), n (%) | Captopril + metoprolol (n = 16), n (%) | Hydralazine + metoprolol (n = 26), n (%) | P value | 
|---|---|---|---|---|---|---|---|---|
| SD: standard deviation; SBP: systolic blood pressure; DBP: diastolic blood pressure; MAP: mean arterial pressure; eGFR: estimated glomerular filtration rate; unit: mL/min/1.73 m2; ACEI: angiotensin-converting enzyme inhibitor; ARB: angiotensin II receptor blocker; CCB: calcium channel blocker. | ||||||||
| Female | 0 | 19 (63.3) | 24 (70.6) | 14 (70.0) | 20 (62.5) | 9 (56.3) | 20 (76.9) | 0.740 | 
| Age (years), mean ± SD | 0 | 60.0 ± 14.9 | 69.7 ± 13.7 | 62.2 ± 21.5 | 56.9 ± 16.1 | 49.9 ± 12.1 | 59.0 ± 18.1 | 0.002 | 
| Pulse rate, mean ± SD | 0 | 81.1 ± 16.7 | 75.1 ± 14.3 | 91.3 ± 14.5 | 76.6 ± 10.4 | 88.9 ± 11.2 | 92.3 ± 11.4 | < 0.001 | 
| Initial SBP (mm Hg), mean ± SD | 0 | 212.1 ± 25.1 | 212.1 ± 19.9 | 210.6 ± 20.6 | 205.9 ± 24.5 | 209.4 ± 20.5 | 201.8 ± 15.4 | 0.424 | 
| Initial DBP (mm Hg), mean ± SD | 0 | 116.5 ± 17.2 | 108.3 ± 19.9 | 105.4 ± 18.5 | 107.8 ± 24.5 | 121.8 ± 13.6 | 114.0 ± 18.1 | 0.060 | 
| Initial MAP (mm Hg), mean ± SD | 0 | 148.3 ± 18.1 | 142.9 ± 17.0 | 140.4 ± 15.2 | 140.5 ± 20.4 | 150.9 ± 11.4 | 143.3 ± 15.8 | 0.232 | 
| Resting SBP (mm Hg), mean ± SD | 0 | 211.3 ± 18.4 | 209.9 ± 20.2 | 211.6 ± 20.0 | 205.9 ± 19.9 | 209.7 ± 23.6 | 201.8 ± 14.6 | 0.418 | 
| Resting DBP (mm Hg), mean ± SD | 0 | 113.0 ± 15.9 | 105.4 ± 19.1 | 106.9 ± 22.9 | 104.8 ± 19.2 | 120.8 ± 20.6 | 111.9 ± 16.6 | 0.055 | 
| Resting MAP (mm Hg), mean ± SD | 0 | 145.8 ± 14.9 | 140.2 ± 16.9 | 141.8 ± 17.7 | 138.5 ± 16.4 | 150.4 ± 17.4 | 141.9 ± 13.3 | 0.174 | 
| eGFR (unit), mean ± SD | 12 | 89.0 ± 22.9 | 64.3 ± 32.3 | 75.0 ± 33.9 | 80.0 ± 28.1 | 104.9 ± 14.9 | 77.1 ± 38.3 | 0.001 | 
| Underlying diseases | ||||||||
| Diabetes mellitus | 0 | 4 (13.3) | 5 (14.7) | 6 (30.0) | 7 (21.9) | 1 (6.3) | 2 (7.7) | 0.311 | 
| Hypertension | 0 | 23 (76.7) | 17 (50.0) | 10 (50.0) | 16 (50.0) | 7 (43.8) | 11 (42.3) | 0.107 | 
| Dyslipidemia | 0 | 11 (36.7) | 8 (23.5) | 6 (30.0) | 7 (21.9) | 3 (18.8) | 6 (23.1) | 0.750 | 
| Chronic kidney disease | 0 | 1 (3.3) | 6 (17.7) | 4 (20.0) | 2 (6.3) | 0 (0) | 4 (15.4) | 0.129 | 
| Cardiovascular diseases | 0 | 4 (13.3) | 4 (11.8) | 3 (15.0) | 3 (9.4) | 1 (6.3) | 3 (11.5) | 0.977 | 
| Current antihypertensives | ||||||||
| ACEI or ARB | 0 | 11 (36.7) | 5 (14.7) | 4 (20.0) | 6 (18.8) | 4 (25.0) | 5 (19.2) | 0.427 | 
| CCB | 0 | 14 (46.7) | 16 (47.1) | 9 (45.0) | 8 (25.0) | 6 (37.5) | 7 (26.9) | 0.283 | 
| Beta-blocker | 0 | 8 (26.7) | 5 (14.7) | 2 (10.0) | 2 (6.3) | 2 (12.5) | 4 (15.4) | 0.379 | 
| Diuretic | 0 | 1 (3.3) | 5 (14.7) | 2 (10.0) | 0 (0) | 1 (6.3) | 2 (7.7) | 0.208 | 
| Vasodilator | 0 | 2 (6.7) | 5 (14.7) | 2 (10.0) | 1 (3.1) | 1 (6.3) | 3 (11.5) | 0.662 | 
| Antihypertensive regimens | Percent MAP reduction, median (P25, P75) | 
|---|---|
| Captopril alone (n = 30) | -11.55 (-14.14, -5.64) | 
| Hydralazine alone (n = 34) | -11.86 (-16.57, -6.62) | 
| Metoprolol alone (n = 20) | -2.79 (-13.03, 2.04) | 
| Captopril + hydralazine (n = 32) | -13.64 (-20.88, -10.74) | 
| Captopril + metoprolol (n = 16) | -8.86 (-23.41, 1.86) | 
| Hydralazine + metoprolol (n = 26) | -11.96 (-18.09, -3.08) | 
| Antihypertensive regimens | Adjusted mOR for MAP reduction | 95% CI | P value | 
|---|---|---|---|
| A multinomial logistic regression model was used, adjusted for confounding by indication and contraindication through IPTW. The minimal-to-no reduction group (< 10% MAP reduction) served as the reference category. mOR: multinomial odds ratio; MAP: mean arterial pressure; CI: confidence interval; IPTW: inverse probability of treatment weighting. | |||
| Reference group (< 10% MAP reduction) | |||
| Appropriate MAP reduction (10-15% of resting MAP) | |||
| Captopril alone | 2.91 | 0.96, 8.76 | 0.058 | 
| Hydralazine alone | 2.76 | 0.84, 9.11 | 0.096 | 
| Metoprolol alone | 0.09 | 0.02, 0.42 | 0.002 | 
| Captopril + hydralazine | 1.99 | 0.65, 6.05 | 0.225 | 
| Captopril + metoprolol | 0.54 | 0.11, 2.64 | 0.446 | 
| Hydralazine + metoprolol | 0.68 | 0.23, 1.98 | 0.477 | 
| Over-reduction (> 15% of resting MAP) | |||
| Captopril alone | 0.93 | 0.28, 3.12 | 0.903 | 
| Hydralazine alone | 2.16 | 0.65, 7.19 | 0.209 | 
| Metoprolol alone | 0.20 | 0.06, 0.68 | 0.010 | 
| Captopril + hydralazine | 3.04 | 1.02, 9.00 | 0.045 | 
| Captopril + metoprolol | 0.86 | 0.31, 2.38 | 0.778 | 
| Hydralazine + metoprolol | 1.69 | 0.48, 5.93 | 0.416 | 
| Adverse events | Captopril (n = 30), n (%) | Hydralazine (n = 34), n (%) | Metoprolol (n = 20), n (%) | Captopril + hydralazine (n = 32), n (%) | Captopril + metoprolol (n = 16), n (%) | Hydralazine + metoprolol (n = 26), n (%) | P value | 
|---|---|---|---|---|---|---|---|
| NA: not applicable; no events occurred across groups. | |||||||
| Hypotension | 0 | 0 | 0 | 0 | 0 | 0 | NA | 
| Bradycardia | 0 | 0 | 0 | 0 | 0 | 0 | NA | 
| Chest pain | 0 | 0 | 0 | 0 | 0 | 0 | NA | 
| Fainting/syncope | 0 | 0 | 0 | 0 | 0 | 0 | NA | 
| Dizziness | 0 | 0 | 0 | 0 | 0 | 0 | NA | 
| Drug allergy | 0 | 0 | 0 | 0 | 0 | 0 | NA |