Journal of Clinical Medicine Research, ISSN 1918-3003 print, 1918-3011 online, Open Access
Article copyright, the authors; Journal compilation copyright, J Clin Med Res and Elmer Press Inc
Journal website https://jocmr.elmerjournals.com

Case Report

Volume 17, Number 12, December 2025, pages 733-739


Bilateral Adrenalectomy for Primary Bilateral Macronodular Adrenocortical Hyperplasia With a Novel ARMC5 Mutation Site

Figures

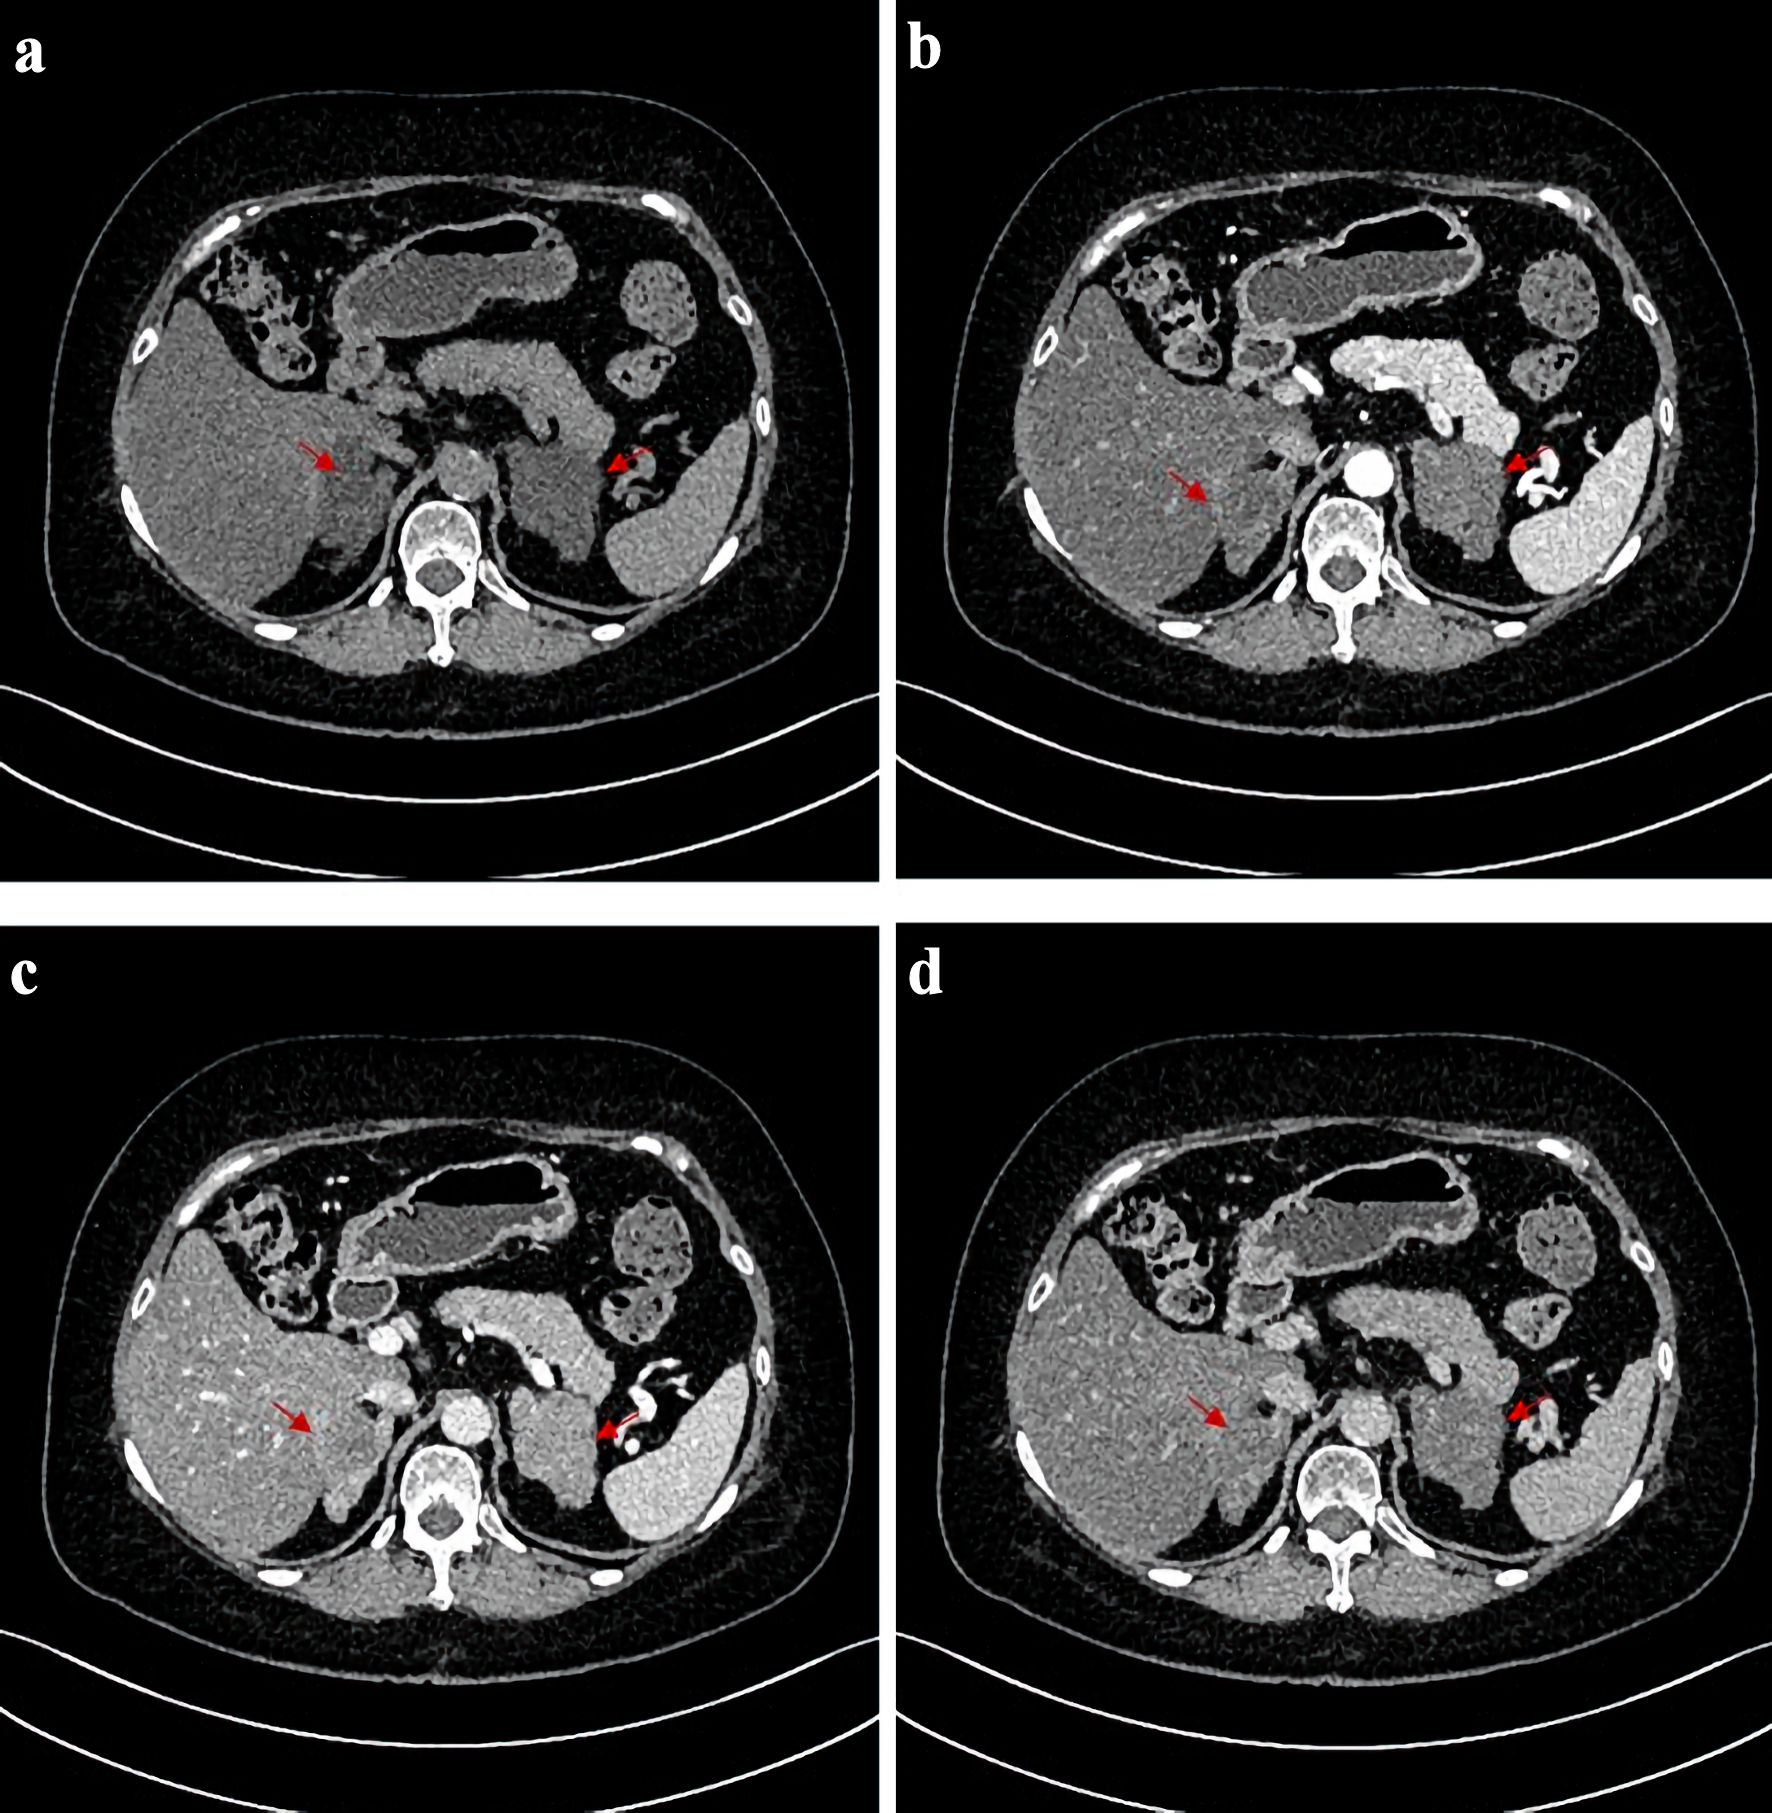
↓  Figure 1. CT scans before operation. CT images of the patient before adrenalectomy. (a) Image of plain CT scan. (b) Image of arterial phase of contrast-enhanced CT. (c) Image of venous phase of contrast-enhanced CT. (d) Image of delayed phase of contrast-enhanced CT. The red arrows point to the position corresponding to bilateral adrenal nodules on both sides. CT: computed tomography.
Figure 1.
↓  Figure 2. Representative gross and microscopic images of the adrenalectomy specimen. (a, b) Gross images showing a large adrenal nodule with appearance resembling a piece of ginger. (c, d) Corresponding microscopic images (× 10).
Figure 2.

Tables

↓  Table 1. The Main Laboratory and Hormone Expression Profile
 
Time Baseline One week after right adrenalectomy Six months after right adrenalectomy One month after left adrenalectomy
ACTH: adrenocorticotropic hormone; HbA1c: glycated hemoglobin.
Serum cortisol 8 am (μg/dL) 27.29 14.4 13.3 0.9
Serum cortisol 4 pm (μg/dL) 29.56
Serum cortisol 0 am (μg/dL) 23.65
Serum ACTH 8 am (pg/mL) 1.25 < 1 < 1.5 6.0
Serum ACTH 4 pm (pg/mL) < 1
Serum ACTH 0 am (pg/mL) 1.3
Urinary cortisol (µg/24 h) 866 748.8 555.8 29.7
HbA1c (%) 9.1 5.7% 6.1%
Fasting blood glucose (mmol/L) 9.84 6.71 5.72
Serum potassium (mmol/L) 3.05 4.36 3.96


↓  Table 2. The Results of LD-DST and HD-DST
 
LD-DST HD-DST
ACTH: adrenocorticotropic hormone; LD-DST: low-dose dexamethasone suppression test; HD-DST: high-dose dexamethasone suppression test.
Serum cortisol baseline (µg/dL) 27.29 27.29
Serum ACTH baseline (pg/mL) 1.25 1.25
Urinary cortisol baseline (µg/24 h) 866 866
Serum cortisol day 2 (µg/dL) 29.4 38.84
Serum ACTH day 2 (pg/mL) < 1.0 < 1.00
Urinary cortisol day 2 (µg/24 h) 3,621.0 3,503.1
Serum cortisol day 3 (µg/dL) 33.67 34.79
Serum ACTH day 3 (pg/mL) < 1.0 < 1.00
Urinary cortisol day 3 (µg/24 h) 2,731.1 4,623.7


↓  Table 3. Biochemical Results of AVS
 
Inferior vena cava Left adrenal Right adrenal SI left SI right LI L/R ratio LI R/L ratio
SI = cortisol or aldosterone (right or left adrenal)/cortisol or aldosterone (inferior vena cava); LI = cortisol or aldosterone (one side)/cortisol or aldosterone (another side). L/R: left/right; R/L: right/left; AVS: adrenal venous sampling.
Cortisol (µg/dL) 23.71 104.4 79.45 4.4 3.35 2.65 0.38
Aldosterone (pg/mL) 138.81 576.71 1,163.29 4.15 8.38