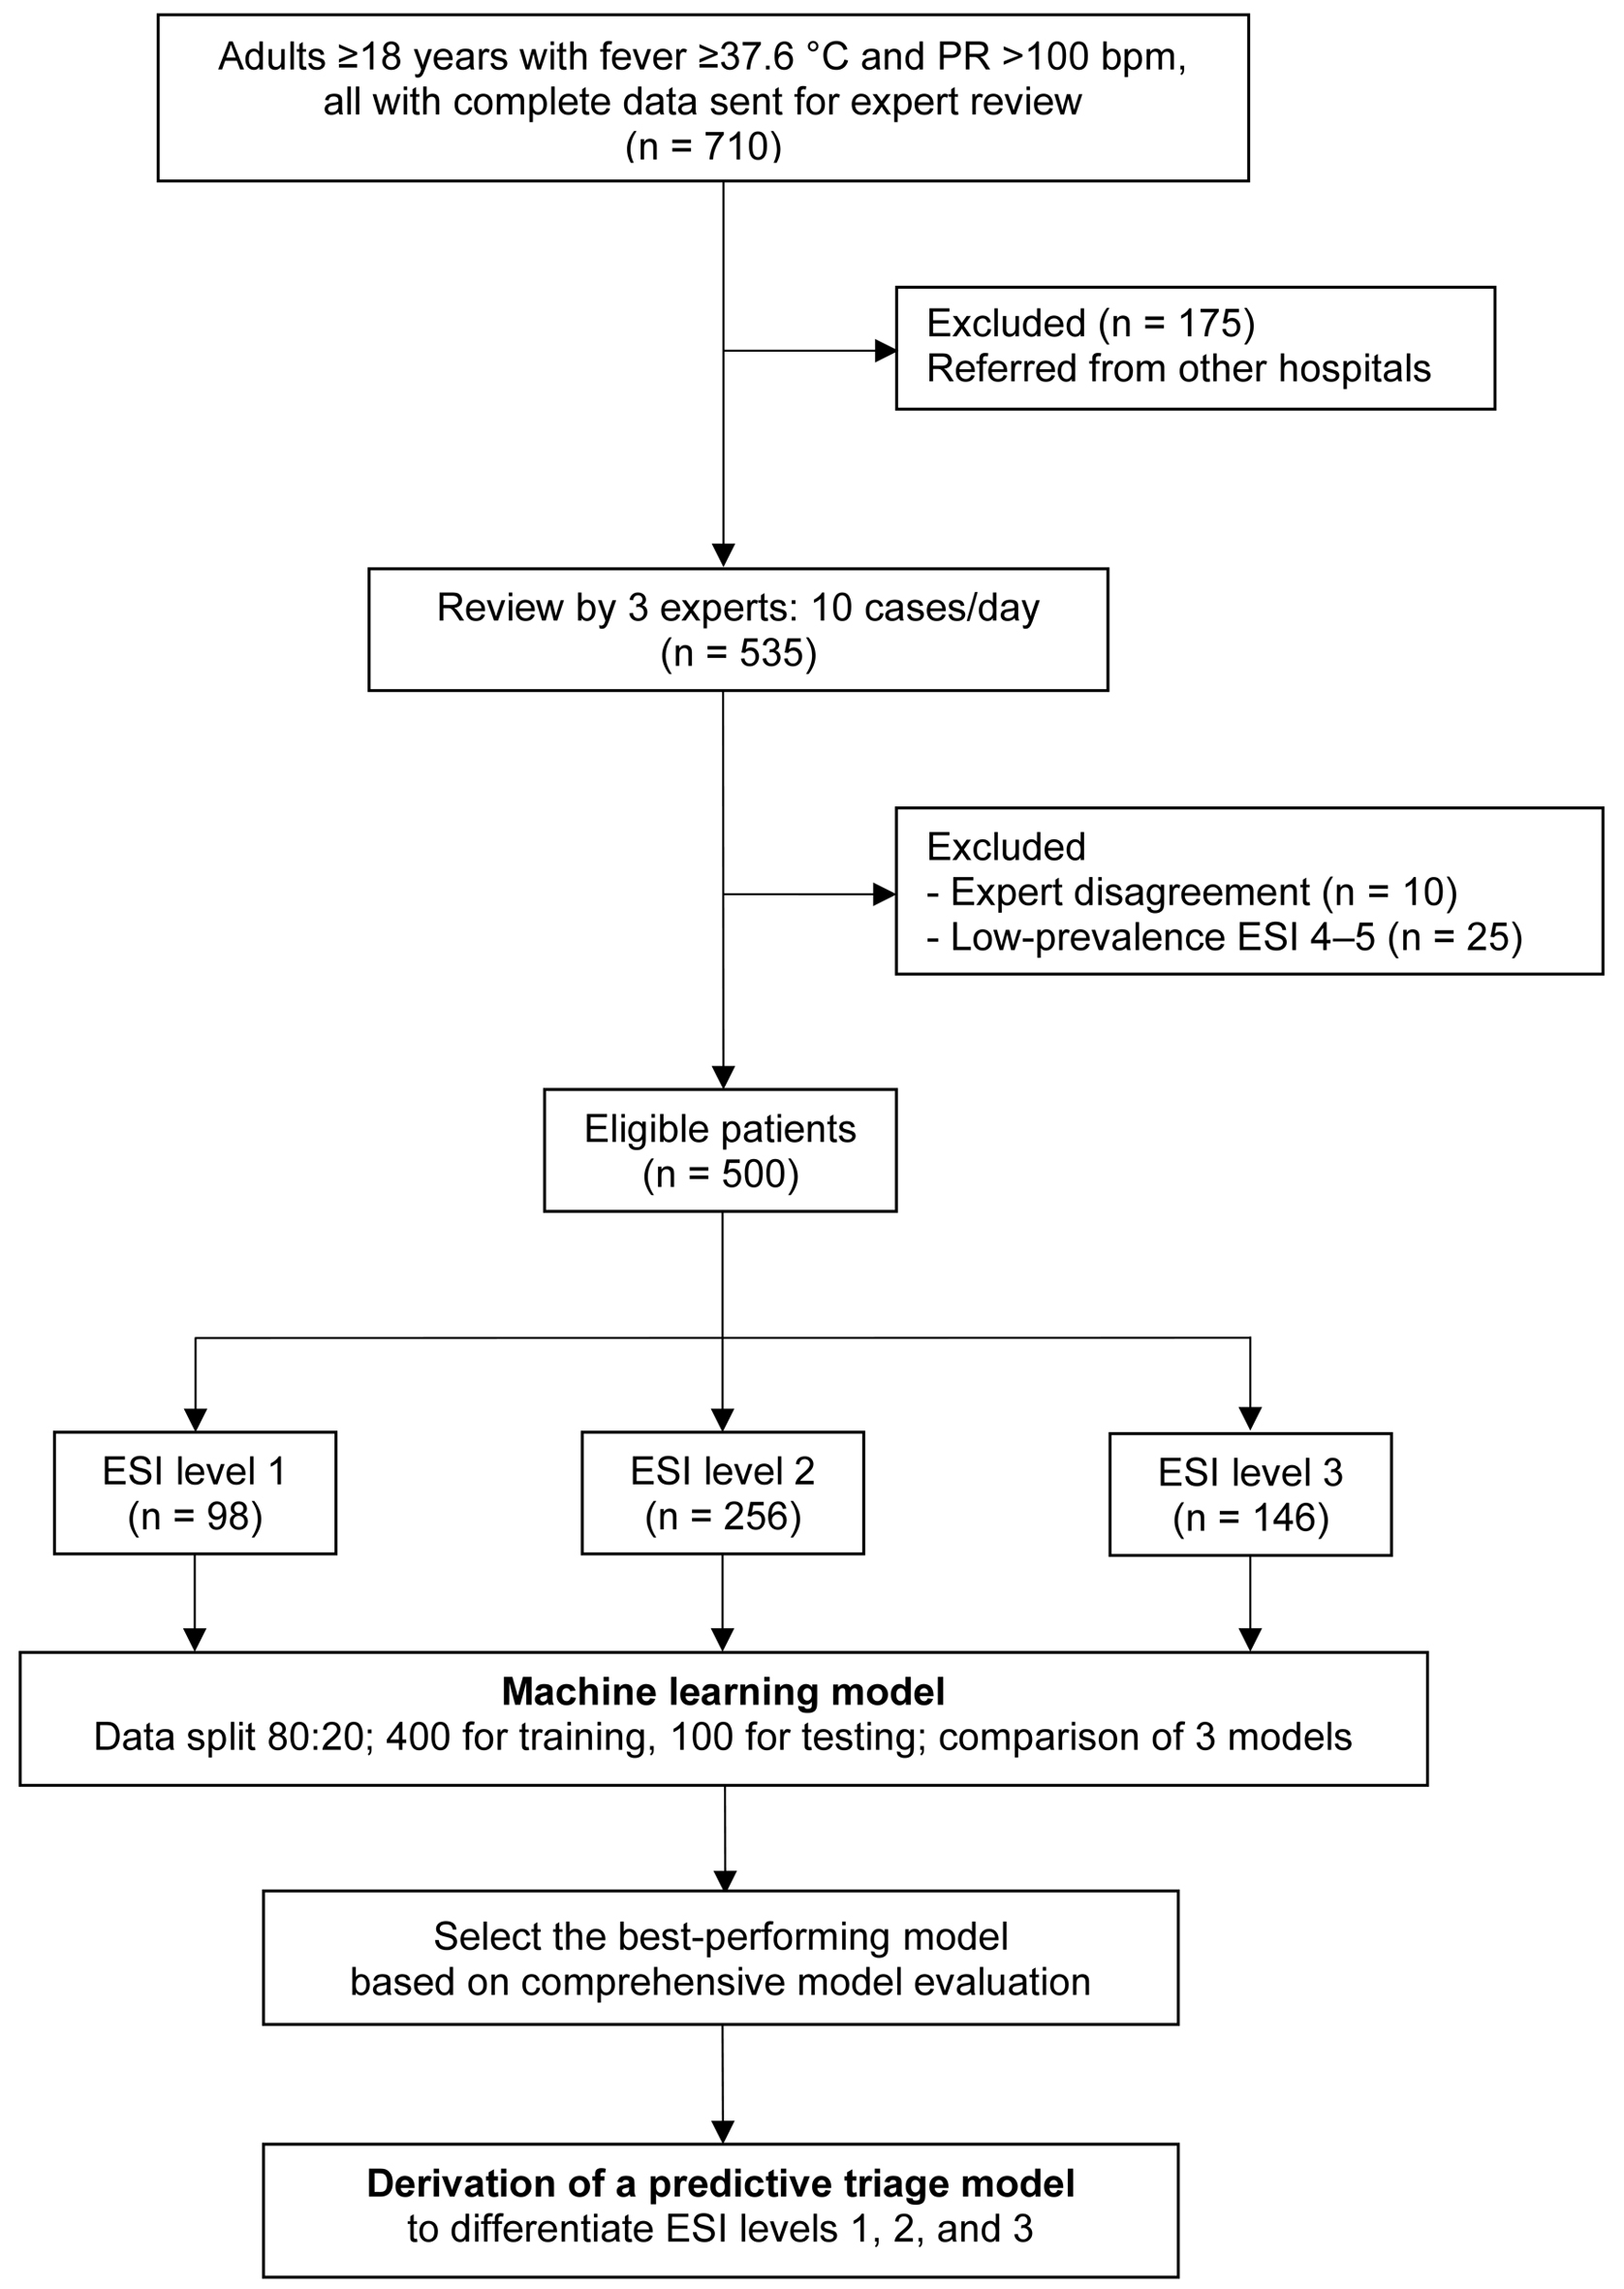
↓ Figure 1. Study flow diagram. bpm: beats per
minute; ESI: Emergency Severity Index; PR: pulse rate.
| Journal of Clinical Medicine Research, ISSN 1918-3003 print, 1918-3011 online, Open Access |
| Article copyright, the authors; Journal compilation copyright, J Clin Med Res and Elmer Press Inc |
| Journal website https://jocmr.elmerjournals.com |
Original Article
Volume 17, Number 12, December 2025, pages 676-687
Machine Learning-Based Model to Classify Emergency Severity Index Levels 1-3 in Febrile Patients With Tachycardia: Thailand Triage Prediction System
Figures
Tables
| Baseline characteristics | Missing | Level 1 (n = 98), n (%) | Level 2 (n = 256), n (%) | Level 3 (n = 146), n (%) | P value |
|---|---|---|---|---|---|
| bpm: beats per minute; ESI: Emergency Severity Index; DBP: diastolic blood pressure; GCS: Glasgow Coma Scale; IQR: interquartile range; MAP: mean arterial pressure; RR: respiratory rate; SBP: systolic blood pressure; SD: standard deviation; SpO2: peripheral capillary oxygen saturation. | |||||
| Male | 0 | 61 (62.2) | 122 (47.7) | 74 (50.7) | 0.046 |
| Age (years), mean ± SD | 0 | 65.1 ± 17.3 | 54.0 ± 21.9 | 37.7 ± 16.2 | < 0.001 |
| Vital signs | |||||
| Temperature (°C), mean ± SD | 0 | 38.7 ± 0.8 | 38.7 ± 0.8 | 38.6 ± 0.7 | 0.111 |
| Pulse rate (bpm), mean ± SD | 0 | 129.3 ± 21.3 | 118.1 ± 10.5 | 110.6 ± 6.1 | < 0.001 |
| SBP (mm Hg), mean ± SD | 0 | 119.2 ± 35.1 | 132.6 ± 24.8 | 126.1 ± 18.5 | < 0.001 |
| DBP (mm Hg), mean ± SD | 0 | 70.6 ± 23.8 | 78.4 ± 15.8 | 78.2 ± 13.3 | < 0.001 |
| MAP (mm Hg), mean ± SD | 0 | 86.7 ± 26.5 | 96.4 ± 17.3 | 94.1 ± 13.9 | < 0.001 |
| RR (breaths/min), mean ± SD | 0 | 29.2 ± 7.8 | 21.4 ± 3.2 | 19.6 ± 1.3 | < 0.001 |
| SpO2 (%), mean ± SD | 0 | 93.4 ± 8.3 | 96.6 ± 2.5 | 96.9 ± 1.7 | < 0.001 |
| GCS, median (IQR) | 0 | 15 (14, 15) | 15 (15, 15) | 15 (15, 15) | < 0.001 |
| Pain scale, median (IQR) | 0 | 0 (0, 0) | 0 (0, 0) | 0 (0, 4) | < 0.001 |
| Chief complaints | |||||
| Dyspnea | 0 | 44 (44.9) | 41 (16.0) | 4 (2.7) | < 0.001 |
| Chest pain/palpitation/syncope | 0 | 8 (8.2) | 21 (8.2) | 4 (2.7) | 0.065 |
| Cough | 0 | 3 (3.1) | 19 (7.4) | 25 (17.1) | < 0.001 |
| Alteration of consciousness | 0 | 6 (6.1) | 10 (3.9) | 0 (0) | 0.005 |
| Seizure | 0 | 1 (1.0) | 3 (1.2) | 0 (0) | 0.527 |
| Abdominal/pelvic pain | 0 | 7 (7.1) | 35 (13.7) | 24 (16.4) | 0.099 |
| Vomiting/diarrhea | 0 | 3 (3.1) | 15 (5.9) | 14 (9.6) | 0.128 |
| Genitourinary | 0 | 2 (2.0) | 10 (3.9) | 7 (4.8) | 0.550 |
| Headache | 0 | 2 (2.0) | 8 (3.1) | 14 (9.6) | 0.010 |
| Dizziness | 0 | 0 (0) | 7 (2.7) | 11 (7.5) | 0.005 |
| Fatigue/poor intake | 0 | 4 (4.1) | 33 (12.9) | 3 (2.1) | < 0.001 |
| Back pain | 0 | 0 (0) | 3 (1.2) | 2 (1.4) | 0.712 |
| Musculoskeletal | 0 | 6 (6.1) | 22 (8.6) | 27 (18.5) | 0.003 |
| Comorbidities | |||||
| Diabetic mellitus | 0 | 21 (21.4) | 64 (25.0) | 12 (8.2) | < 0.001 |
| Essential hypertension | 0 | 39 (39.8) | 99 (38.7) | 22 (15.1) | < 0.001 |
| Dyslipidemia | 0 | 28 (28.6) | 72 (28.1) | 13 (8.9) | < 0.001 |
| Chronic kidney disease | 0 | 9 (9.2) | 20 (7.8) | 3 (2.1) | 0.022 |
| Cardiovascular disease | 0 | 12 (12.2) | 12 (4.7) | 1 (0.7) | < 0.001 |
| Respiratory disease | 0 | 12 (12.2) | 13 (5.1) | 3 (2.1) | 0.004 |
| Neurovascular disease | 0 | 11 (11.2) | 23 (9.0) | 3 (2.1) | 0.004 |
| Autoimmune disease | 0 | 1 (1.0) | 4 (1.6) | 0 (0) | 0.409 |
| Hematologic disease | 0 | 9 (9.2) | 9 (3.5) | 4 (2.7) | 0.049 |
| Malignancy | 0 | 12 (12.2) | 25 (9.8) | 6 (4.1) | 0.042 |
| Current medications | |||||
| Beta-blocker | 0 | 11 (11.2) | 19 (7.4) | 3 (2.1) | 0.008 |
| Immunosuppressants | 0 | 7 (7.1) | 17 (6.6) | 1 (0.7) | 0.006 |
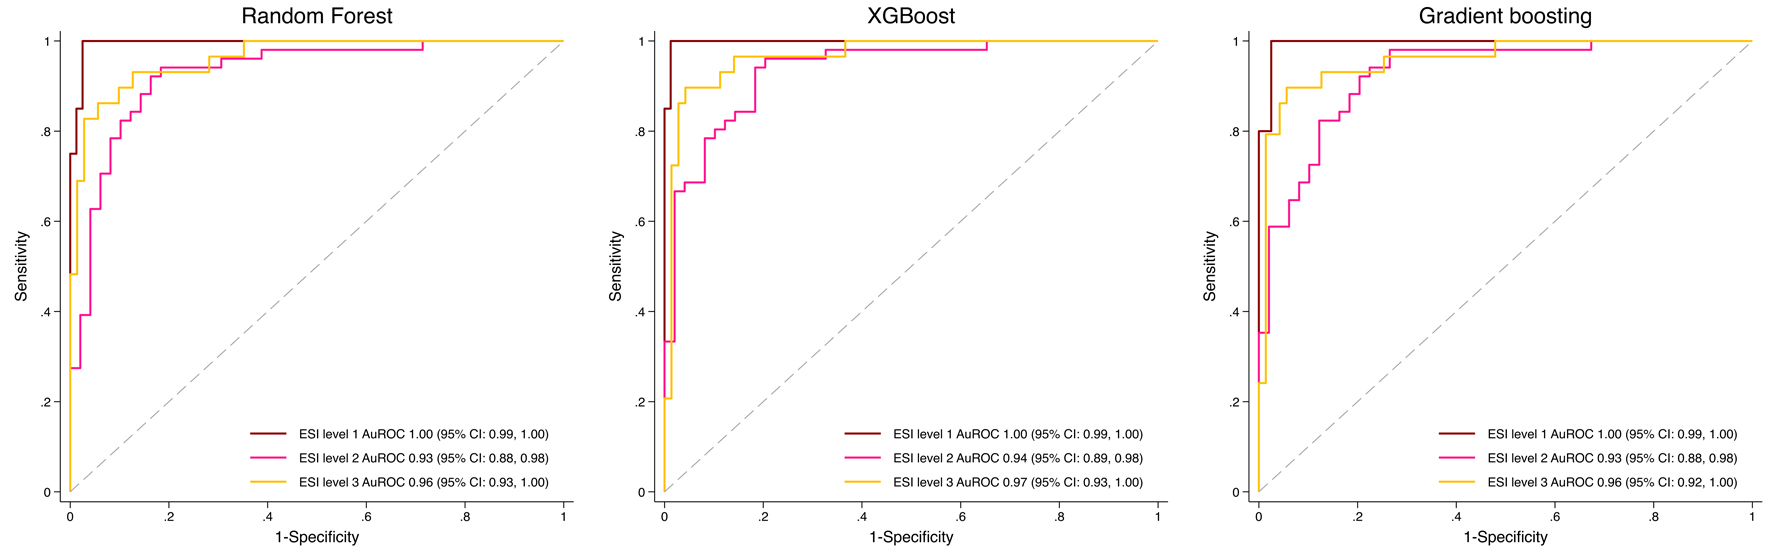
| Models | AuROC | 95% CI | Accuracy | Recall | Precision | F1 score |
|---|---|---|---|---|---|---|
| AuROC: area under the receiver operating characteristic curve; CI: confidence interval; ESI: Emergency Severity Index; F1 score: harmonic mean of precision and recall; XGBoost: Extreme Gradient Boosting. | ||||||
| Random forest | ||||||
| ESI level 1 | 1.00 | 0.99, 1.00 | 1.00 | 0.70 | 1.00 | 0.82 |
| ESI level 2 | 0.93 | 0.88, 0.98 | 0.82 | 0.92 | 0.82 | 0.87 |
| ESI level 3 | 0.96 | 0.93, 1.00 | 0.86 | 0.86 | 0.86 | 0.86 |
| XGBoost | ||||||
| ESI level 1 | 1.00 | 0.99, 1.00 | 1.00 | 0.70 | 1.00 | 0.82 |
| ESI level 2 | 0.94 | 0.89, 0.98 | 0.83 | 0.88 | 0.83 | 0.86 |
| ESI level 3 | 0.97 | 0.93, 1.00 | 0.81 | 0.90 | 0.81 | 0.85 |
| Gradient boosting machine | ||||||
| ESI level 1 | 1.00 | 0.99, 1.00 | 1.00 | 0.70 | 1.00 | 0.82 |
| ESI level 2 | 0.93 | 0.88, 0.98 | 0.83 | 0.86 | 0.83 | 0.85 |
| ESI level 3 | 0.96 | 0.92, 1.00 | 0.79 | 0.90 | 0.79 | 0.84 |
| Predicted ESI (n, %) | Observed ESI (n, %) | Total | ||
|---|---|---|---|---|
| 1 | 2 | 3 | ||
| Observed ESI: Emergency Severity Index level assigned by triage nurses; Predicted ESI: Emergency Severity Index level assigned by the random forest model. | ||||
| 1 | 14 (14.0) | 6 (6.0) | 0 (0) | 20 (20.0) |
| 2 | 0 (0) | 47 (47.0) | 4 (4.0) | 51 (51.0) |
| 3 | 0 (0) | 4 (4.0) | 25 (25.0) | 29 (29.0) |
| Total | 14 (14.0) | 57 (57.0) | 29 (29.0) | 100 (100) |
| Predicted ESI (n, %) | Observed ESI (n, %) | Total | ||
|---|---|---|---|---|
| 1 | 2 | 3 | ||
| Observed ESI: Emergency Severity Index level assigned by triage nurses; Predicted ESI: Emergency Severity Index level assigned by the extreme gradient boosting model. | ||||
| 1 | 14 (14.0) | 6 (6.0) | 0 (0) | 20 (20.0) |
| 2 | 0 (0) | 45 (45.0) | 6 (6.0) | 51 (51.0) |
| 3 | 0 (0) | 3 (3.0) | 26 (26.0) | 29 (29.0) |
| Total | 14 (14.0) | 54 (54.0) | 32 (32.0) | 100 (100) |
| Predicted ESI (n, %) | Observed ESI (n, %) | Total | ||
|---|---|---|---|---|
| 1 | 2 | 3 | ||
| Observed ESI: Emergency Severity Index level assigned by triage nurses; Predicted ESI: Emergency Severity Index level assigned by gradient boosting machine model. | ||||
| 1 | 14 (14.0) | 6 (6.0) | 0 (0) | 20 (20.0) |
| 2 | 0 (0) | 44 (44.0) | 7 (7.0) | 51 (51.0) |
| 3 | 0 (0) | 3 (3.0) | 26 (26.0) | 29 (29.0) |
| Total | 14 (14.0) | 53 (53.0) | 33 (33.0) | 100 (100) |
| Model | Under-triage (two steps) (n, %) | Under-triage (one step) (n, %) | Over-triage (two steps) (n, %) | Over-triage (one step) (n, %) | Mean penalty |
|---|---|---|---|---|---|
| Under-triage (two steps): predicted ESI two levels lower than observed (e.g., observed level 1 predicted as level 3); Under-triage (one step): predicted one level lower (e.g., observed level 2 predicted as level 3); Over-triage (two steps): predicted two levels higher (e.g., observed level 3 predicted as level 1); Over-triage (one step): predicted one level higher (e.g., observed level 2 predicted as level 1); XGBoost: extreme gradient boosting. | |||||
| Random forest | 0 (0) | 4 (4.0) | 0 (0) | 10 (10.0) | 0.22 |
| XGBoost | 0 (0) | 3 (3.0) | 0 (0) | 12 (12.0) | 0.21 |
| Gradient boosting machine | 0 (0) | 3 (3.0) | 0 (0) | 13 (13.0) | 0.22 |