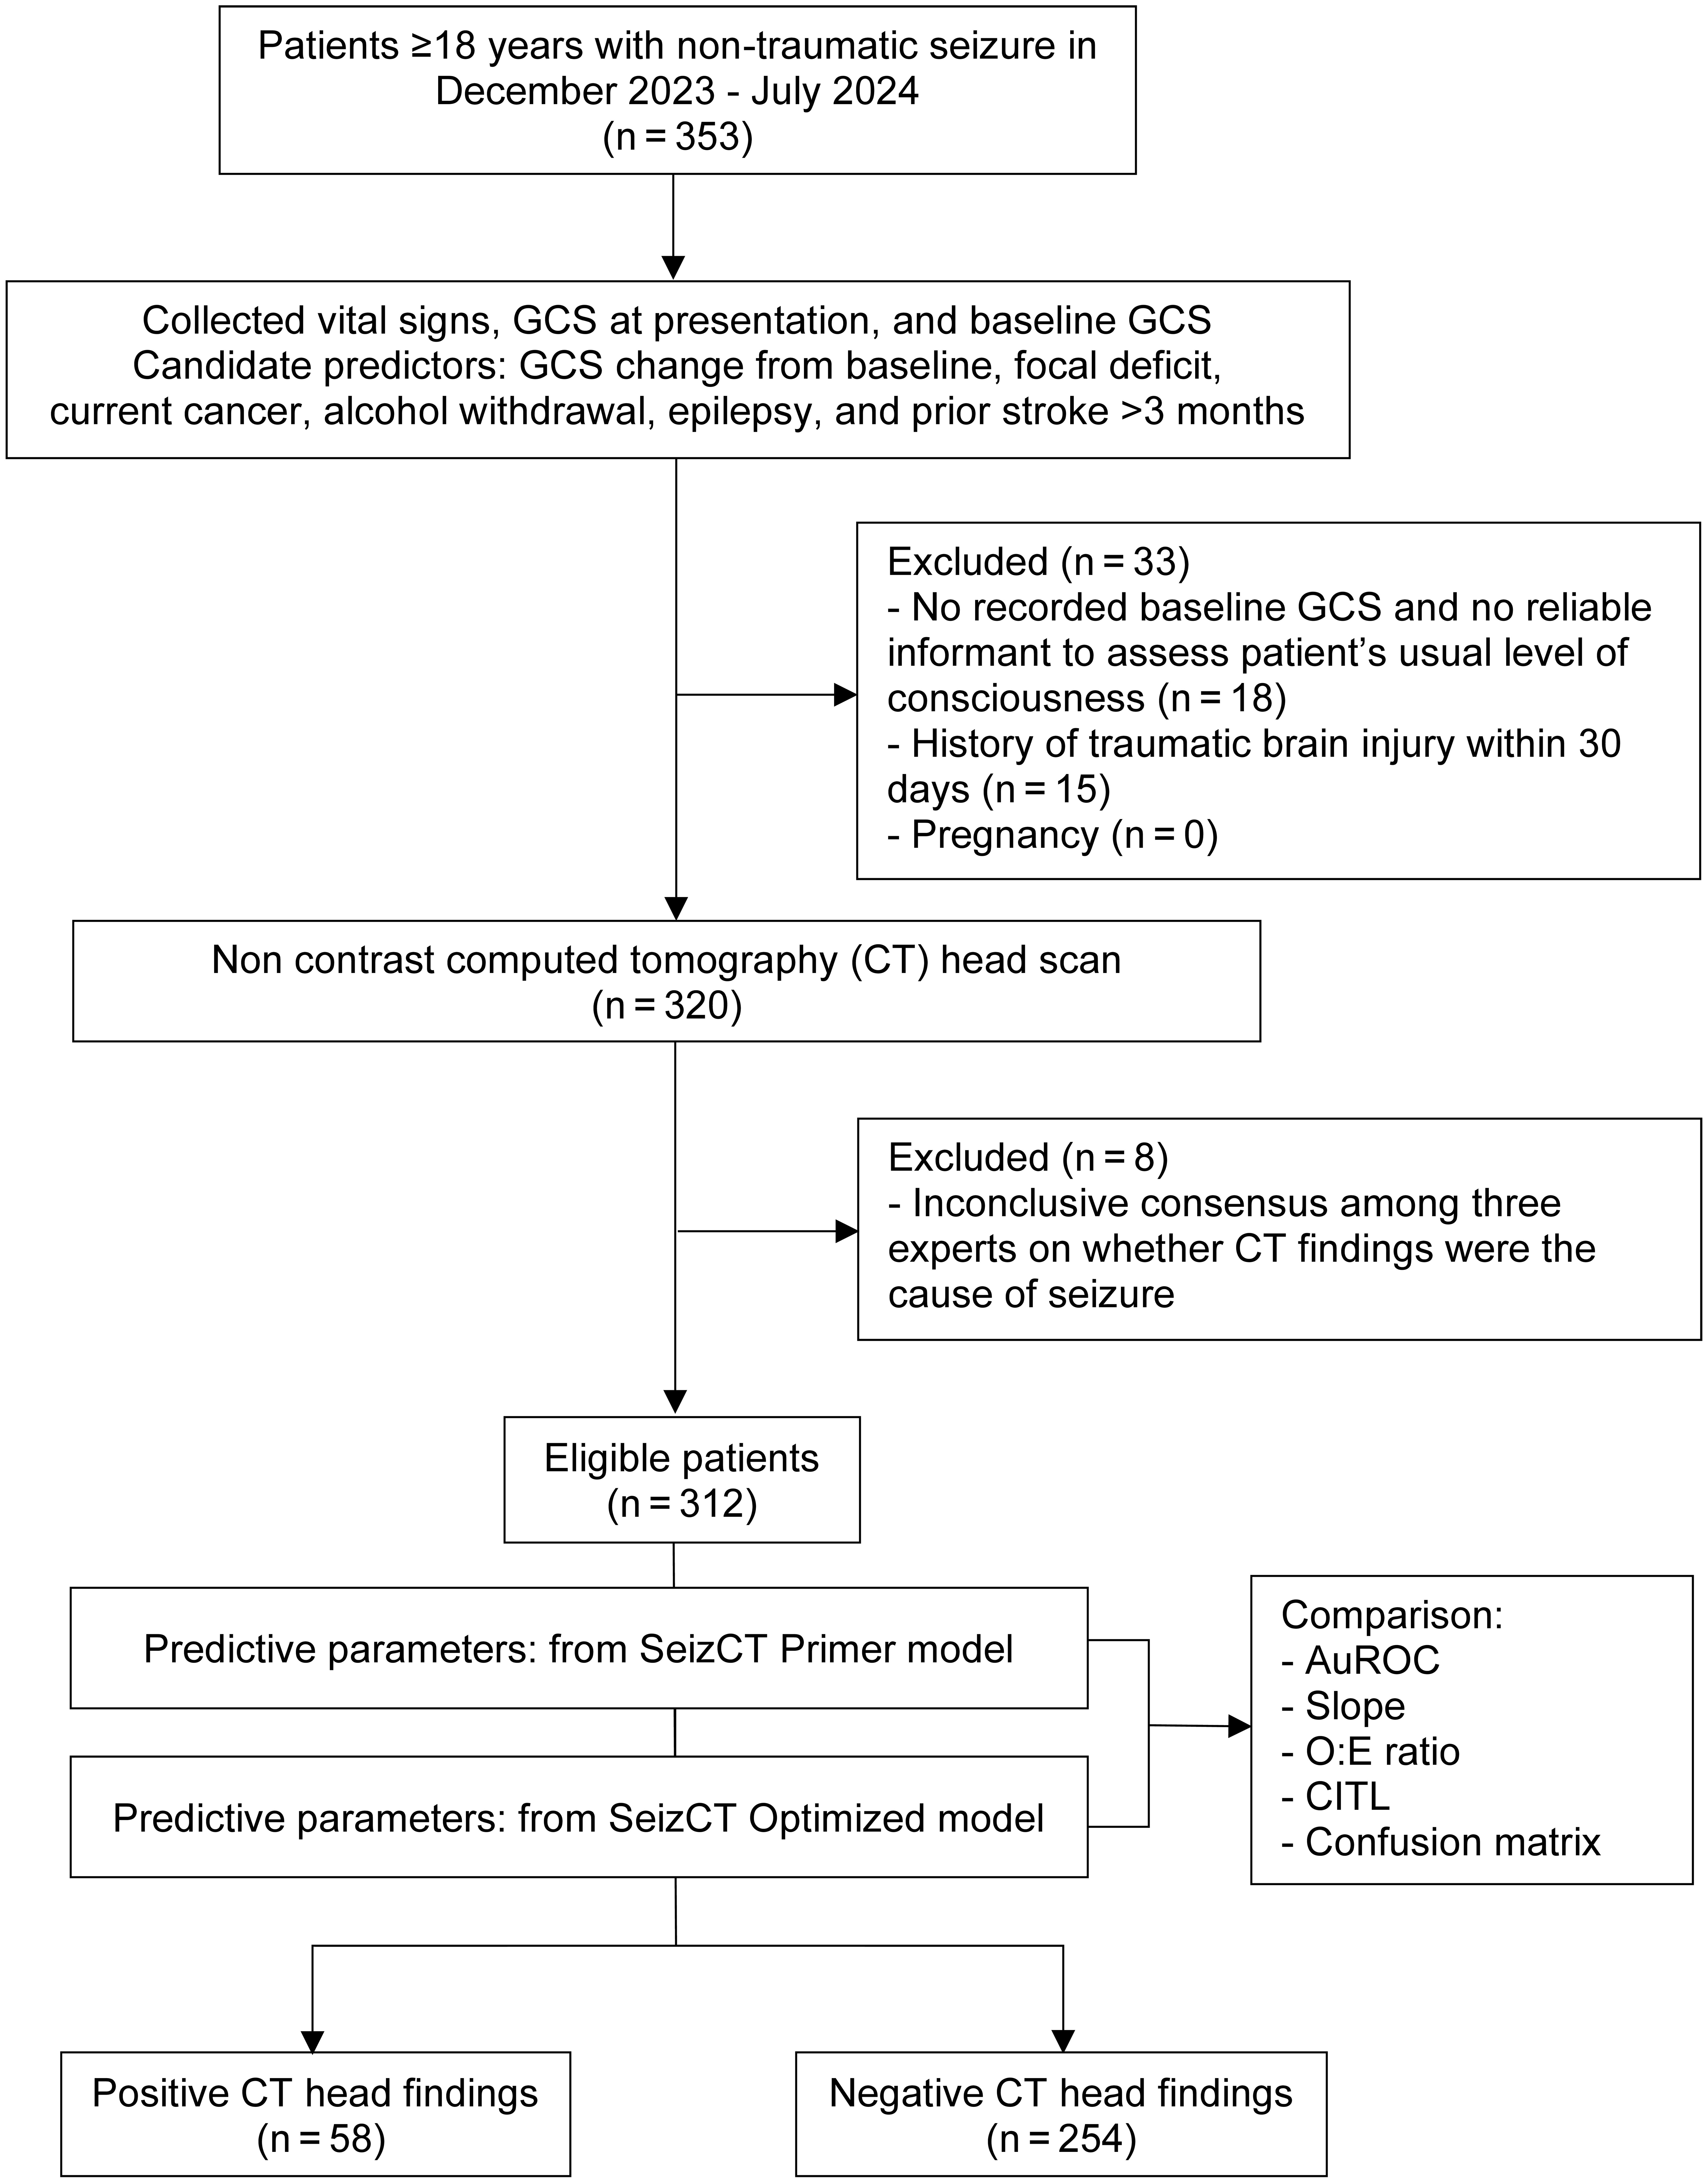
Figure 1. Study flow diagram. GCS: Glasgow Coma Scale; AuROC: area under the receiver operating characteristic curve; O:E ratio: observed-to-expected ratio; CITL: calibration-in-the-large.
| Journal of Clinical Medicine Research, ISSN 1918-3003 print, 1918-3011 online, Open Access |
| Article copyright, the authors; Journal compilation copyright, J Clin Med Res and Elmer Press Inc |
| Journal website https://jocmr.elmerjournals.com |
Original Article
Volume 17, Number 11, November 2025, pages 653-662
Comparison of the SeizCT Primer and Optimized Models for Predicting Positive Computed Tomography Findings in Patients With Non-Traumatic Seizures
Figures


Tables
| Baseline characteristics | SeizCT primer (n = 362), n (%) | SeizCT optimized (n = 625), n (%) | Validation (n = 312), n (%) | P value |
|---|---|---|---|---|
| SD: standard deviation; SBP: systolic blood pressure; DBP: diastolic blood pressure; GCS: Glasgow Coma Scale; IQR: interquartile range; GCS change: GCS change from baseline; CT: computed tomography. | ||||
| Male | 267 (73.8) | 468 (74.9) | 210 (67.3) | 0.045 |
| Age (years), mean ± SD | 55.2 ± 16.2 | 54.8 ± 16.8 | 53.4 ± 17.5 | 0.347 |
| SBP (mm Hg), mean ± SD | 141.2 ± 29.2 | 140.6 ± 28.2 | 137.1 ± 29.0 | 0.126 |
| DBP (mm Hg), mean ± SD | 83.9 ± 18.6 | 84.6 ± 18.4 | 82.1 ± 19.3 | 0.152 |
| GCS, median (IQR) | 15 (10, 15) | 15 (10, 15) | 15 (11, 15) | 0.076 |
| Eye, median (IQR) | 4 (3, 4) | 4 (4, 4) | 4 (4, 4) | 0.414 |
| Verbal, median (IQR) | 5 (1, 5) | 5 (2, 5) | 5 (2, 5) | 0.003 |
| Motor, median (IQR) | 6 (5, 6) | 6 (5, 6) | 6 (5, 6) | 0.271 |
| GCS change, median (IQR) | 0 (0, 5) | 0 (0, 4) | 0 (0, 2) | 0.006 |
| Focal neurological deficit | 62 (17.1) | 153 (24.5) | 92 (29.5) | 0.001 |
| Previous CT | ||||
| No previous CT | 172 (47.5) | 311 (49.8) | 125 (40.1) | 0.003 |
| Normal finding | 91 (25.1) | 110 (17.6) | 73 (23.4) | |
| Abnormal finding | 99 (27.3) | 204 (32.6) | 114 (36.5) | |
| Prior stroke more than 3 months | 74 (20.4) | 111 (17.8) | 90 (28.9) | 0.001 |
| Current cancer | 15 (4.1) | 31 (5.0) | 21 (6.7) | 0.302 |
| Epilepsy | 86 (23.8) | 151 (24.2) | 77 (24.7) | 0.960 |
| End-stage renal disease | 25 (6.9) | 44 (7.0) | 15 (4.8) | 0.398 |
| Chronic liver disease | 5 (1.4) | 16 (2.6) | 33 (10.6) | < 0.001 |
| Anticoagulant use | 11 (3.1) | 33 (5.3) | 12 (3.9) | 0.257 |
| Hypertension | 124 (34.3) | 207 (33.1) | 138 (44.2) | 0.003 |
| Diabetes mellitus | 65 (18.0) | 106 (17.0) | 65 (20.8) | 0.347 |
| Alcohol consumption | 147 (40.7) | 237 (38.3) | 77 (24.7) | < 0.001 |
| Substance use | 6 (1.7) | 22 (3.5) | 8 (2.6) | 0.224 |
| Alcohol withdrawal symptoms | 58 (16.0) | 94 (15.0) | 34 (10.9) | 0.001 |
| Positive CT findings | 71 (19.6) | 118 (18.9) | 58 (18.6) | 0.940 |
| Parameters | SeizCT primer model | SeizCT optimized model | P value |
|---|---|---|---|
| aP value from a two-sided equivalence test. AuROC: area under the receiver operating characteristic curve; O:E ratio: observed-to-expected ratio; CITL: calibration-in-the-large. | |||
| AuROC (original) | 0.8156 (0.7586, 0.8727) | 0.8221 (0.7813, 0.8629) | 0.798 |
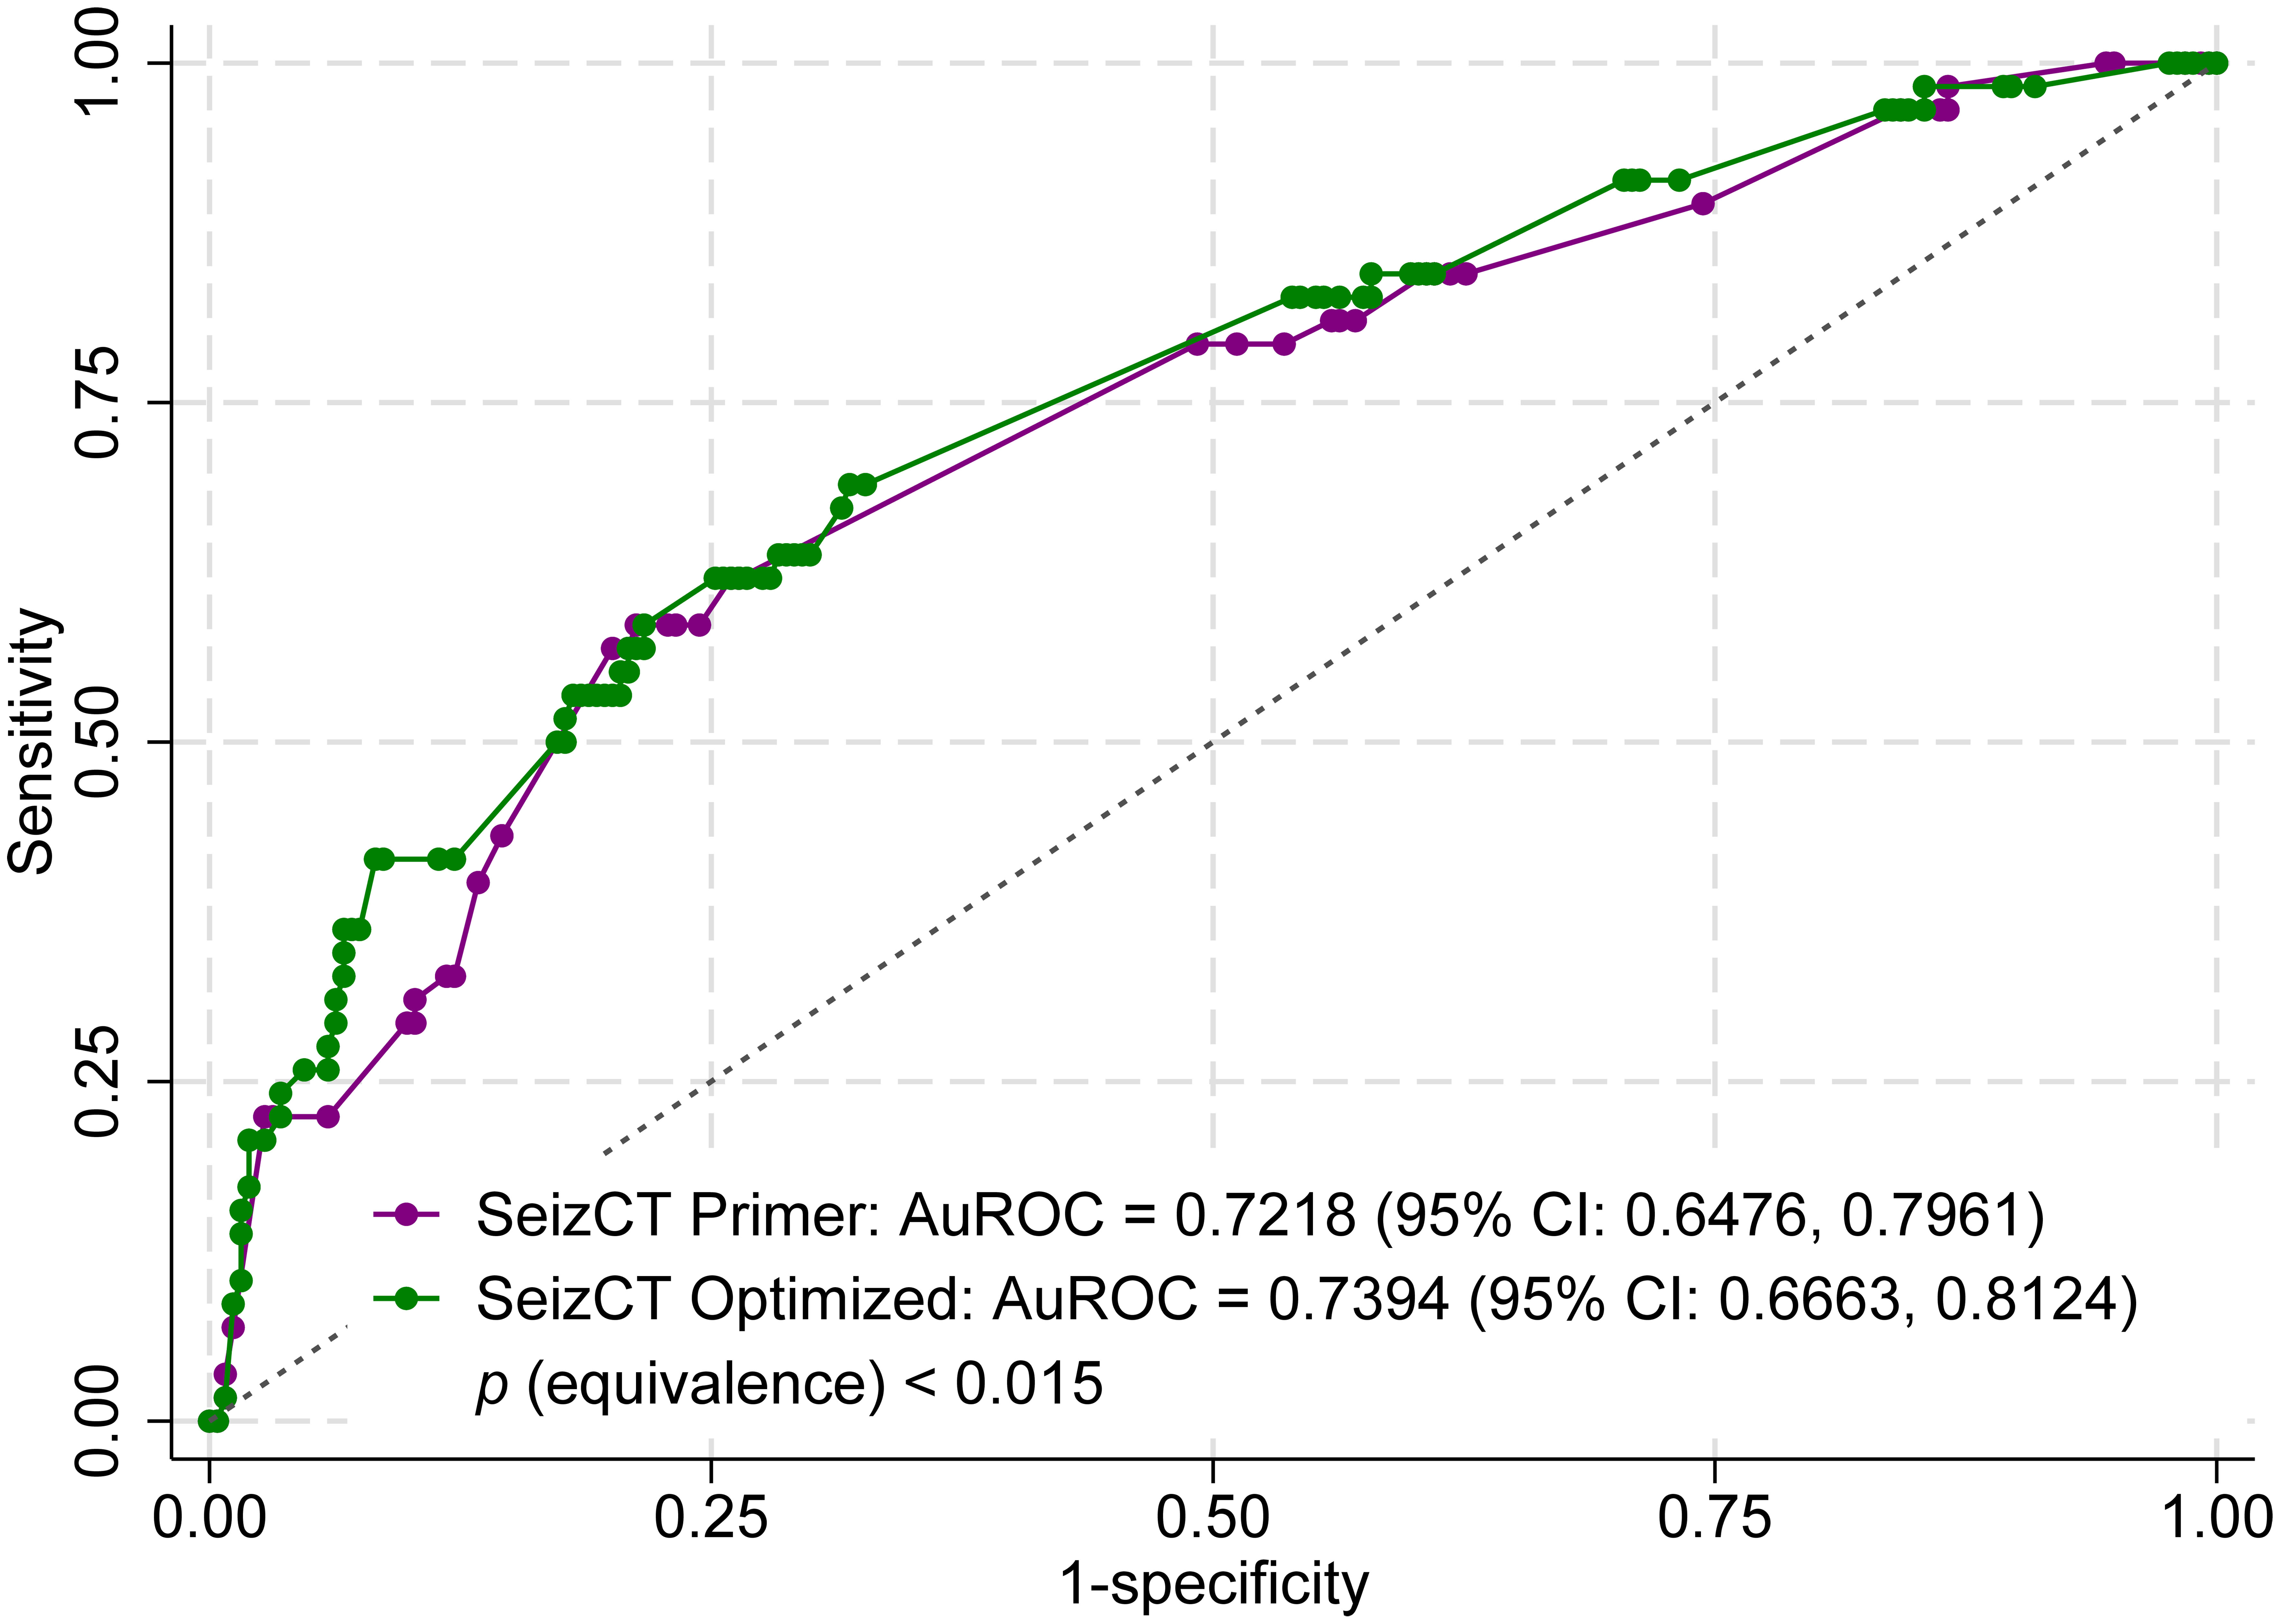
| AuROC (validation) | 0.7218 (0.6476, 0.7961) | 0.7394 (0.6663, 0.8124) | < 0.015a |
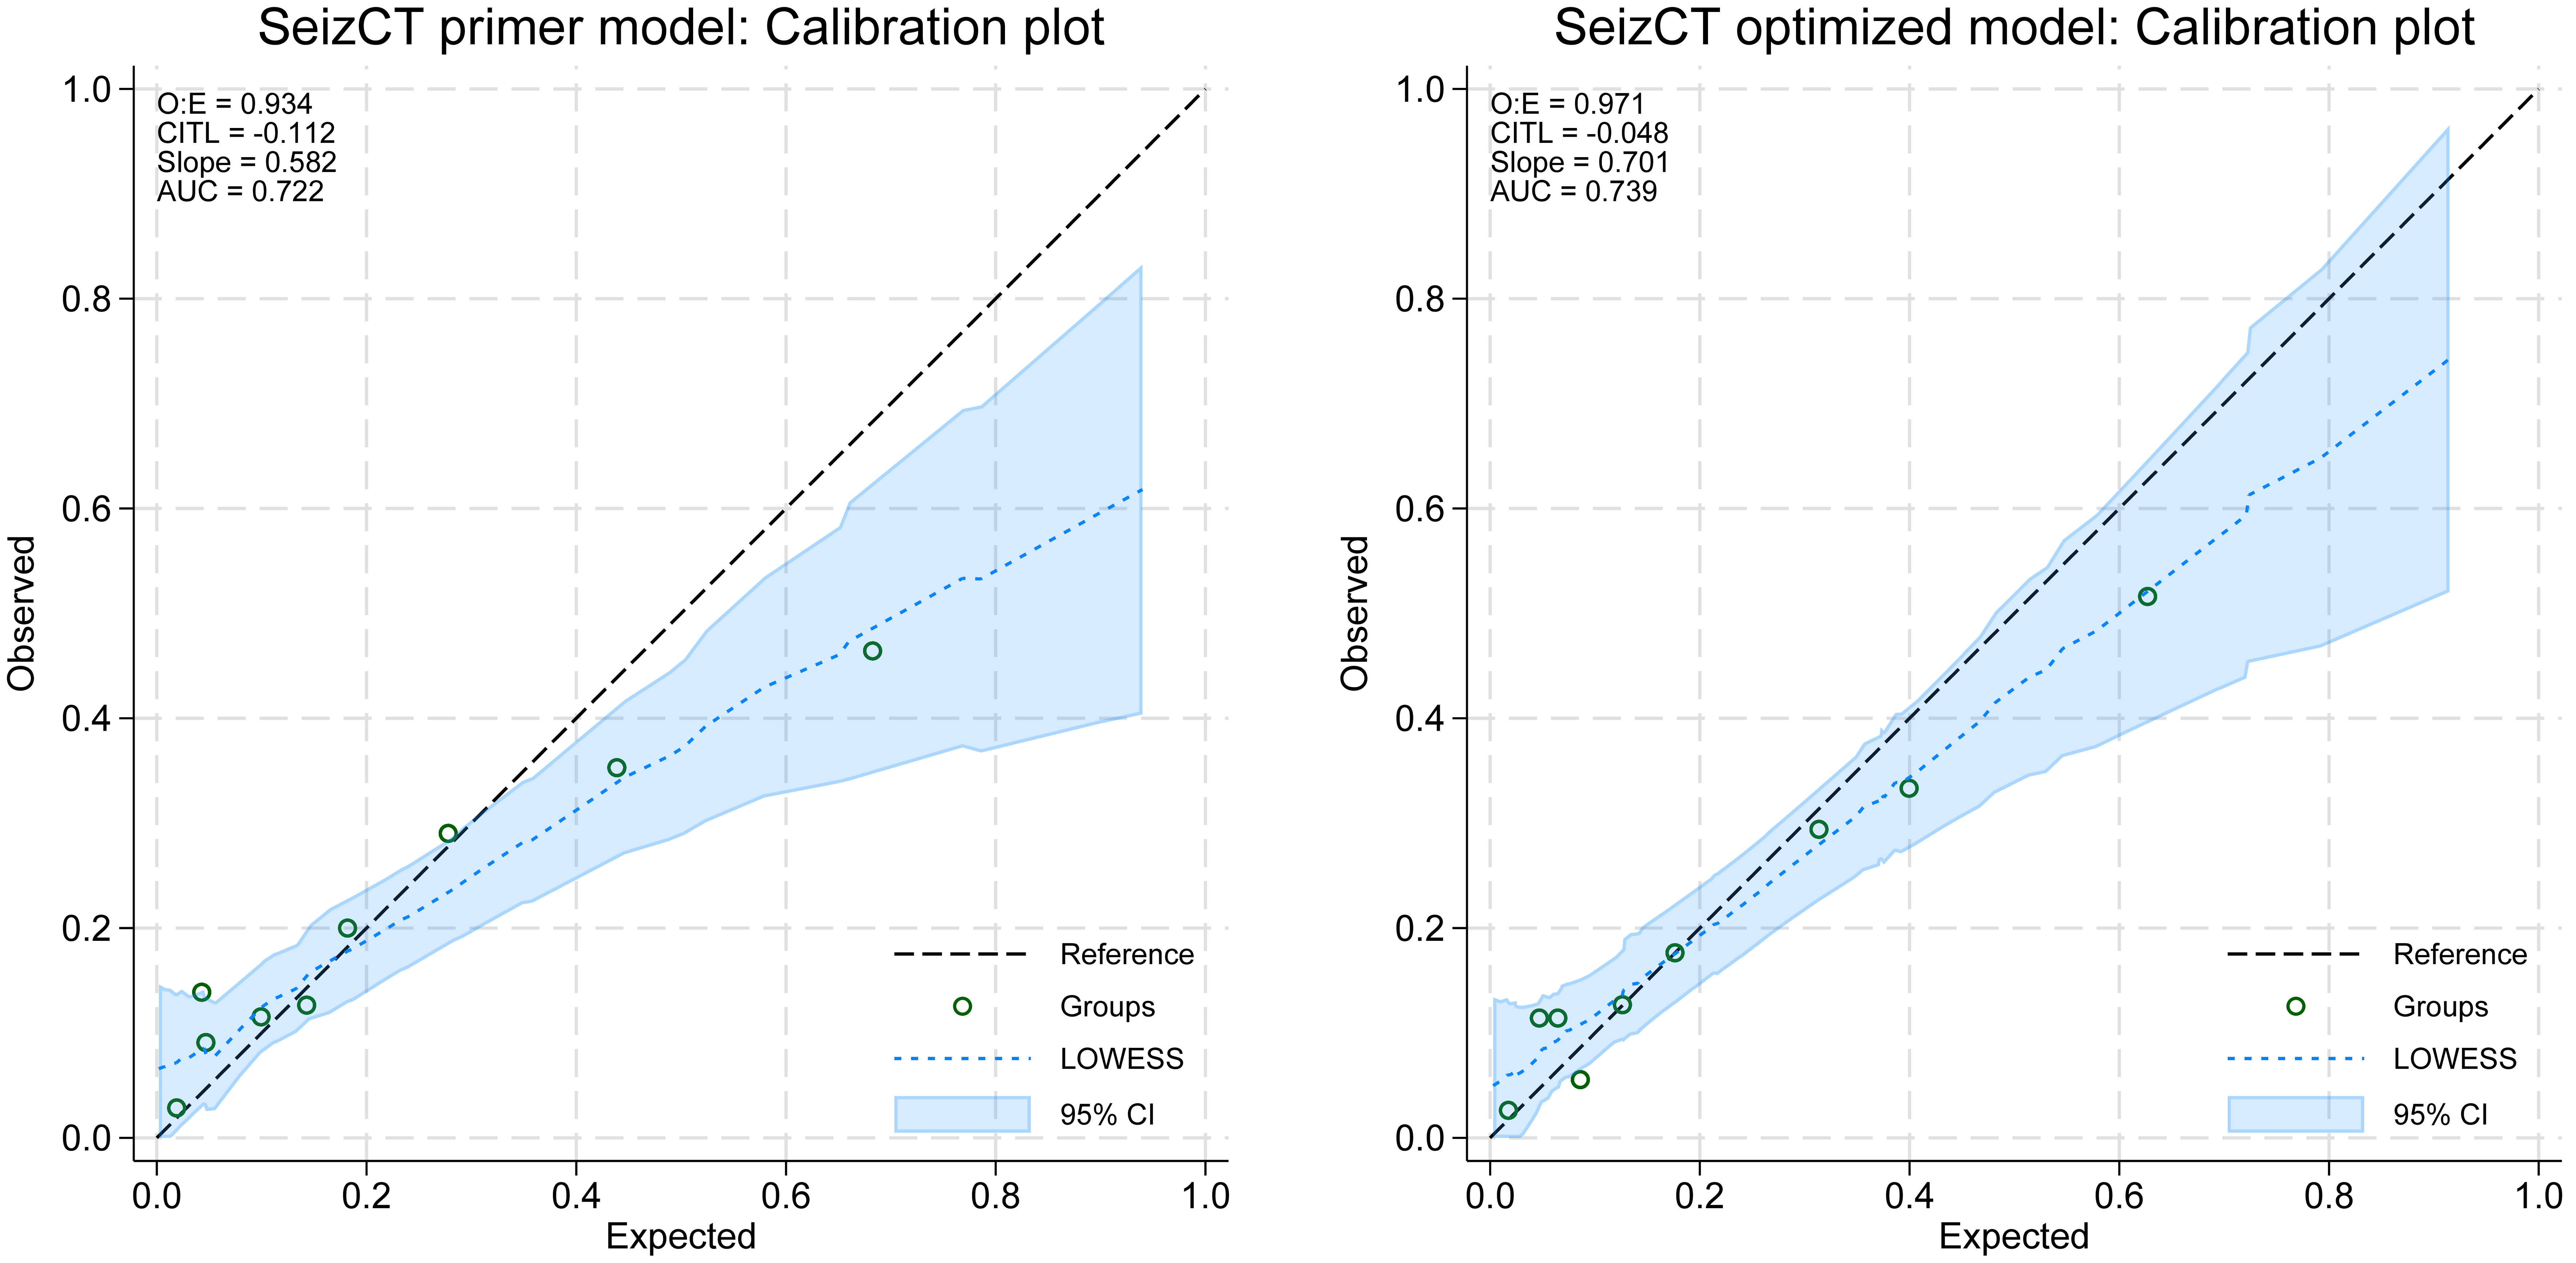
| Slope | 0.582 (0.358, 0.805) | 0.701 (0.454, 0.948) | 0.002 |
| O:E ratio | 0.934 | 0.971 | 0.030 |
| CITL | -0.112 (-0.441, 0.216) | -0.048 (-0.371, 0.276) | 0.783 |
| CT brain | SeizCT primer model | SeizCT optimized model | ||
|---|---|---|---|---|
| Cut-point probabilities | ||||
| > 20 | ≤ 20 | > 22.57 | ≤ 22.57 | |
| CT: computed tomography; PPV: positive predictive value; NPV: negative predictive value. | ||||
| Positive (n = 58) | 34 (10.9) | 24 (7.7) | 33 (10.6) | 25 (8.0) |
| Negative (n = 254) | 59 (18.9) | 195 (62.5) | 53 (17.0) | 201 (64.4) |
| Total | 93 | 219 | 86 | 226 |
| Sensitivity | 58.6 (44.9, 71.4) | 56.9 (43.2, 69.8) | ||
| Specificity | 76.8 (71.1, 81.8) | 79.1 (73.6, 84.0) | ||
| PPV | 36.6 (26.8, 47.2) | 38.4 (28.1, 49.5) | ||
| NPV | 89.0 (84.1, 92.9) | 88.9 (84.1, 92.7) | ||