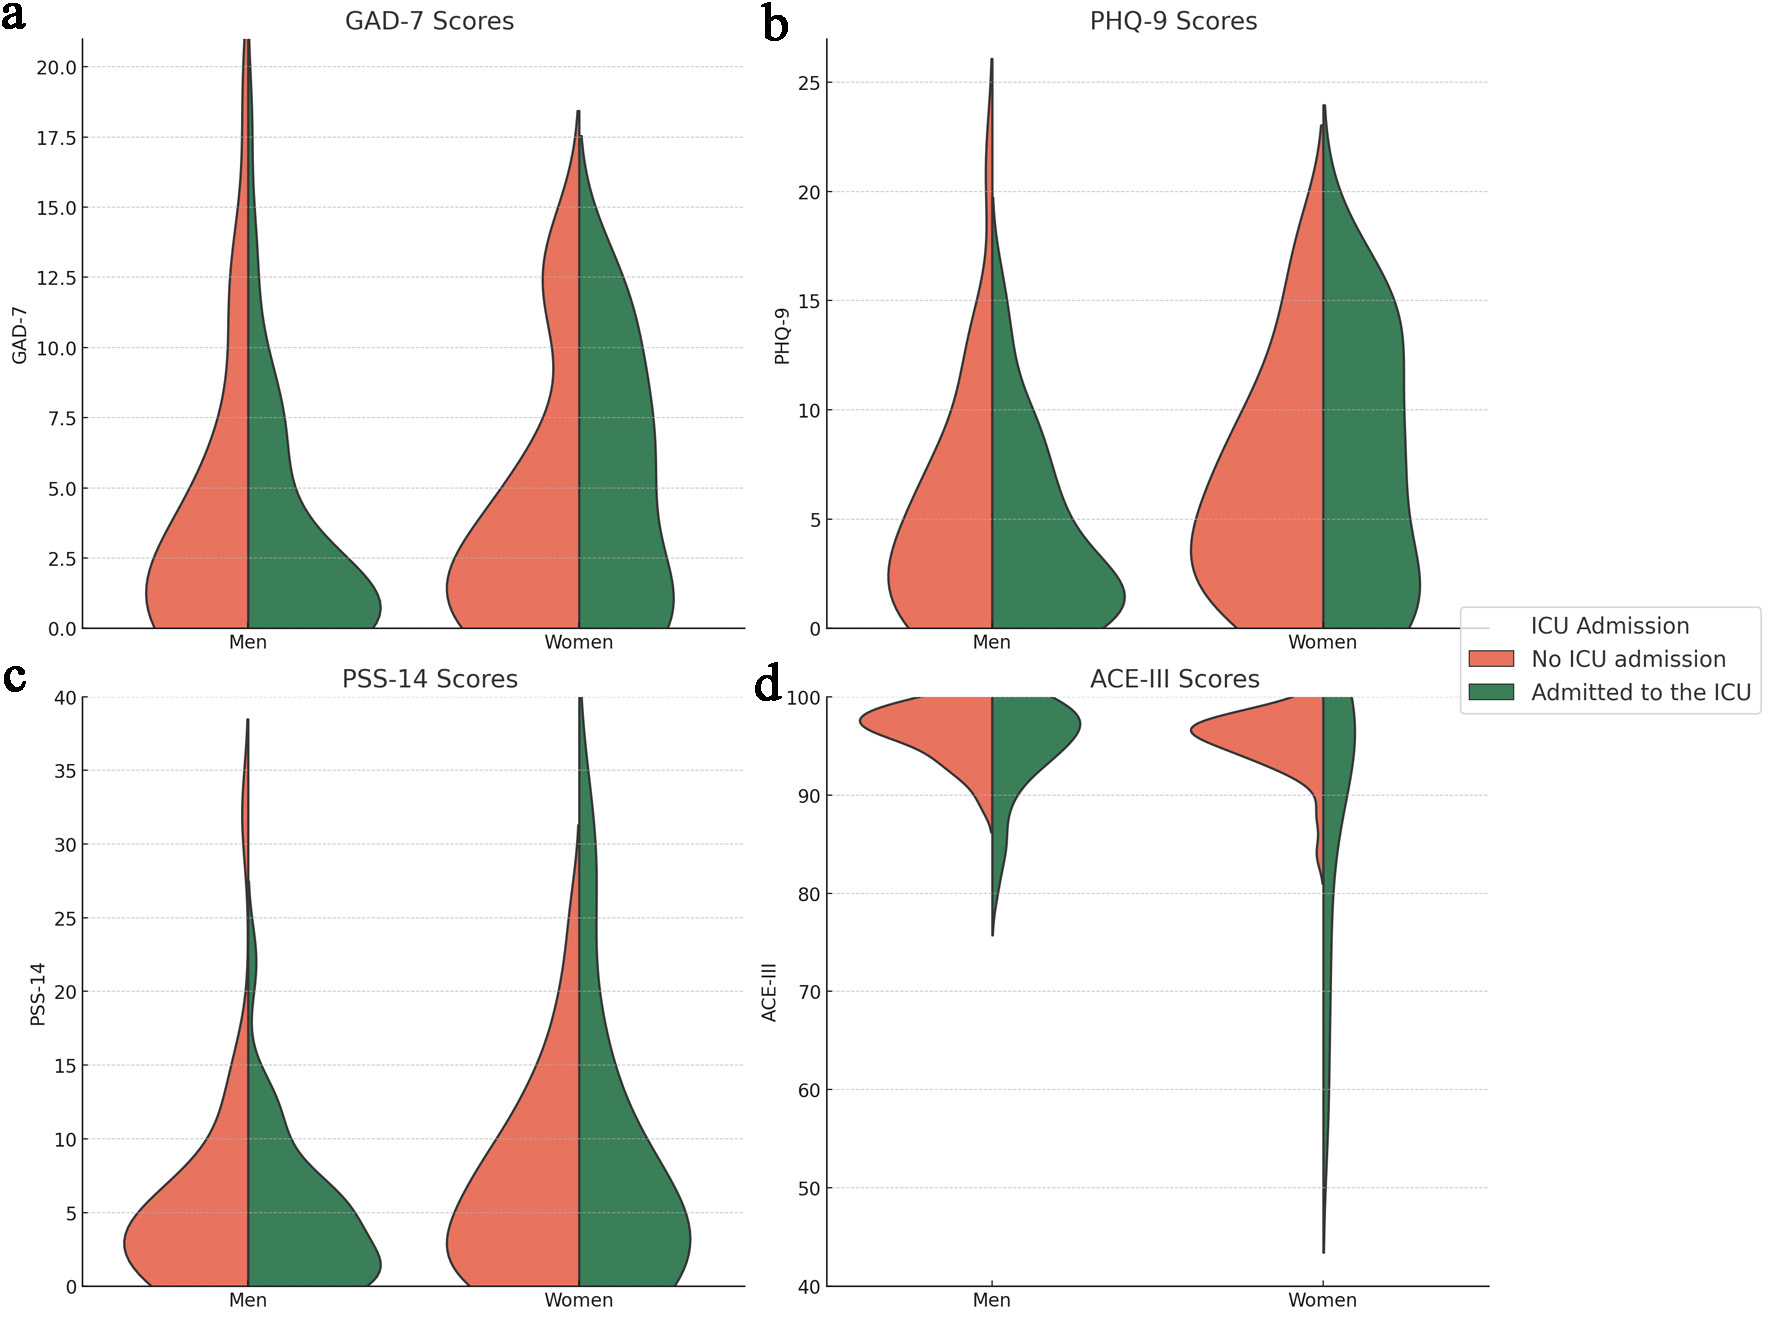
| Journal of Clinical Medicine Research, ISSN 1918-3003 print, 1918-3011 online, Open Access |
| Article copyright, the authors; Journal compilation copyright, J Clin Med Res and Elmer Press Inc |
| Journal website https://jocmr.elmerjournals.com |
Original Article
Volume 18, Number 1, January 2026, pages 18-30
Long-Term Mental Health Evaluation After COVID-19: Insights From the CARDIO COVID 20–21 Registry
Figures


Tables
| Scale | Use | Categories |
|---|---|---|
| ACE-III: Addenbrooke’s Cognitive Examination-III; GAD-7: General Anxiety Disorder-7; PHQ-9: Patient Health Questionnaire-9; PSS-14: Perceived Stress Scale-14. | ||
| GAD-7 | A 7-item scale to screen for general anxiety disorder [20]. A cutoff point of 5 has shown a sensitivity of 94% and a specificity of 65% [21]. The version of this scale in Spanish has been previously validated in Colombia [22]. | 0–4: none to minimal anxiety; 5–9: mild anxiety; 10–14: moderate anxiety; ≥ 15: severe anxiety |
| PHQ-9 | A 9-item scale validated for depression screening [23, 24]. A cutoff point of 5 has a sensitivity of 87% and a specificity of 80% [25]. The version of this scale in Spanish has been previously validated in Colombia [26]. | 0–4: none to minimal depression; 5–9: mild depression; 10–14: moderate depression; 15–19: fairly severe depression; ≥ 20: severe depression. |
| PSS-14 | A 14-item questionnaire used to measure psychological stress [27]. The Spanish version of this scale has been previously validated [28]. | 0–13: Low perceived stress; 14–26: moderate perceived stress; 27–40: high perceived stress. |
| ACE-III | An extended cognitive assessment to screen for cognitive dysfunction. A cutoff score of 88 has a sensitivity of 100% and a specificity of 93% [29]. The Spanish version has been previously validated [30]. | 100–88: No cognitive dysfunction; 88–82: possible mild cognitive dysfunction; < 82 possible dementia. |
| Variable | All, N = 152 | Sex | ICU admission | ||||
|---|---|---|---|---|---|---|---|
| Female, N = 63 | Male, N = 89 | P value | No, N = 64 | Yes, N = 88 | P value | ||
| Statistical significance was evaluated using Fisher’s exact test, Pearson’s Chi-squared test, or Wilcoxon rank-sum test, as appropriate. aValues are presented as mean ± standard deviation. bIn Colombia, residential areas are classified into six socioeconomic strata (1–6) based on income levels. Stratum 1 represents the lowest-income areas receiving the greatest public utility subsidies, whereas Stratum 6 corresponds to the highest-income areas paying full rates without subsidies. cSmoking exposure refers to previous or current smoking. ARB: angiotensin receptor blocker; BMI: body mass index; DBP: diastolic blood pressure; ICU: intensive care unit; SBB: systolic blood pressure. | |||||||
| Demographics | |||||||
| Age, yearsa | 56 (14) | 54 (16) | 57 (12) | 0.3 | 54 (16) | 57 (13) | 0.15 |
| Years of educationa | 10.7 (4.8) | 10.7 (4.4) | 10.6 (5.1) | 0.8 | 11.7 (4.2) | 9.9 (5.0) | 0.012 |
| Socioeconomic statusa,b | 2.64 (1.37) | 2.54 (1.39) | 2.71 (1.36) | 0.374 | 2.83 (1.55) | 2.50 (1.21) | 0.316 |
| Follow-up duration (months)a | 24.5 (2.05) | 24.4 (2.21) | 24.6 (1.94) | 0.7 | 24.8 (1.80) | 24.4 (2.21) | 0.3 |
| Comorbidities | |||||||
| Overweight/obesity | 74 (48%) | 32 (50%) | 42 (49%) | 0.9 | 26 (41%) | 48 (56%) | 0.10 |
| Hypertension | 62 (40%) | 26 (41%) | 36 (40%) | > 0.9 | 26 (40%) | 36 (40%) | > 0.9 |
| Diabetes mellitus | 26 (17%) | 10 (16%) | 16 (18%) | 0.8 | 2 (3.2%) | 24 (27%) | < 0.001 |
| Pharmacological history | |||||||
| ARB | 50 (33%) | 20 (32%) | 30 (34%) | 0.80 | 22 (34%) | 28 (32%) | 0.74 |
| Statins | 34 (22%) | 14 (22%) | 20 (22%) | 0.97 | 10 (16%) | 24 (27%) | 0.089 |
| Hypoglycemic drugs | 28 (18%) | 13 (21%) | 15 (17%) | 0.55 | 5 (7.8%) | 23 (26%) | 0.004 |
| Physical examination and lifestyle | |||||||
| SBP (mm Hg)a | 127 (15) | 127 (15) | 127 (16) | 0.994 | 125 (16) | 128 (15) | 0.217 |
| DBP (mm Hg)a | 78 (9) | 77 (9) | 79 (9) | 0.108 | 79 (9) | 78 (9) | 0.833 |
| Heart rate (bpm)a | 72 (12) | 74 (12) | 71 (11) | 0.109 | 72 (11) | 73 (12) | 0.575 |
| BMI (kg/m2)a | 28.5 (4.9) | 29.1 (5.2) | 28.2 (4.7) | 0.426 | 27.5 (4.2) | 29.3 (5.2) | 0.029 |
| Smoking exposurec | 21 (14%) | 6 (9.5%) | 15 (17%) | 0.197 | 7 (11%) | 14 (16%) | 0.380 |
| Scale | All, N = 152 | Sex | ICU admission | ||||
|---|---|---|---|---|---|---|---|
| Female, N = 63 | Male, N = 89 | P value | No, N = 64 | Yes, N = 88 | P value | ||
| Statistical significance was evaluated using Wilcoxon rank sum test and Fisher’s exact test for count data; Fisher’s exact test for count data with simulated P-value (based on 2,000 replicates) was used. ACE-III: Addenbrooke’s Cognitive Examination; GAD-7: General Anxiety Disorder-7; ICU: intensive care unit; PHQ-9: Patient Health Questionnaire-9; PSS-14: Perceived Stress Scale-14. | |||||||
| GAD-7 | 0.052 | 0.7 | |||||
| No symptoms or minimal | 102 (67%) | 37 (59%) | 65 (73%) | 44 (69%) | 58 (66%) | ||
| Mild symptoms | 30 (20%) | 14 (22%) | 16 (18%) | 10 (16%) | 20 (23%) | ||
| Moderate symptoms | 18 (12%) | 12 (19%) | 6 (6.7%) | 9 (14%) | 9 (10%) | ||
| Severe symptoms | 2 (1.3%) | 0 (0%) | 2 (2.2%) | 1 (1.6%) | 1 (1.1%) | ||
| Abnormal (> 4) | 50 (33%) | 26 (41%) | 24 (27%) | 0.08 | 20 (31%) | 30 (34%) | 0.07 |
| PHQ-9 | 0.02 | 0.8 | |||||
| None-minimal | 78 (51%) | 25 (40%) | 53 (60%) | 31 (48%) | 47 (53%) | ||
| Mild | 46 (30%) | 21 (33%) | 25 (28%) | 21 (33%) | 25 (28%) | ||
| Moderate | 16 (11%) | 8 (13%) | 8 (8.9%) | 7 (11%) | 9 (10%) | ||
| Moderate-severe | 11 (7.2%) | 9 (14%) | 2 (2.2%) | 4 (6.3%) | 7 (8%) | ||
| Severe | 1 (0.7%) | 0 (0%) | 1 (1.1%) | 1 (1.6%) | 0 (0%) | ||
| Abnormal (> 4) | 74 (49%) | 38 (60%) | 36 (40%) | 0.021 | 33 (52%) | 41 (47%) | 0.6 |
| PSS-14 | 0.011 | 0.5 | |||||
| Low perceived stress | 136 (89%) | 51 (81%) | 85 (95.5%) | 57 (89%) | 79 (89.8%) | ||
| Moderate perceived stress | 12 (7.9%) | 9 (14%) | 3 (3.4%) | 6 (9.4%) | 6 (6.8%) | ||
| High perceived stress | 4 (2.6%) | 3 (4.8%) | 1 (1.1%) | 1 (1.6%) | 3 (3.4%) | ||
| Abnormal (> 13) | 16 (11%) | 12 (19%) | 4 (4.5%) | 0.006 | 7 (11%) | 9 (10.2%) | > 0.9 |
| ACE-III | 0.018 | 0.007 | |||||
| No cognitive dysfunction | 135 (89%) | 52 (83%) | 83 (93.3%) | 63 (98.4%) | 72 (82%) | ||
| Cognitive dysfunction (< 88) | 17 (11%) | 11 (17%) | 6 (6.7%) | 0.065 | 1 (1.6%) | 16 (18%) | < 0.001 |
| Variable | Univariable | Multivariable | ||||
|---|---|---|---|---|---|---|
| Beta | 95% CI | P value | Beta | 95% CI | P value | |
| aSmoking exposure refers to previous or current smoking. bSocioeconomic status was based on Colombia’s official residential socioeconomic strata classification, which categorizes households into six levels (1–6) according to housing and neighborhood characteristics. ACE-III: Addenbrooke’s Cognitive Examination III; BMI: body mass index; CI: confidence interval; ICU: intensive care unit. | ||||||
| Age | −0.05 | −0.13, 0.03 | 0.23 | −0.004 | −0.10, 0.09 | 0.94 |
| Male | 2.96 | 0.65, 5.27 | 0.01 | 3.66 | 1.40, 5.93 | 0.002 |
| Years of education | 0.49 | 0.26, 0.72 | < 0.001 | 0.47 | 0.20, 0.74 | < 0.001 |
| ICU admission | −3.10 | −5.40, −0.80 | 0.01 | −2.95 | −5.37, −0.54 | 0.02 |
| BMI (kg/m2) | −0.01 | −0.25, 0.23 | 0.92 | 0.02 | −0.21, 0.26 | 0.84 |
| Smoking exposurea | −1.51 | −4.88, 1.85 | 0.38 | −1.75 | −5.04, 1.53 | 0.29 |
| Hypertension | 0.84 | −1.49, 3.17 | 0.48 | 2.56 | 0.16, 4.96 | 0.04 |
| Diabetes mellitus | −1.38 | −4.01, 1.25 | 0.30 | −0.87 | −3.61, 1.86 | 0.53 |
| Socioeconomic status | 0.63 | −0.22, 1.48 | 0.14 | −0.10 | −0.98, 0.77 | 0.82 |